Chicagostock Trading

Chicagostock Trading

Where to Buy Gold

GC________Monthly___2_2007___4_2013.jpg


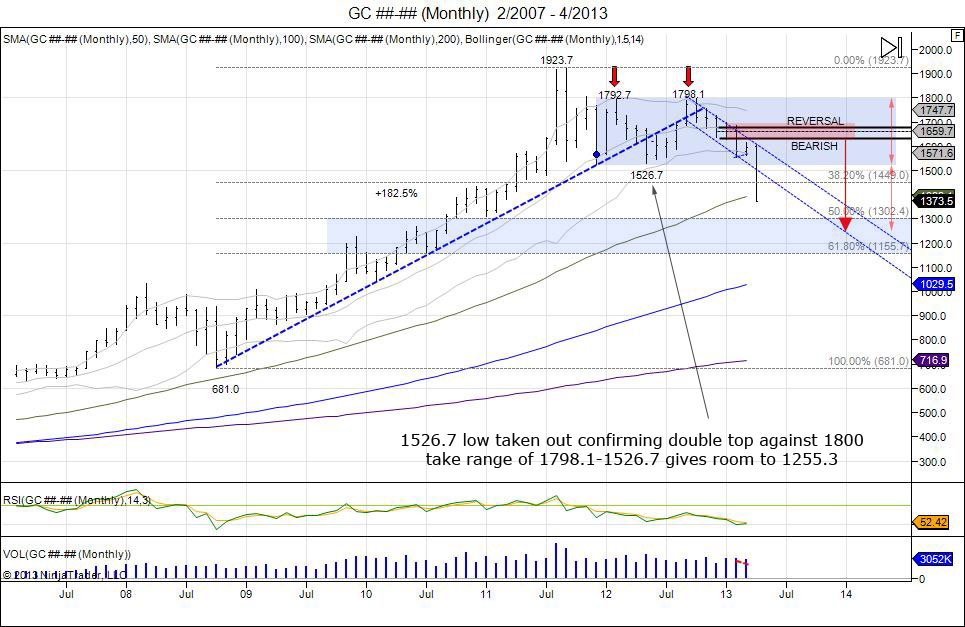
Since the December 2012 FOMC meeting that "Spooked the gold market" as the FOMC members attached a 6.5% unemployment for a target on rates, gold has fallen $362.6.  However since the failure to break above 1800 in 2012 and double topping at 1798.1, the market is down $442.8. So why the sudden crash over the past 2 days? As we know the market ran from 681-1923.7 as the FOMC cut their rates down to 0%.  The year of 2012 was all about consolidation.  It traded in a range of 1526.7-1798.1 which lured in a lot of late buyers betting on "hyperinflation".  As gold has most recently failed and broken below this 2012 low of 1526.7, it has confirmed the highs in 2012 as a double top.  This range of 271.4 (1798.1-1526.7) can now be subtracted below 1526.7 to give room to expand the market down to 1255.3.  This target when put out in December was looked at as a crazy and a lot of "gold bugs" were insulted. Today the market is bringing pain to these gold bugs as it shakes them out.  The current breakdown clears and shakes out buyers who came into the market above 1500.  The move is good for "smart" money who have been sitting on the sidelines awaiting for the market to go on sale. Completion of this move is seen at 1255 which also retraces the market 50% of its 681-1923 move. In the big picture, that would offer a 50% sale off the highs and bring the market back to where it broke out in 2010.  This range of 1200-1300 will offer an area of major support for the market to attempt to build a base for long term buyers to watch for to come in and buy the sale.  A break of 1150 would give room to test major support at 1000 being where the market broke out in 2009.  Failure to hold above sees the 681 low  targeted and at that point the long gold story would be all over. Short term yes the market is very over sold and the long community is in shell shock, the old lows of 1526 is now new major resistance with next level of sell stops below 1309.1 as the 2011 lows.
 

Continue reading
4638 Hits

SP500, Bonds, Yen, Euro Chart Updates

 SP500

ES________60_Min___3_27_2013b.jpg

Since the gap down two Sunday's ago on the Cyprus news and bouncing off the old highs from February at 1530, the market has gone into a major tug of war whipping short sellers who have tried to come in following the news.  The "plunge protection team" has managed to keep the momentum alive with higher lows.  Just 1 week after that gap down, the squeeze managed to print new highs on the year at 1560.50. Following this new high,  another pullback was seen to retest the prior low of 1535 only to see another higher low develop at 1539.  On Tuesday this led to a recovery that retested and pressed against resistance based off the Sunday high.  This has led to the market climbing back Tuesday night and retesting the 1560.50 level with the market tapping it again, however failing to breach.  Thus far this has led into another pullback, retesting the previous lows of 1539 with lows of 1545.75.  Higher low again as the range tightens and the market builds buy stops above the highs going into the holiday weekend. Sell stops also building below this trend of higher lows and they will be targeted eventually, question will be if momentum can stay alive into the holiday weekend as the range is now 154575-156050.  Resistance met against 1558 with stops above 1560.50.  Support  1548-1539. Bonds as shown below have continued to hold their bid following the Cyprus gap above 14200 and this has led to tap the March highs of 14429.  The squeeze eventually completes on a move past the February high of 14611 to confirm the break below 14200 as a failure.

Continue reading
3642 Hits

SP500 Double Top Caution

 ES________120_Min___3_25_2013.jpg


Last Sunday's breakdown to 1529.50 on the Cyprus news saw the market bounce off the old February highs of 1530 with lows of 1529.50.  This led to a roller coaster ride for the week as the market climbed back to 1552.50, fell down to 1531.75, squeezed back to 1555.75, fell back to 1535.00, and most recently completed the pattern of higher lows and higher highs by getting up to 1560.50.  This was a calculated attempt to defend those lows and make higher highs to squeeze out small sellers.  The latest high was done this Sunday night (one week after the gap down from 1544-1529.50), stopping out small shorts as the previous year high of 1558.75 was taken out.  The market has thus far rejected this new high and fallen down to where the it opened on Friday.  There is major risk now that this higher high turns into a failed breakout and a double top should buyers failed to defend the most recent pivot low of 1535.00.  Minor support off these lows are seen at 1539, however buyers should find it much harder to hold this trend and the lows of 1535 after new highs were set at 1560.50 which give much more pressure to take out these rising lows and squeeze out buyers.  This would confirm the new highs as a failure a double top with a breach of 1529.50. As discussed in the previous video, the market has been working on creating a head above 1530 for a head/shoulder topping pattern which confirms on a move below 1481.75.  


Continue reading
2531 Hits

Bond Market's Technical Signals Before Cyprus

 ZB 06-13 (60 Min)  3_15_2013_1.jpg

The bond market showed signs of reliance late last week as the SP500 printed new highs early Friday, yet bonds stabilized to create a base from those lows printed on Thursday at 14024.  Friday's action saw lows of 14105, testing and holding the range from Thursday's lows, and in turn building a right shoulder for an inverted head/shoulder pattern as aggressive buyers were using this as an entry with stops below Thursday's lows.  The move on Friday squeezing through the neckline of 14121 confirmed the inverted head/shoulder and rewarded buyers down to 14105. This range of 14121-14024 gave an upside target of 14223 to complete the expansion of the inverted head/shoulder. As the market held above this neckline on Friday, it consolidated after taking out the 14129 high made on NFP day and in turn this consolidation created a bull flag as seen in the hourly chart, also projecting 14223.  

All of this technical analysis confirmed Sunday night as the bond market opened higher at 14210 and squeezed to complete the target of 14223. The catalyst for this, 'news' out of Cyprus putting a tax on bank deposits.  Price action always precedes news as one cannot predict when news comes out, however they can use price action as the roadmap to guide where they can defend levels and where the market can go.  

ZB_06_13__60_Min___3_17_2013a.jpg

Continue reading
4432 Hits

Fear Turns to Greed at Breakeven.

2011 vs 2012 Patterns compared

ES________Weekly___Week_18_2008___Week_11_2013.jpg

Click charts to maximize.

The SP pattern from January of last year gapping open at 1259.75 above resistance just as the gap open at 1108 in September of 2010, is now mimicking the % move. The first breakout in September of 2010 at 1108 recall was just after the year of the Jackson hole QE start in August and the volatile period during that summer range to put in a bottom at 1002.75. The breakout in September squeezed a 24% rally leading the market into highs of 1373.50 to test the range from May of 2008 of where the fall out began. Last January this pattern was mimicked again with the market gapping higher at 1259.75 to start another breakout following another volatile period during the summer with lows of 1068. This gap at 1259.75 has held open and the wave has now squeezed the market up 23.1%, putting it right at the door steps of resistance from the range off all time highs of 1586.75. At this point the market is testing major resistance based off the all time highs and seeing a small pause. Whether the market can muster enough strength to squeeze through and stop out shorts to follow the Dow Jones average into new all time highs is yet to be known. The next major resistance would be the 1600 level as everyone sees, keyword everyone. The biggest risk is the SP500 not taking out the all time high, thus buyers remain complacent looking for new highs, buying pullbacks which gives way to setup bag holders.


Tags:
Continue reading
4148 Hits