Chicagostock Trading

Chicagostock Trading

SP500's ride from 1800 to 2040 with Chicagostock

HOW DID THIS:


GET TO THIS?:

Continue reading
4559 Hits

FLASH BACK on the FLASH CRASH

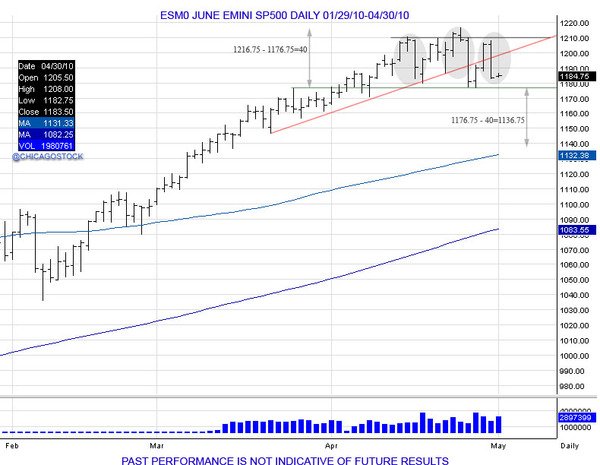
Going into May 6th, 2010, the SP500 was already having trouble on a daily basis, distributing within 1180-1220. After originally making a high of 1210.50 on April 15th, the market fell down to 1179.75 before recovering to take out the 1210.50 high and stop out early shorts.  This higher high up to 1216.75 failed to hold, seeing the market reverse to take out the previous 1179.75 low.  Lows of 1176.75 before another bounce was seen to retest the failed higher high at 1216.75.  The retest turned into a right shoulder as the market failed to push through the April 26th highs and fell through the previous low of 1176.75 to confirm a head/shoulder pattern.  Going into May 6th, the market had already broken below 1176.75 and had a target of 1136.75.


DRUDGE05_06_10.jpg 

SP5_6a.jpg

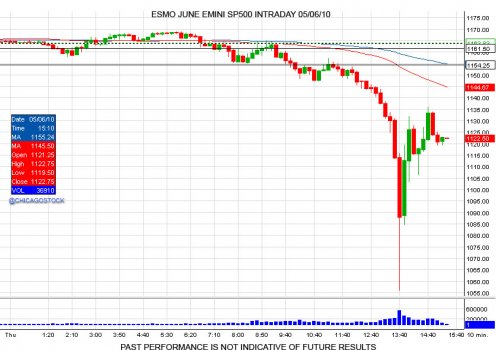
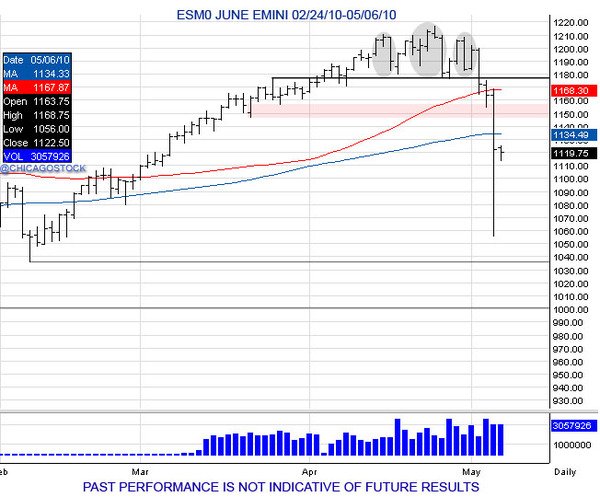
On the day of May 6th, 2010, the market was well below its 1176.75 neckline, opening at 1157.50 and making highs of 1165.00.  Pictures and videos of Greece riots being shown  added fuel to the fire. Things quickly deteriorated after the market fell below 1154 and turned the level into resistance.  This led to the head/shoulder target of 1136.75 to be completed.  With this target completing, this is when the flash crash flushed the market from 1130 down to 1056 before recovering back to the 1130 level into the close.

DRUDGE05_06_10A.jpg


Eventually, the market retraced back to its broken neckline of 1176.75 by making highs of 1174.75 before turning back lower to "back and fill" the flash crash lows of 1056.  Lows of 1002.75 were made in July of 2010 before reversing off the lows and into 1127.75, being were the market failed the prior month in June.  With the markets back to whipping back and forth in attempt to consolidate and build a bottom, a retest of the 1002.75 lows was made with the market falling down to 1037.00 on August 25th just before Ben Bernanke's Jackson hole meeting.  During this meeting "Bernanke Says Fed Will Do `All It Can' to Ensure U.S. Recovery".  With the Federal Reserve promising to defend the markets, this turned the retest of the summer lows into a bottom and the markets turned higher to see a breakout "gap and go" on September 13th with the market making lows of 1108 and holding above the prior day's high close of 1105 to leave a small gap open, giving way for a short squeeze to move back higher and take out the earlier April high of 1216.75 which eventually led to 1373.50 on May 2nd, 2011 before going through another consolidation period that presented another correction, filling the 1105 gap. Another volatile period and more promises of support from the Fed led to another gap and go breakout to start 2012 with a gap open higher with lows of 1259.75, keeping open a gap down to 1252.50 from December 30th and giving way for another short squeeze to move back higher and take out the May high of 1373.50. Throughout 2012, the market kept this gap at 1252.50 open to create another bottom during summer, targeting the year highs.  Small correction in fall of 2012 as the 1441 upside target was completed, making highs of 1468 before falling down to 1340.25 in November to retest where the market broke out in August.  Since these lows, another gap has been made, with 2013 opening above 1440 with lows of 1438.25 and a previous close of 1420.  This has led us to where we are now as the market has gone through another major short squeeze, bubbling throughout the year to take out the all time highs of 1586.75 and breaking above 1600 on the latest non farm payroll number reported on May 3rd.  


Continue reading
5434 Hits

Bonds, Stocks, and the YEN


ZB________Daily___3_13_2012___4_28_2013.jpg

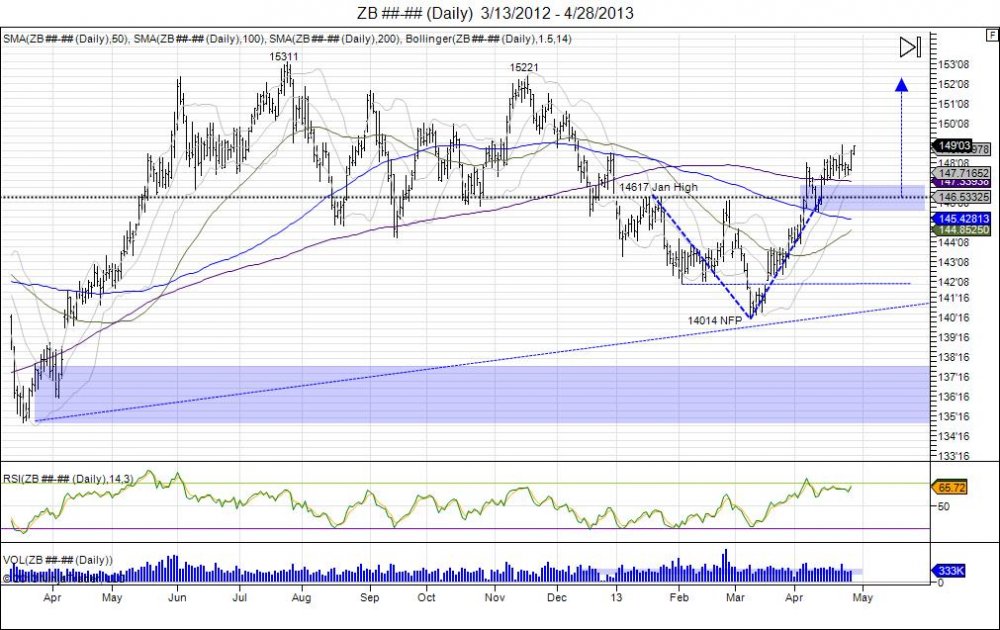
The 30 year bond has consolidated above 14617 in an effort to hold above the year highs after seeing a massive short squeeze that reversed the market from the year lows of 14014. Squeeze was fueled by shorts as the market broke below the February lows on the March NFP release to put in these lows, the market saw a recovery the following Friday going into the "Cyprus bailout".  Cyprus news led to gap above 14200 turning level into a failed breakdown as market continued to force shorts to cover until the year high was taken out. The move caught many off guard and in turn cleared out shorts in the market. By holding above 14617 the market now tries to build a base of support to attract buyers that neglected bonds for stocks earlier in the year.  The market sees major resistance against 14923. Taking the range of 14617-14014, gives way to push toward 15221 high from November.  Just as the Yen tries to target its November gap.   


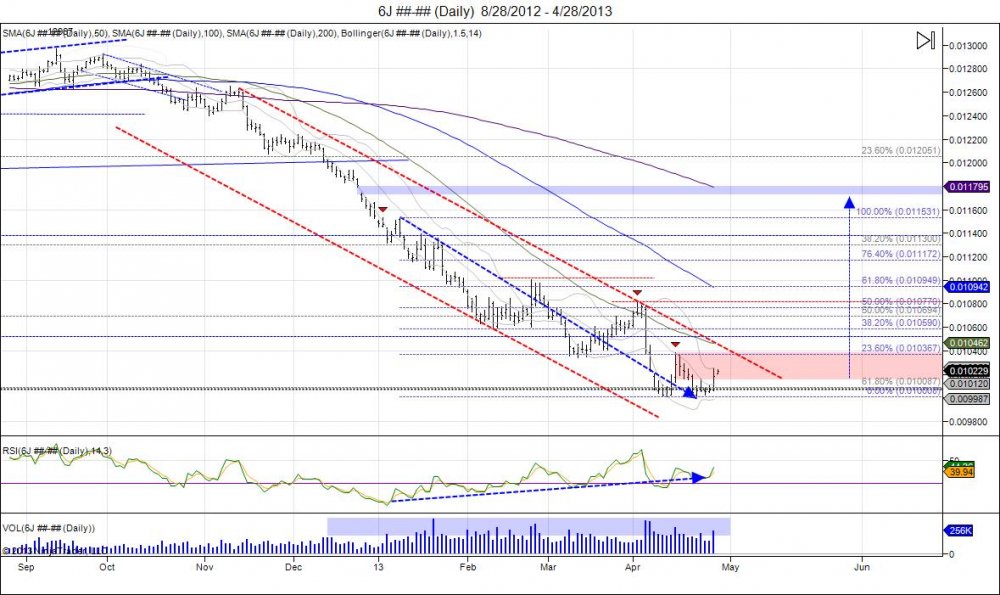
  6J________Daily___8_28_2012___4_28_2013.jpg


Yen and SP500 show almost exact contrast comparison.  As Yen tries to double bottom in April, SP500 is trying to double top.  The Yen made lows of 10008 and 10013 before squeezing through 10158 last week.  This level has turned into a new area of support should the double bottom be good. Holding above 10150 gives room to force shorts to cover to give room to take out April 15th's 10383 high with next major level of stops above 10809 from April 2nd highs. Above 10809 confirms double bottom against 100 to give way for a massive short squeeze to target the year highs at 11531 and give room to fill last November's gap at 11790. During the past 4 years the Yen has had a tendency to bottom during the Spring months. 


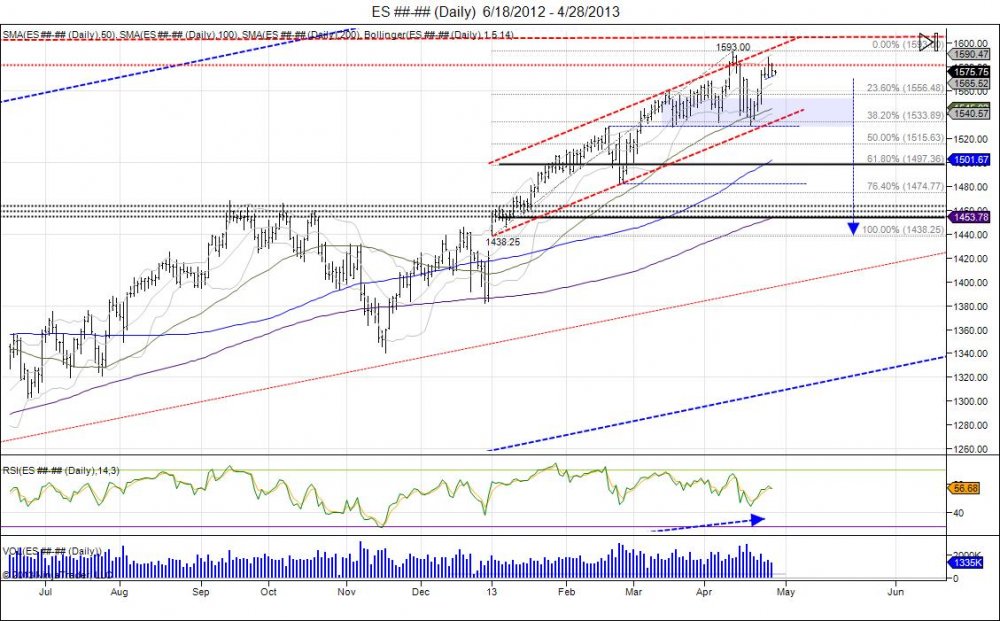
ES________Daily___6_18_2012___4_28_2013.jpg

In contrast the SP500 has a small double top as market most recent reversed from 153075 to retest 1593 by making a high of 158825.  As the market hits it's head against this resistance it has managed to hold above 1570 to create a very tight trading range. Move past 1588 is needed to retarget 1593 for stops.  Break of 1570 gives way to test support at 1555 based from the 153075 pivot low.  Taking out this low would confirm the double top to give way to cross the "line in the sand" from the Cyprus lows of 152950 which have held like a rock.  This is line in the sand, just as 108 is the line in the sand in the Yen and 14617 was in bonds.  In contrast to the Yen with the gap at 11790, the SP500 has a gap down to 142575. 

Continue reading
3729 Hits

Fear Turns to Greed at Breakeven.

2011 vs 2012 Patterns compared

ES________Weekly___Week_18_2008___Week_11_2013.jpg

Click charts to maximize.

The SP pattern from January of last year gapping open at 1259.75 above resistance just as the gap open at 1108 in September of 2010, is now mimicking the % move. The first breakout in September of 2010 at 1108 recall was just after the year of the Jackson hole QE start in August and the volatile period during that summer range to put in a bottom at 1002.75. The breakout in September squeezed a 24% rally leading the market into highs of 1373.50 to test the range from May of 2008 of where the fall out began. Last January this pattern was mimicked again with the market gapping higher at 1259.75 to start another breakout following another volatile period during the summer with lows of 1068. This gap at 1259.75 has held open and the wave has now squeezed the market up 23.1%, putting it right at the door steps of resistance from the range off all time highs of 1586.75. At this point the market is testing major resistance based off the all time highs and seeing a small pause. Whether the market can muster enough strength to squeeze through and stop out shorts to follow the Dow Jones average into new all time highs is yet to be known. The next major resistance would be the 1600 level as everyone sees, keyword everyone. The biggest risk is the SP500 not taking out the all time high, thus buyers remain complacent looking for new highs, buying pullbacks which gives way to setup bag holders.


Tags:
Continue reading
4148 Hits