Chicagostock Trading

Chicagostock Trading

SP500's ride from 1800 to 2040 with Chicagostock

HOW DID THIS:


GET TO THIS?:

Continue reading
4609 Hits

The Great Reset

05_22_jpg.jpg

In December’s article “The Yellen that Stole Christmas”, the point was to show how buyers in the SP500 were caught above 2040, and needed a Yellen rescue.  The market attempted to breakout to start December, however the rug was pulled from underneath as Yellen reiterated a rate hike later in the month.  After bluffing the market for 2 years on this rate cut, the call fell on many deaf ears.  So it was. Buyers were left caught at higher prices, betting on a “Santa Claus Rally” only to be hoping for Yellen to save Christmas.  For the first time in 6 years and exactly 3 years from December 2012’s FOMC that placed a 6.5% target on NFP for a decision on Fed Funds rate, the FOMC reset the market and hiked the Fed Funds rate by a quarter point.  Bulls did not get what they were looking for and saw the market fall back to retest 1982 support.  The level barely held on December 18th, as the market rallied back for Christmas holiday and the “Santa Claus Rally” was actually a gift from Yellen for stuck longs above 2040 to “breakeven”, or as we like to call it “get out of jail free card”.  

Continue reading
4883 Hits

The Yellen that Stole Christmas


When the FOMC decided to place a 6.5% target on NFP rates to justify raising the federal funds rate, the SP500 was trading 1427, gold 1718, US dollar 7985, and 30 year bonds at 148.  

“… the Committee decided to keep the target range for the federal funds rate at 0 to 1/4 percent and currently anticipates that this exceptionally low range for the federal funds rate will be appropriate at least as long as the unemployment rate remains above 6-1/2 percent…” (FOMC 12/12/12 source).

Just days after this release, we highlighted the weakness in gold: Whats With Gold? FOMC Spooks Market. Double Top Eyes 1250.

Continue reading
4495 Hits

Summer Capitulation or Summer Bummer

1-8-12b_1.jpg


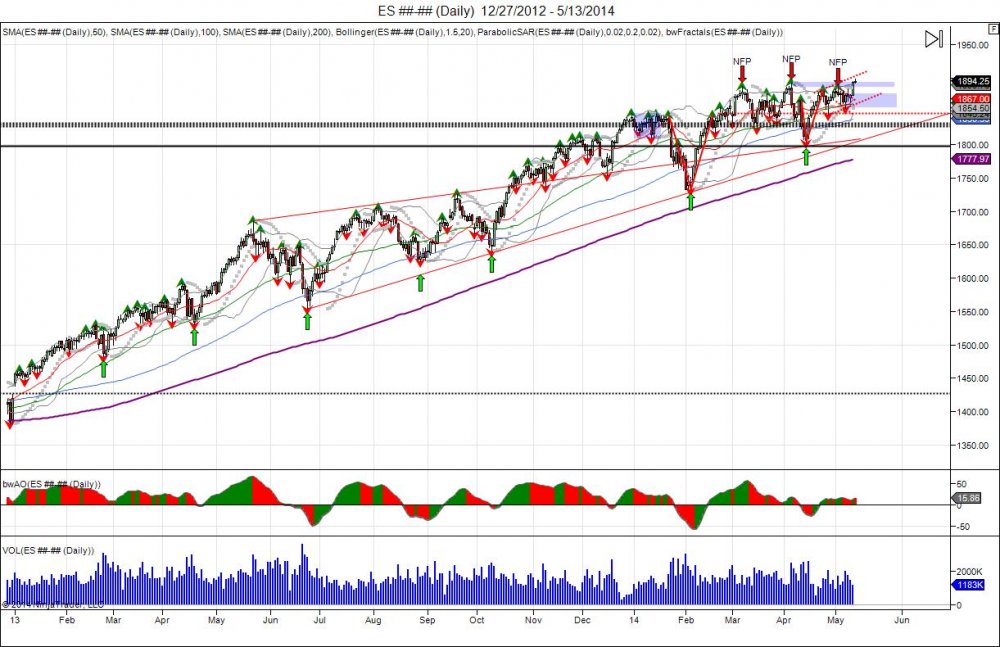
Notice long term 2013 trend from the breakout gap and go above 1440 to start the year see a setup of higher lows strongly defended.  Early 2014 low held right against this trendline to put in another higher low and see new highs made. Latest higher low comes in at the April lows of 1803.  Uptrend line caught up to the market forcing buyers to defend even as market has gone into sideways distribution. The sideways consolidation has been a fight to hold the uptrend. Latest bounce coming from the April low and break out above recent 3 month range is looking for capitulation of shorts and new longs to be forced above new highs. The April low is now a major pivot level as a breach below breaks reveres the uptrend of higher lows.

Continue reading
3295 Hits

Stocks Strike Out , Cash Takes Profits

1-8-12b_1.jpg


The SP500 for the 3rd time in the last 3 months sold off on NFP numbers.  The last two, were both peak highs. March 7th the SP hit highs of 188750 before turning down to 182350. The FRB chair gave the markets a push on the 31st of March reassuring stimulus measures. This gave way for new highs going into the April 4th report at 189250, only to see these highs once again rejected after the NFP numbers were released that morning.  This higher high and failure led the market to break March lows and fall down to 1803 in April to shake out the long side and lure in shorts. This has led into a short squeeze leading into today's job number as the market retested the failed April highs to give buy side another chance to push through.  Third time was not the charm, as the NFP failed to breach old highs of 189250 and the cash open saw profit taking to hold the NFP high of 1886, setting up a LOWER high, as opposed to the last 2 NFP peaks. 

This selling on the Jobs report over the last 3 month period comes as the market nears the old 6.5% unemployment target the FRB established in December of 2012.  The SP closed 2012 at 1420, 30 year bonds at 147, gold at 1675, and the Yen at 115.  With the unemployment rate now at 6.3% below the 6.5% target that was pulled, we are seeing the 30 year bonds, gold, and the Yen all reverse their trends and show a strong 2014 in contrast to last year.  This is putting major pressure against the market as the 3 of these instruments all started on the lows of the year and grinded up to show a reversal and underlying bid by short covering.  The consolidation in bonds, gold, and the yen over the last 2 months is the markets way of keeping shorts trapped as the year lows hold and market stabilizes to force them to cover into what is now being seen.  The SP500 in contrast, has not changed its 2013 trend as of yet. The year of 2014 started weak with a move down to 1732 only to shake out longs and attract shorts in what turned into a reversal.  This setup a V bottom as the 2013 highs were taken out, and clearing the cache of shorts. now it was time to find new buyers to stabilize prices, and this is where we have been the last 3 months, in search of these buyers, which has led the market to consolidate sideways. Throughout this period, all peak highs that attempted to break higher were used as opportunities to take profits into by the market.  This shows that the long side is already heavy handed thus finding trouble getting new longs into the boat, giving way for the boat to be tipped for the majority to feel the pain.


Continue reading
1198 Hits

DAY TRADING SP500'S DOUBLE TOP

Both peak highs in 2014 were made on NFP days and only 1 month apart. 

Below are videos on Chicagostock's day trading signals


Trading March 7th Non Farm Payroll Number:


Trading April 4th Non Farm Payroll Number:

Continue reading
4085 Hits

RUNNING OUT OF BUYERS?

1-8-12b_1.jpg

Since reversing off the year lows of 1732 and through December's high to squeeze shorts, the SP coiled in a sideways range in attempt to find new buyers following that V shaped short squeeze.  The first peak high was made at 188750 in March on Non Farm Payroll numbers.  This was followed by a reversal down to 182350 mid March, before climbing back up to 1877 as the pullback was bought and the 6 month pivots turned into support.  Breakout attempt was seen early April, having to take the FRB chair to say stimulus is still needed to in order to trigger new buying to run the market into new highs setting up a jump ball on the NFP numbers that were released early April. New all time high were made by 5 points up to 189250, again on Non Farm Payroll numbers and was followed by profit taking and sellers pressing the market post NFP release. Both peak highs being made going into the jobs numbers that were both followed by immediate profit taking. The last high is more troublesome as new highs were made only to fail to continue higher, seeing a reversal back down to press and retest the March lows of 182350.  First test of this led to a bounce this week on the FOMC release the 6.5% unemployment target for the fed funds rate would be removed.  The initial reaction was an embracement by the market, seeing a bounce up to 1867 before running out of gas and reversing back down to close below the recent low of 183075 prior to that FOMC release.  Once again the market brushing off stimulus promises and a pull of the 6.5% unemployment rate that suggests rates can remain low longer. 

Going forward, pressure is being put now against the prior low of 182350 made in March to shake out longs and confirm a short term double top.  A weekly close below 1850 is bearish and creates a new range of resistance within 1850-189250.  Looking at the action made in 2014, with the early sell followed by the V shaped recovery that was fueled by shorts being squeezed, the market traded above those prior highs for 2 months in attempt to build a base and attract new buyers following the short squeeze. Failure to build the base and hold above the 2013 highs, suggests enough new buyers are not coming in to sustain the V reversal to expand higher.  If new buyers are not coming in, then the bus may be too full and this gives room to expand lower to target the year lows and confirm a failed breakout with major support at 1700 based off the October low.  Failure to hold the 2014 low of 1732, breaks the series of higher lows the market has enjoyed since the last major low of 1553 in 2013 when investors feared tapering before being squeezed up 300 points.  By taking out the last major low at 1732, this breaks the upward momentum, and gives room to move down into testing levels from 2013 and attempting a gap fill down to 1420.  Support off the year lows is seen down to 1750 for buyers to defend.

VIDEO: Watch Chicagostock's day trading signals on both peak highs.

Continue reading
4679 Hits