Chicagostock Trading

Chicagostock Trading

Accurately Predicting Gold Trends Using Technical Analysis

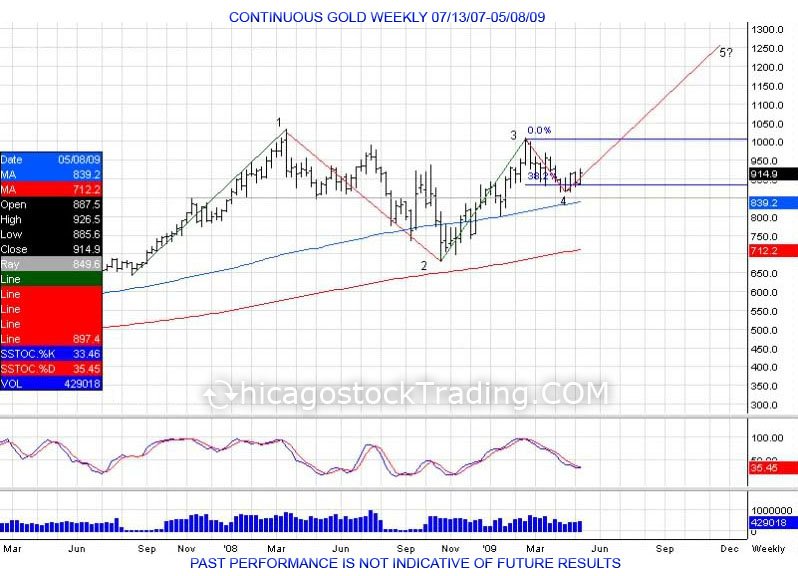
GC5_8_9.jpg

(click chart to enlarge)

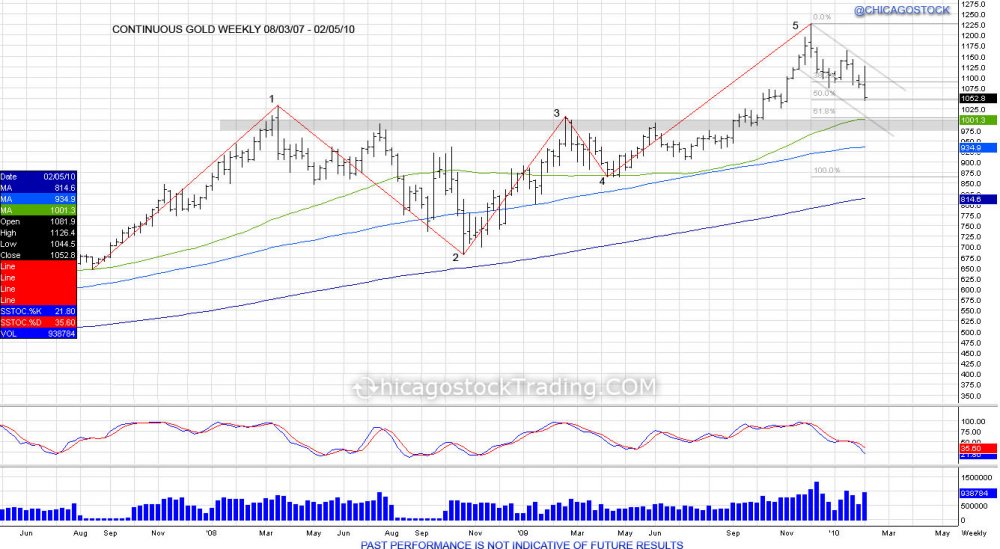
Gold in 2008 was the first time the market breached the $1000 mark, hitting highs of 1033.9 in March just as the Federal Reserve Bank of New York provided an emergency loan to Bear Stearns to keep the company solvent from it's bets in subprime mortgages.  This was followed by a correction and liquidation in the fall just as the equity markets began to crash in September.  The panic and liquidation selling led gold to fall into lows of 681 in October before retreating back to retest the $1000 mark in February of 2009.  This created an Elliot Wave pattern that saw the first wave 651-1033, second wave being the corrective wave from 1033-681, third wave being the move back up from 681-1007, fourth wave which was a very small 38.2% correction of the 3rd wave, setting up for the fifth wave to try and continue higher.


GCTRADE1-2.jpg

(click chart to enlarge)

The fifth wave completed with gold moving from 865-1227.5 just as the Federal Reserve bank lowered their federal funds target rate to 0% in January of 2009.  This gave gold the fuel to move back through $1000 and continue this 5th buying wave to take out the old $1033.9 highs.  Showing gold's strength and proving naysayers who did not see gold breaching over $1000 again wrong.  As the 5th wave completed with highs of 1227.5, this led to profit taking and a small correction as gold corrected 50% of the 865-1227.5 move as well as coming back to retest the old 1033.9 highs with the gold making a low of 1044.5 in February of 2010. 
 

Continue reading
5247 Hits

SP500 Johnny 5 Update

Who is Johnny 5?

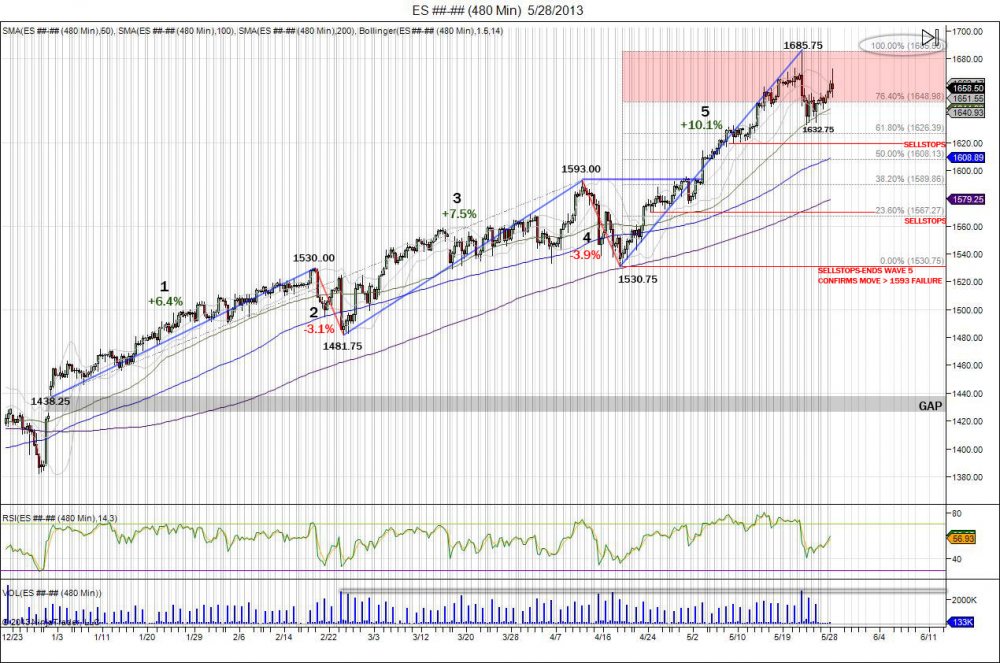
Latest wave in SP500 1530.75-1685.75:

(click chart to enlarge)ES________480_Min___5_28_2013.jpg

SP500 8 hour chart above showing year to date trade.

First 6 months of 2013 = 5 waves:

Wave 1: 1438.25-1530.00 +91.75 6.4%

Wave 2: 1530.00-1481.75 -48.25 3.1%

Wave 3: 1481.75-1593.00 +111.25 7.5%  AVG VOLUME 9,436,701 

Wave 4: 1593.00-1530.75 -62.25 3.9%

Wave 5: 1530.75- *1685.75* +155 10.1% AVG VOLUME 9,344,753


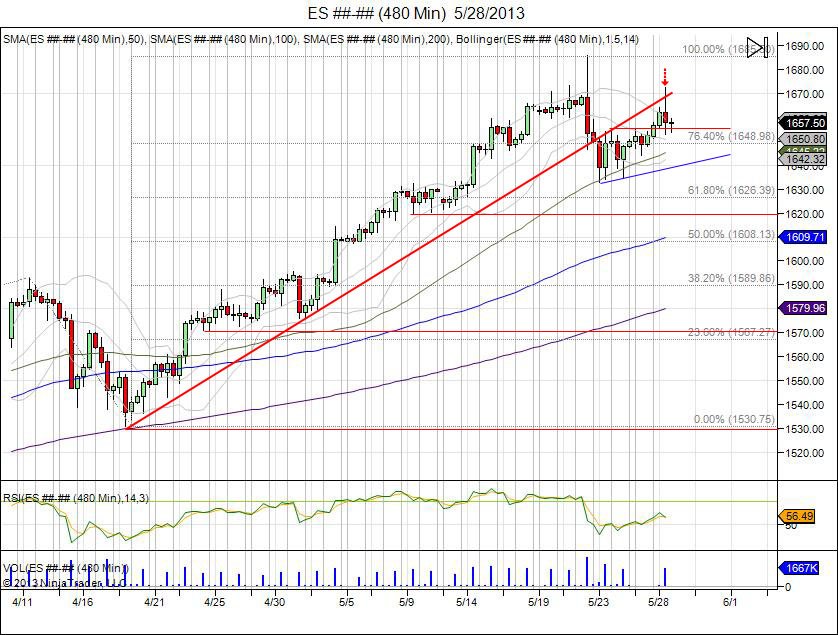
Since blowing through 1593, the chase trade by buyers and short squeeze pushed the market to complete its 62.25 range (1593-1530.75) up to 1656.  This did not stop with the SP500 pushing through this, 1666, and into the top level of 1685.50 to extend the range 100%.  As shorts capitulated through 1673 into 1685, bulls used the bid to take profits into.  This led to a 3% decline down to 1632.75, shaking out the first 1646 level of sell stops.  The move was fast after the bear capitulation as sellers had to now chase.  With market falling into 1630s, bears chasing lows have been grinded out as market has used these bears to run stops above 1655 and into testing the 1670 level being where the SP failed off the high. The move has given more patient bears there chance to get in, now its up to see if they are stronger then this bull.  The bull has support at 1654 and sell stops below 1644.  Sell side gains ground with break of 1644 to retarget the 1632.75 low to confirm move above 1655 was failure.  Buy side needs to hold 1655 to continue pressure to retest 1672.75 from today's failed high.

Below is an excerpt of the 5th wave description in "Wikipedia"

"Wave 5: Wave five is the final leg in the direction of the dominant trend. The news is almost universally positive and everyone is bullish. Unfortunately, this is when many average investors finally buy in, right before the top. Volume is often lower in wave five than in wave three, and many momentum indicators start to show divergences (prices reach a new high but the indicators do not reach a new peak). At the end of a major bull market, bears may very well be ridiculed" (Source: Wikipedia - Elliot Wave Principle)

Ofcourse, this looks exactly like text book, wave 5 everyone is bullish, average investors forced to chase above 1593, and volume thus far has been lower then the 3rd wave. The 5th wave momentum continues until the pivot low of 1530.75 is taken out to confirm move above 1593 was a failure.

Same chart above, zoomed into last wave 1530.75-1685.75 (click chart to enlarge):

ES________480_Min___5_28_2013a.jpg

Continue reading
5439 Hits

SP500 Maxes 100% Fib and Reverses

ES________480_Min___5_23_2013.jpg

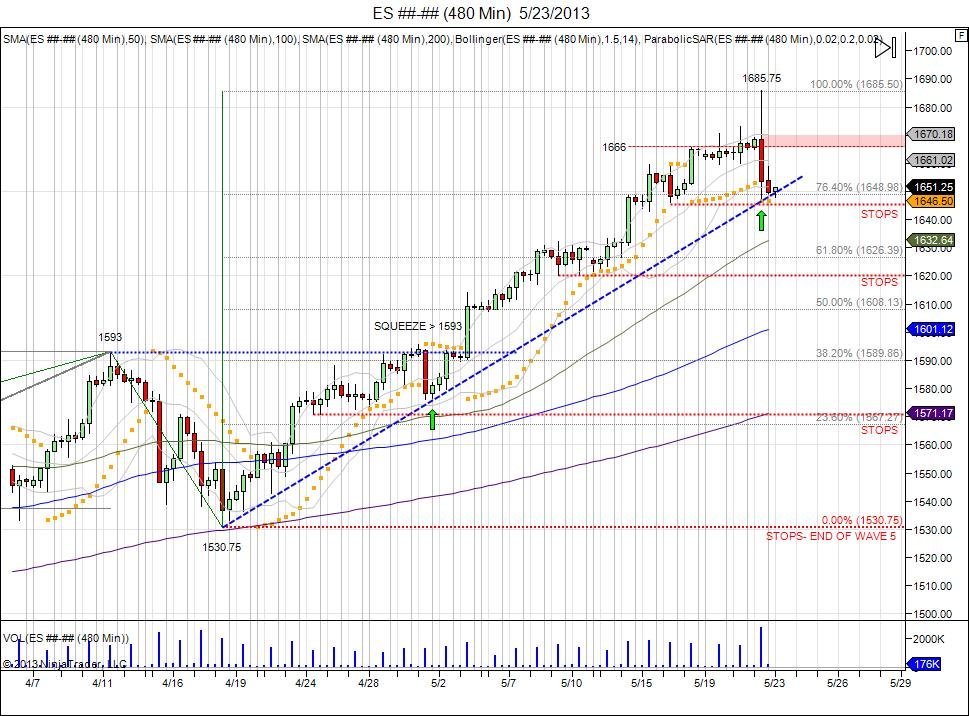
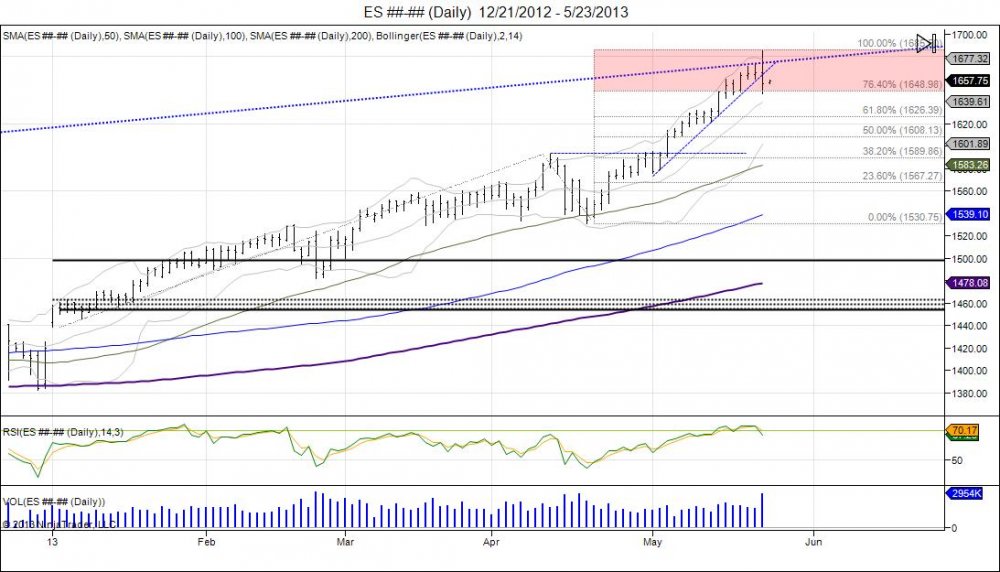
As soon as the SP500 hit its 100% Fib extension level of 1685.50, sell programs kicked in as the SP500 printed highs of 1685.75.  The move occurred after a squeeze through previous highs of 1673, seeing shorts capitulate which gave way to the 1685 print.  Smart longs sold into this bid to take profits. With longs taking profits, shorts already being stopped, the market fell down to retest its open. After trying to retest the highs and failing to find buyers at 1681, the market fell off to take out its session lows to reverse the intraday trend as more longs locked in profits and short sellers sat on the sidelines looking at the market drift lower.  With shorts out the market, this created a chase to the downside into 164650 to retest the pivot low of 1646 made last Thursday prior to Friday's move into 1665.75. A 40 point rejection off the top level of 1685 and a press to test the downside resistance range at 1656 to see if that old resistance acts as new support for a retest of the mid level at 1666-1670.  This has raised the stakes for bears as the range to defend has widened.  Failure to hold 1646 sees more shorts left on the sidelines and a wider range (40) to defend the high.  Market remains in its 5th wave that began on the breach of the old 1593 highs with a pivot low of 1530.75 occurring during the "4th" corrective wave.  As market moved past 1593, buy side chased and shorts squeezed from the 1593-1530 giving way into 1656.  Sell stops have built along this wave 1530-1685 below 1646, 1620, 1607, 1570.75, and ultimately the 1529.50 low from Cyprus.  Wave 5 ends on a breach of that pivot low that began the wave at 1530.75.  With that taking place, a confirmation will then be made that the move above 1593 was a failure and an "abc" corrective pattern can be seen should the market be able to bounce after breaking 1530 to retest the 1600 level and see if it can get back above. 

ES________Daily___12_21_2012___5_23_2013.jpg

See: "SP500 Wave 5 How High Will It Go"


Continue reading
3933 Hits

SP500 Wave 5 How High Will It Go

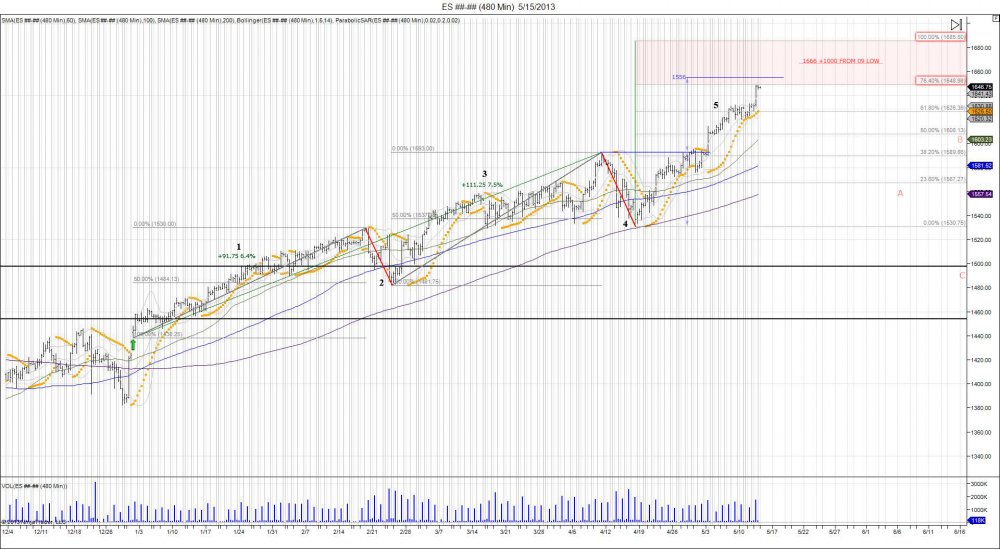
ES________480_Min___5_15_2013.jpg

Click to enlarge

The latest breakout above the previous high of 1593 is extending to be the 5th wave of the 2013 breakout above 1440.  As seen in the charts, the market has had 5 waves this year.  The first wave starting from the year lows of 1438.25 to the February high of 1530 rising 6.4%. The corrective wave off these highs retraced 52.6% to 1481.75 before stabilizing.  The breakout above the previous high of 1530 began the third wave up as the market rose 7.5% into 1593 in April before correcting.  The corrective wave off these highs retraced 56% to 1530.75 before once again stabilizing.  The latest squeeze through 1593 has become the new wave up, being the 5th wave of the bullish trend.  The 5th wave is usually the strongest out of the 1,3 ,5 buy waves as it attempts the final squeeze and extension of the trend, luring in the late buyers.  This happens as the market never pulled back to retest the April lows allowing for buyers to defend 1550s, and forcing a chase above 1600.  The chase thus far has been strong, with the market extending 76.4% above 1593 at 1648.75, and up 7.7% from the 1530.75 low, already a larger % move then the 1st and 3rd buy waves. Major resistance is being met at these levels. The range of 1593-1530.75 (62.25) completes at 1655.25 to be a +8.1% (1593+62.25). Next level comes in at 1666 to mark 1k points off the lows and 8.8% move from 1530.75, followed by 1685.50 as the 100% fib extension and 10.1% off the 1530.75 low.  As this latest wave pushes higher, bulls are most present and bears are ridiculed. Major upside targets are being thrown out, pumping the market.  As per the Elliot wave, once the 5th wave completes by seeing a correction off the highs, an a,b,c corrective pattern can be attempted. This can turn into a consolidation to build a base or a head/shoulder pattern as A is the wave off the high, B the wave to retest the high, and C the wave that fails the retest and falls to take out previous low from A which is needed to confirm change in trend.

Wave 1: 1438.25-1530.00 +91.75 6.4%

Wave 2: 1530.00-1481.75 -48.25 3.1%

Wave 3: 1481.75-1593.00 +111.25 7.5%

Wave 4: 1593.00-1530.75 -62.25 3.9%

Wave 5: 1530.75- *1685.75* +155 10.1%

Wave 5 ends when market turns back to take out the pivot low of 153075 that began the chase through 1593.

Sell stops are loaded up on the downside as the market built bases into the upside squeezes. These come in below 1620, 1607, 157075, 152950.

Continue reading
5846 Hits