Chicagostock Trading

Chicagostock Trading

Pre NFP Market Update, SP500, Bonds, Midcaps, Yen

Futures, foreign currency and options trading contains substantial risk and is not for every investor. An investor could potentially lose all or more than the initial investment. Risk capital is money that can be lost without jeopardizing ones financial security or lifestyle. Only risk capital should be used for trading and only those with sufficient risk capital should consider trading. Past performance is not necessarily indicative of future results. Video content hosted by third party.


Continue reading
4040 Hits

Stocks and Volatility Shorts on Tight Rope

05_22_jpg.jpg 

SP500 futures have been in limbo after completing the 1955 target based off the January-February range expansion (1844-1732 = 112, 1844+112=1956).  This level has also coinciding with a major fib extension at 76.4% based off the May 2013 low (1553) to the December 2013 high (1846) and the February 2014 low (1732).

We know this year started off sideways from last years close, which was followed by a massive liquidation from 1844 down to 1732.  This selloff was reversed, with the market recovering above 1844 to squeeze out shorts.  The reversal above 1844 created the plateau to allow new buyers to come in and support prices to attempt and expand the 112 point move down up into 1956.  After 3 months of sideways consolidation and bear traps, the market printed new highs in May at 189850 followed by a low of 1859 that barely held its May low of 185450.  By holding this low, the market managed to reverse and squeeze through 1898, giving way to breaking outside of the 3 month range and expanding up to complete the target as shorts once again were squeezed.  The ECB came out on the 5th of June to cut rates to negative, giving the boost in the SP to hit 1940.  The following day was the Jobs report on the 6th of June which continued the move into highs of 184975. Spilling over into Monday, highs of 195475 were made completing the range expansion and meeting the 76.4% fib, give or take a point.  The futures rollover from June into September saw prices rollover with, falling down into 1917 to test the June lows and hold, before reversing back up as the September contract became the front month and went toward to meet with its 76.4% fib as well. 

Highs of 195975 were made during last Sunday's Globex session that further squeezed shorts after September took out the continuous highs. Since this Globex high, the cash market opened lower only to rally back and retest this high, making a new one by a tick at 1960 before going offered down to 1936.  Over the past 2 trading days the SP has fought to hold above 1940 as it attempts to defend the reversal off the 1917 lows and develop a base to squeeze shorts through 1960.  Buyers at the 1940 level need a move through 1960 to be rewarded based on their risk of defending the 1917 low.  Doing so, gives way to the next major fib level of 100% at 2025.  Failure to hold 1940, gives way down to target the 1917 low made last week.  Failure to hold 1917 confirms the new highs as a failed breakout with buyers that will be forced to liquidate which gives way down to retracing into the May breakout at 1890 to allow buyers to defend.  This would be alot healthier to the market as it would allow buyers a opportunity to buy a dip and use a break of the May lows as their exit, as opposed to forcing buyers to chase above 1960 in which will continue the capitulation of shorts and parabolic squeeze. It is the struggle to accept 1950.


unemp1_7.jpg


It is important to pay attention to VIX futures here.  After taking out multi year lows and falling below its trend line from the 2013 lows, VIX fell into 1073 early June, before bouncing up to 1289 in an attempt to come back.  This early attempt was rejected and VIX was sold down to make new lows (as the SP made new highs), falling down to 1034 before seeing a push back to highs of 1233 on the 25th of June.  It is interesting to note the take of the Volatility Sonar report from Optionmonster TV that highlights July call sellers in the VIX futures and an absent of what they call the "call stupid buyer" that has been buying premium in VIX not show up on that particular weakness from the 25th.  Jamie Tyrell explains how VIX can turn higher toward the end of the video.  Thursday saw VIX press against highs of 1251, nearing that 1289 June high, before backing away. Shorts in Vol should be concerned as a squeeze through the June highs forces shorts to cover as the June lows setup a failed breakdown, giving way for a move to retest the April range of 16-18.  

This was our projection of VIX just a little over a month ago: http://stks.co/p0M9e


Continue reading
3988 Hits

Copper VS SP500 UPDATE / Equity Tops

1-8-12b_1.jpg


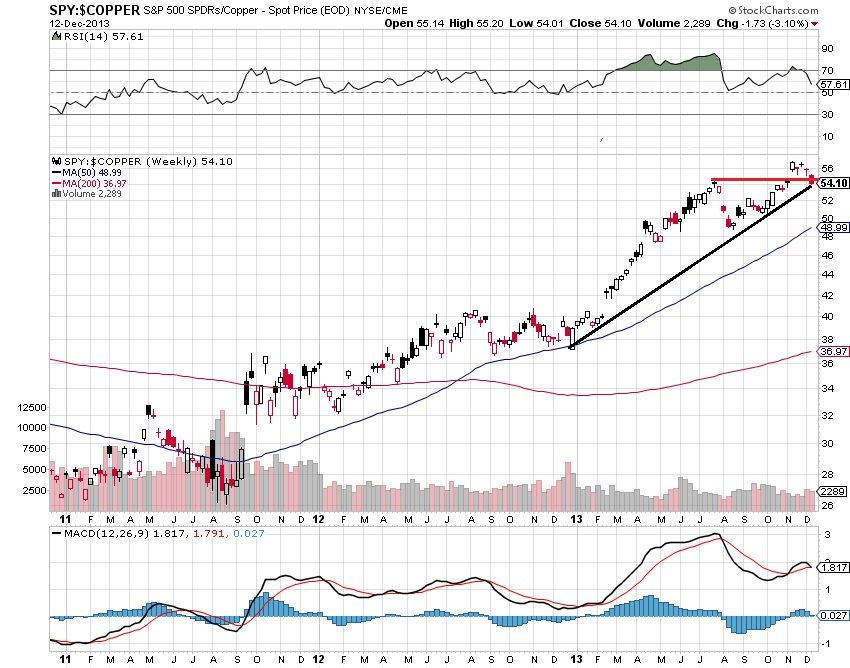
The spread between copper and the SP500 is now down to 5410 after hitting highs of 5679 in November.  This high marked a 25+% move higher in the SP500 and a 13-% move down in copper for the year of 2013.  Copper, known to be bell weather of economy as it shows industrial demand, tends to be a leader for the equity markets.  The fact that it was down this year as the SP500 diverged higher shows the move in equities was fueled only by QE as opposed to underlying macro.  Going forward, a breach of the August low in this spread confirms a failed break out with reversal attempt to cover/buy copper and sell the SP500.


 1-8-12b_1.jpg

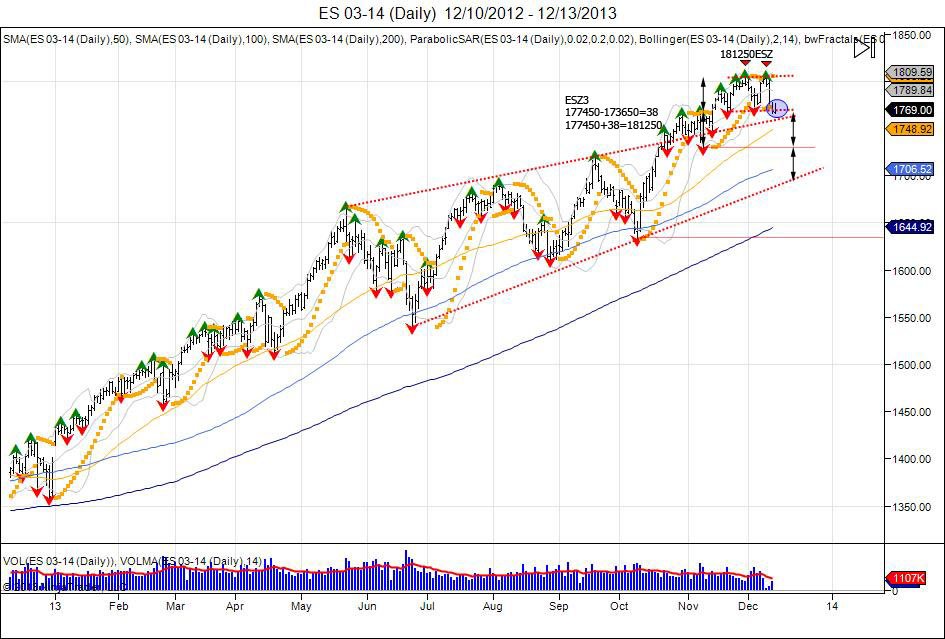
After breaking through the daily pennant created after the May correction that was followed by higher lows and higher highs, the SP500 traded in a tight range of 173650-177450.  This range of (38) was expanded higher as market broke above and turned 177450 into support, completing its target of 181250 to the tee with highs of 181250.  This was followed by a pullback to retest the 177450 level that held at 177775, followed by another retest of highs.  The retest was seen on the December release of the November NFP # that fueled the market to retest highs.  This retest fell short at 181150, seeing a rejection to take out the 177775 low, confirming a short term double top.  Market is now ont he edge fighting to hold above 1760 as this 1774 level becomes new resistance with the double top trapping longs and putting pressure lower.  Continued weakness below 1774 gives way to target the bottom of  old range at 173650 for stops.  Failure to hold 17360 can see the 1774--1736 range expanded down to 1698, into the bottom of the daily pennant and a test of the 100 day moving average which has not ben touched since October.


Continue reading
914 Hits

Does Bernanke Leaving End the Bull Parade?

1-8-12b_1.jpg


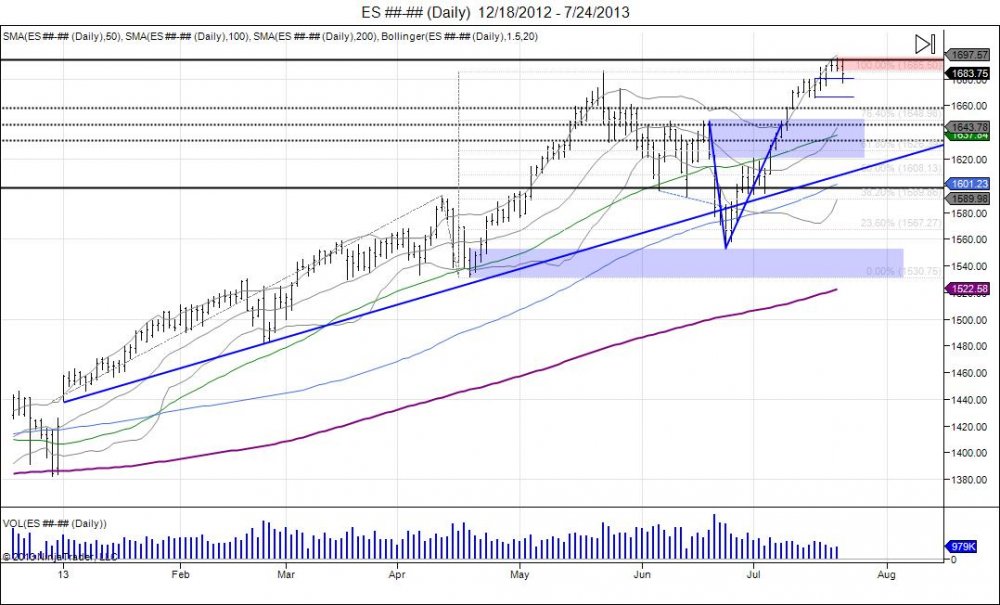
In the aftermath of what was Bernanke's last testimony to congress, equity markets squeezed new highs for the year just as the testimony wrapped up. Most congressmen were applauding the chairman for his service, somewhat having the feeling of a farewell party. The question is, if the chairman is leaving, does this mean the QE party is over and who will be last to turn off the lights? The uncertainty of the next chairman and actions is unknown. It's been quite a ride for the year, opening above 1440, last year's resistance, and seeing a gap and go breakout. Moving through all resistance and squeeze shorts in the process. This took 5 waves in the first half of the year, with 2 being minor corrective waves as tops failed.. Shorts squeezed and investors piling in, forced into equities on a QE high. This saw record highs of 168575 last May before longs began to sell into the squeezed bid to take profits. Bernanke scared investors out on June 19th with worries of tapering QE, seeing the market reverse lower from 1649.  This started a shakedown and panic into testing major support based off 1530 which originally began the leg up through 1600. The bull strongly defended this test holding in the low 1550s to prevent the reversal in trend. The market was walked back up to the 1649 level just in time to give Bernanke a second chance on another FOMC release of July 10th, and creating a "V" bottom. Bernanke was able to calm the market enough to break through 1649, triggering a short squeeze to give way to take out the all time high from May.  The latest and "last" testimony to Congress from the Fed chairmen had the market sitting on all time highs.

The SP500 followed the Transports lower Wednesday after failing to take out 3 day highs and setting up a small flat top.  The bounce to test the highs was seen as Apple earnings led the stock to jump $20 higher, luring in buyers to the SP500 for a run through 1700, only to reverse lower and close below 3 day lows. The reversal has the market pressing against major support, within 1681-1665, based off last week's pivot higher.  Failure to hold this range sees weakness in buyers and a reversal on the daily chart.  This creates the potential for a double top with the market failing to attract new buyers after taking out the May highs.  New money at these levels have new risk of uncertainty of the next Fed chairman. Next support seen at 1650, followed by 1615 with sell stops below 1550. Breach of 1550 targets 1530 Cyprus lows and the pivot that led into these all time highs. Minor upside resistance 1688-1696, break through needed for buy side to continue momentum.


Continue reading
2998 Hits

Accurately Predicting Gold Trends Using Technical Analysis

GC5_8_9.jpg

(click chart to enlarge)

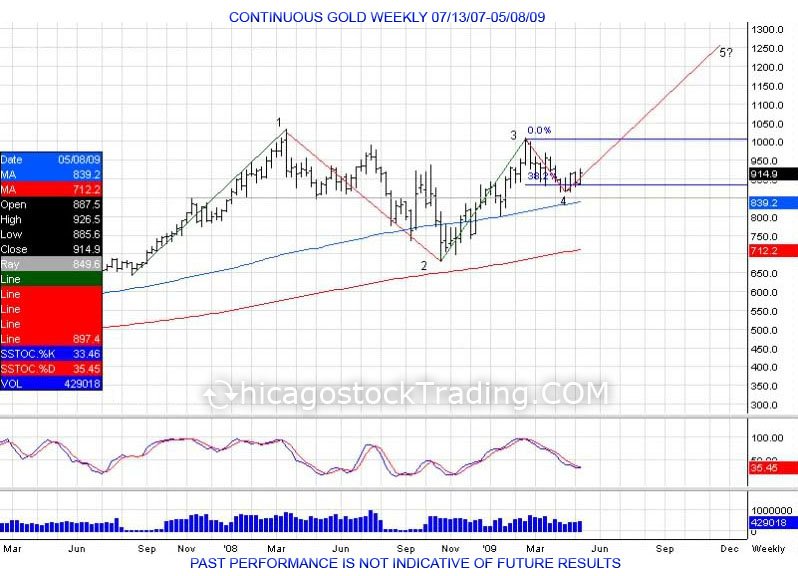
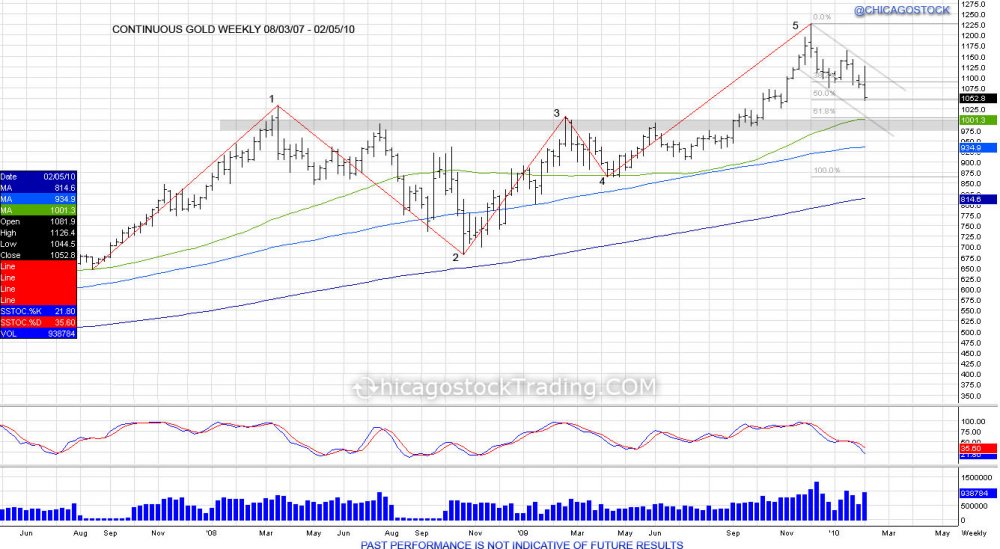
Gold in 2008 was the first time the market breached the $1000 mark, hitting highs of 1033.9 in March just as the Federal Reserve Bank of New York provided an emergency loan to Bear Stearns to keep the company solvent from it's bets in subprime mortgages.  This was followed by a correction and liquidation in the fall just as the equity markets began to crash in September.  The panic and liquidation selling led gold to fall into lows of 681 in October before retreating back to retest the $1000 mark in February of 2009.  This created an Elliot Wave pattern that saw the first wave 651-1033, second wave being the corrective wave from 1033-681, third wave being the move back up from 681-1007, fourth wave which was a very small 38.2% correction of the 3rd wave, setting up for the fifth wave to try and continue higher.


GCTRADE1-2.jpg

(click chart to enlarge)

The fifth wave completed with gold moving from 865-1227.5 just as the Federal Reserve bank lowered their federal funds target rate to 0% in January of 2009.  This gave gold the fuel to move back through $1000 and continue this 5th buying wave to take out the old $1033.9 highs.  Showing gold's strength and proving naysayers who did not see gold breaching over $1000 again wrong.  As the 5th wave completed with highs of 1227.5, this led to profit taking and a small correction as gold corrected 50% of the 865-1227.5 move as well as coming back to retest the old 1033.9 highs with the gold making a low of 1044.5 in February of 2010. 


Continue reading
5371 Hits

Gold Monthly Outlook

GC________Monthly___8_2006___5_2013.jpg


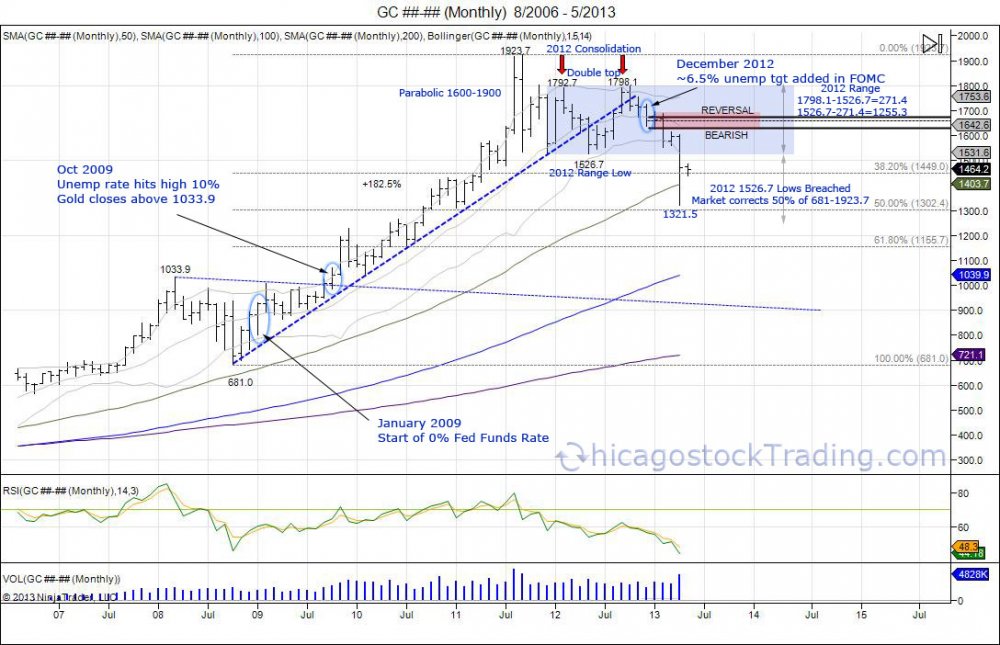
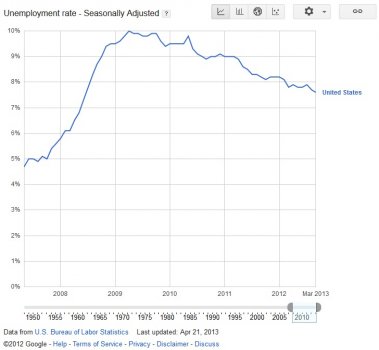
When the FOMC came out with a 6.5% unemployment target, this put gold on the edge fearing higher rates.  This was enough to hold the 2012 double top after consolidating the 1600-1900 parabolic move with lows of 1526.7 and break below 1700 into 2013 to make this a new level of resistance.  January this year gold tried to rally only to fail at 1697.8 and break below the year lows of 1626 giving way toward the 2012 low of 1526.7. With the market falling below the 2012 low, this squeezed the 1526.7-1798.1 range, retracing the market near 50% of its 681-1923.7 move. Since hitting 1321.5 gold has reversed back above 1400 and quietly trying to fill back the breakdown.  The old lows of 1526.7 as the bottom of the 2012 range will provide a major area of resistance.  For the gold bull to take control after this 50% correction, a 7 day hold above 1700 reverses downside momentum and targets all time highs for resumption of the bull trend. Below 1526.7 will continue to give pressure lower as late buyers in gold during the parabolic move of 1600-1900 are caught holding higher prices.


unemp5_3.jpg


Continue reading
3053 Hits

Bonds, Stocks, and the YEN


ZB________Daily___3_13_2012___4_28_2013.jpg

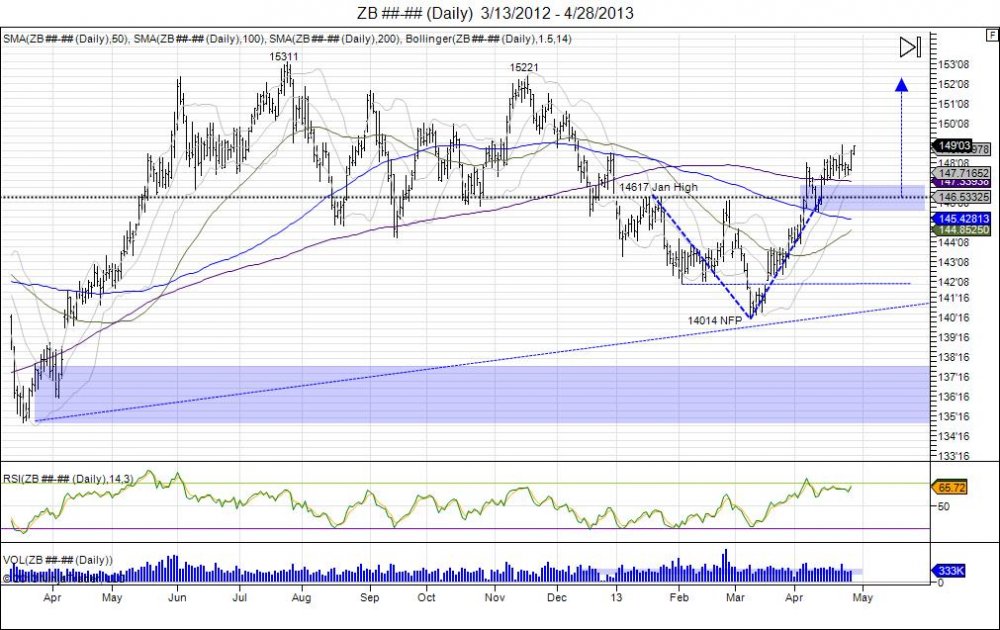
The 30 year bond has consolidated above 14617 in an effort to hold above the year highs after seeing a massive short squeeze that reversed the market from the year lows of 14014. Squeeze was fueled by shorts as the market broke below the February lows on the March NFP release to put in these lows, the market saw a recovery the following Friday going into the "Cyprus bailout".  Cyprus news led to gap above 14200 turning level into a failed breakdown as market continued to force shorts to cover until the year high was taken out. The move caught many off guard and in turn cleared out shorts in the market. By holding above 14617 the market now tries to build a base of support to attract buyers that neglected bonds for stocks earlier in the year.  The market sees major resistance against 14923. Taking the range of 14617-14014, gives way to push toward 15221 high from November.  Just as the Yen tries to target its November gap.   


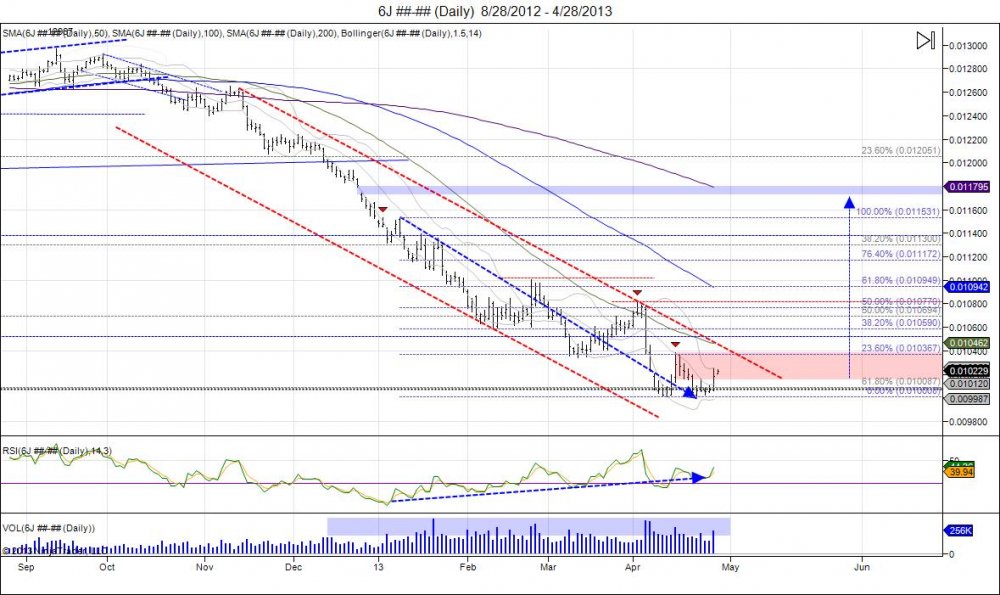
  6J________Daily___8_28_2012___4_28_2013.jpg


Yen and SP500 show almost exact contrast comparison.  As Yen tries to double bottom in April, SP500 is trying to double top.  The Yen made lows of 10008 and 10013 before squeezing through 10158 last week.  This level has turned into a new area of support should the double bottom be good. Holding above 10150 gives room to force shorts to cover to give room to take out April 15th's 10383 high with next major level of stops above 10809 from April 2nd highs. Above 10809 confirms double bottom against 100 to give way for a massive short squeeze to target the year highs at 11531 and give room to fill last November's gap at 11790. During the past 4 years the Yen has had a tendency to bottom during the Spring months. 


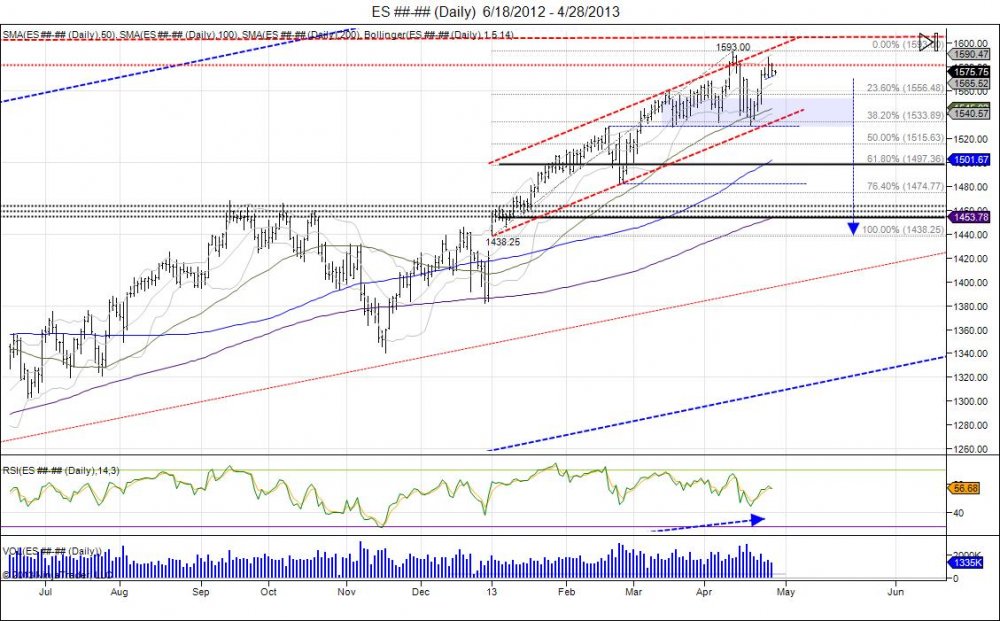
ES________Daily___6_18_2012___4_28_2013.jpg

In contrast the SP500 has a small double top as market most recent reversed from 153075 to retest 1593 by making a high of 158825.  As the market hits it's head against this resistance it has managed to hold above 1570 to create a very tight trading range. Move past 1588 is needed to retarget 1593 for stops.  Break of 1570 gives way to test support at 1555 based from the 153075 pivot low.  Taking out this low would confirm the double top to give way to cross the "line in the sand" from the Cyprus lows of 152950 which have held like a rock.  This is line in the sand, just as 108 is the line in the sand in the Yen and 14617 was in bonds.  In contrast to the Yen with the gap at 11790, the SP500 has a gap down to 142575. 

Continue reading
3784 Hits

SP500 Double Top Caution

 ES________120_Min___3_25_2013.jpg


Last Sunday's breakdown to 1529.50 on the Cyprus news saw the market bounce off the old February highs of 1530 with lows of 1529.50.  This led to a roller coaster ride for the week as the market climbed back to 1552.50, fell down to 1531.75, squeezed back to 1555.75, fell back to 1535.00, and most recently completed the pattern of higher lows and higher highs by getting up to 1560.50.  This was a calculated attempt to defend those lows and make higher highs to squeeze out small sellers.  The latest high was done this Sunday night (one week after the gap down from 1544-1529.50), stopping out small shorts as the previous year high of 1558.75 was taken out.  The market has thus far rejected this new high and fallen down to where the it opened on Friday.  There is major risk now that this higher high turns into a failed breakout and a double top should buyers failed to defend the most recent pivot low of 1535.00.  Minor support off these lows are seen at 1539, however buyers should find it much harder to hold this trend and the lows of 1535 after new highs were set at 1560.50 which give much more pressure to take out these rising lows and squeeze out buyers.  This would confirm the new highs as a failure a double top with a breach of 1529.50. As discussed in the previous video, the market has been working on creating a head above 1530 for a head/shoulder topping pattern which confirms on a move below 1481.75.  


Continue reading
2531 Hits

Gold $98 Locked & Free Ride for Another $366

 GC________Weekly___Week_32_2008___Week_9_2013.jpg

Gold's double top from 2012's year of consolidation following the 182% gain from 681-1923.7 has seen the market channel lower since that high of 1798.1.  This year began with a early breakdown followed by a bounce up to 1697.8 where the market failed to push through, leading the market to breach the year lows of 1626 in contrast to the US dollar reversed to take out its year highs.  Going forward, the market is now testing its last level of support based off its 1526.7 lows made in 2012.  This week has been a major failure as the market rallied to take out last week's highs of 1618.8, only to fail and turn back lower to where the week opened at 1579.7.  The downside chase continues and the 2012 lows are being targeted by bears.  A breach of thsi 1526.7 low confirms the 2012 double top and gives room to expand that $271.4 range which gives a downside target of 1255.3.  This would retrace the makret 50% of its 681-1923.7 move and offer long term investors a big area to buy.  Move back above 1676 reverses the bearish bias to give room to retest year highs.

Continue reading
3761 Hits

Gold Breaks Year Lows, Whats Next?

 GC________Daily___7_12_2012___2_15_2013.jpg

Gold broke its year low of 1626 today after it bounced off the level early January only to take out the early year high of 1695.4 by a few points at 1697.8.  The market failed holding above the year highs in mid January and fell lower to retest the lows later in the month and beginning of February.  After 2 weeks of consolidation above 1650 exhuasting daytraders selling, the market finally broke below 1651 on the 11th of February.  This killed the attempt to build an inverted head/shoulder bottom and regained the bearish momentum as the market held below 1650 to keep buyers above trapped. Trapping these buyers led to the move today in breaking the year lows to run stops and fall down to 1596.7, 101.1 off the year highs.  This has the market now testing major support off last year's lows of 1526.7.  As seen on the daily chart, the market has created a upside down U turn. Meaning gold started at 1626, moved to 1697 and now back below 1626.  Going forward, a 5 day hold below 1630 establishes a bearish bias for the first half of the year and gives room to continue the move lower.

Continue reading
4264 Hits

UPDATE SP500, Crude Oil, Gold

SP500 120 MINUTE:ES________120_Min___2_13_2013.jpg


OIL 120 MINUTE: 

CL________120_Min___2_13_2013.jpg

Continue reading
881 Hits

Whats With Gold? FOMC Spooks Market. Double Top Eyes 1250.

 GC12_20_12.jpg


When gold made highs of 1033.9 on March 17, 2008, it was a day later when the Federal Reserve came out with a FOMC statement, lowering the target for the federal funds rate aggressively by 75 basis points down to 2.25.  It was during this year this federal funds rate had begun to see drastic cuts from the Fed, until it finally got to 0-.25% early 2009.  Throughout all of 2008 the funds rate dropped from 4.25-1.00%.  Throughout this time, gold also saw a correction as the economy crashed in fall of 2008 seeing gold prices down to 681 in October.   Having already seen a 99% increase in prices from 519.5 to start 2006 into 1033.9 in March of 2008 this gave some reasoning for people to sell and take profits.  The shakeout brought prices down to 681 in the fall before bouncing off these lows.  This led to another push back at the 1000 level where the market coiled like a spring looking for direction.  During this time, 90% of the investment and trading community did not expect to see gold to run through 1033.9 anytime soon.  Sure enough,  with the third attempt in 2009, the breakout was seen: http://twitpic.com/co4yy.  This breakout created a parabolic run seeing another 86% added on top of 1033.9 to run into highs of 1923.7 in September of 2011, just 3 years after making the 681 lows.  All throughout this time, the fed funds rate remained 0-.25%.  The investment community jumped on the bandwagon and commercials for gold investments skyrocketed.  Since making this parabolic high of 1923.7, a correction began as the market looked to consolidate the move (http://twitpic.com/7bylsj).


2011 closed out with prices trading at 1566.8.  For the year of 2012, it has been all about consolidation.  The market once again ran into the 1800 resistance level early in the year with highs of 1792.7 before seeing another correction down to 1526.7 in May.  Not ready to move lower, the market held the December lows of 1523.9 and squeezed shorts and sellers as the market returned back to the highs of the year, once again pressing that the 1800 level.  The market put in highs of 1798.1 in October.  Once again, failing to push through 1800 for the THIRD attempt.  This created a double top for the year of 2012 with highs of 1792.7 and 1798.1.  Thus far the market has fallen back to the mean of the year inside the 1660 level.  This pullback has the market retesting where it broke out in  August of 2012 where the market pushed above the 1640 resistance level that troubled it during the summer.  This is now MAJOR support for the market and for gold bugs to defend.  The pullback offers the gold bugs this retracement to defend this pullback where the market originally broke out, turning old resistance of 1640 into new support.  Unfortunately, gold bugs defending this pullback must look to risk a break below the 2012 low of 1526.7.  Since gold is in a trading range of 271.4, this trading range gives the target on any expansion outside the range. Meaning a breach of 1526.7 gives room down to 1255 which would retrace the market down to the June 2010 high and just a little over a 50% retracement of the 681-1923.7 move.  Conversely, should buyers be able to hold the 1526.7 lows (which I don’t expect), a move through 1800 can see an upside target of 2069.5 by simply taking the range of 271.4 and adding it to 1798.1.  This is the task for next year, 2013 to find direction in the gold market. Throughout 2012 the market consolidated and traded within this range of 271.4 and put in a failed higher high at 1798.1 which gives the potential of a double top.  Of course just as 90% of the community was bearish gold sub 1000, 90% of the community is now bullish gold.  Regardless, we have a range bound market seeing pressure to break lower and shake down to 50%. This comes on the heels of the latest FOMC statement where for the first time since dropping the Fed funds rate to 0-.25%, the Fed finally attached a target to how long they will keep interest rates this low.  In the latest FOMC statement on December 12, 2012, “… the Committee decided to keep the target range for the federal funds rate at 0 to 1/4 percent and currently anticipates that this exceptionally low range for the federal funds rate will be appropriate at least as long as the unemployment rate remains above 6-1/2 percent…”. After 3 years of having low rates with no target, a target now given, the gold market is being cautious and since this FOMC statement, already down $82 to 1636.


Continue reading
16114 Hits

SP500's Double Top, Nasdaq's Head/Shoulder

 ES________Daily___12_22_2011___10_12_2012.jpg


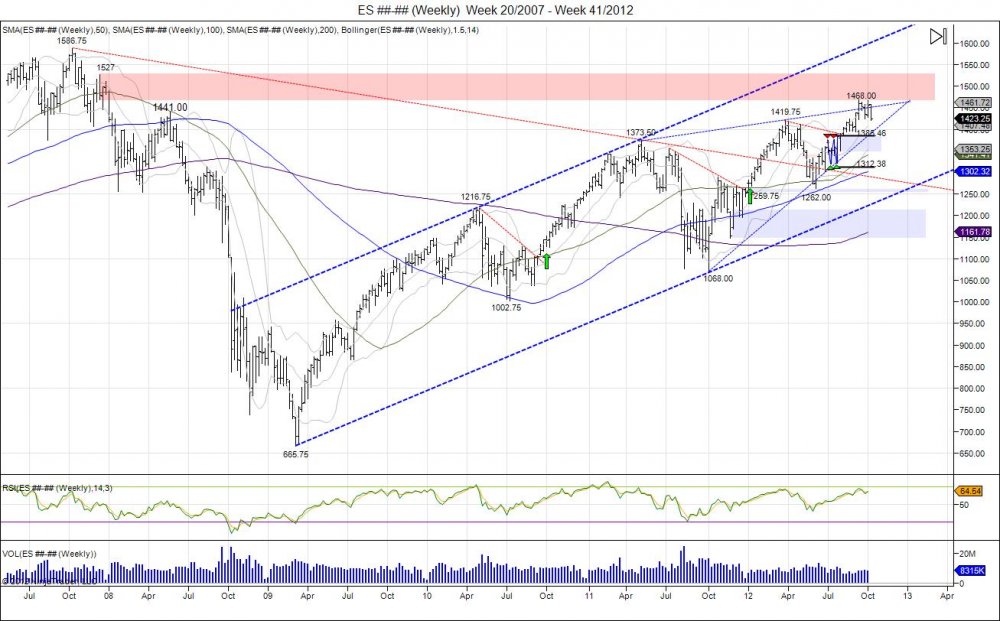
With the SP500 completing its 1441 target coined earlier this early, along with the double bottom made in summer that also targeted this, highs of 1468 were made in September as the short squeeze above the level took the market into this next level of resistance.  The market saw a small pullback off the highs and found support off a small trendline based off the August 2nd pivot lows and through the September 4th lows.  Not quite ready to break down, the market grinded higher to retest the highs made in September.  With the non farm payroll numbers released on October 5th, the market squeezed through 1460, stopping out weak shorts, yet falling short of the 1468 high by 2 handles at 1466 and quickly seeing a rejection during the day.  This rejection continued this week as the market saw this as a failure and a potential to double top.  With the breakdown seen this week that led the market to take out the trendline from the August2-Sep4 lows, this confirmed the double top and now targeted the 1424 pivot lows made on September 26th prior to double topping.  As the market is now working itself through this area of support, next major support comes in at 1410 based off the 1394.50 pivot low made on September 4th, and ultimately sees next major support at 1385 being where the market broke out early August to establish the bullish bias for the second half of the year. This fills the market back to where it broke out during the summer as many coined as a "light volume" rally, and most missed the move higher.  This gives the ultimate level for the market to base out for the year and see if buyers step up at these levels to support the market after squeezing out all these late buyers who have come into the market chasing above 1420.  The 50day moving avearge is being tested here. For this week the bear mission is to close the market below last week's open of 1432.75 to establish a bearish engulfment on the weekly chart to project more weakness going into next week.  Doing so sees first level of resistance at 1427.75, followed by 1451.25 being the lows off the failed 1466 high and the range buyers must work through to regain momentum. 


ES________Weekly___Week_20_2007___Week_41_2012.jpg


Continue reading
5769 Hits