Chicagostock Trading

Chicagostock Trading

SP500 Market Update - Video


Futures, foreign currency and options trading contains substantial risk and is not for every investor. An investor could potentially lose all or more than the initial investment. Risk capital is money that can be lost without jeopardizing ones financial security or lifestyle. Only risk capital should be used for trading and only those with sufficient risk capital should consider trading. Past performance is not necessarily indicative of future results. Video content hosted by third party.

Continue reading
2891 Hits

Bond Market's Technical Signals Before Cyprus

 ZB 06-13 (60 Min)  3_15_2013_1.jpg

The bond market showed signs of reliance late last week as the SP500 printed new highs early Friday, yet bonds stabilized to create a base from those lows printed on Thursday at 14024.  Friday's action saw lows of 14105, testing and holding the range from Thursday's lows, and in turn building a right shoulder for an inverted head/shoulder pattern as aggressive buyers were using this as an entry with stops below Thursday's lows.  The move on Friday squeezing through the neckline of 14121 confirmed the inverted head/shoulder and rewarded buyers down to 14105. This range of 14121-14024 gave an upside target of 14223 to complete the expansion of the inverted head/shoulder. As the market held above this neckline on Friday, it consolidated after taking out the 14129 high made on NFP day and in turn this consolidation created a bull flag as seen in the hourly chart, also projecting 14223.  

All of this technical analysis confirmed Sunday night as the bond market opened higher at 14210 and squeezed to complete the target of 14223. The catalyst for this, 'news' out of Cyprus putting a tax on bank deposits.  Price action always precedes news as one cannot predict when news comes out, however they can use price action as the roadmap to guide where they can defend levels and where the market can go.  

ZB_06_13__60_Min___3_17_2013a.jpg

Continue reading
4538 Hits

30 Year Bond Flags off 'X' Level

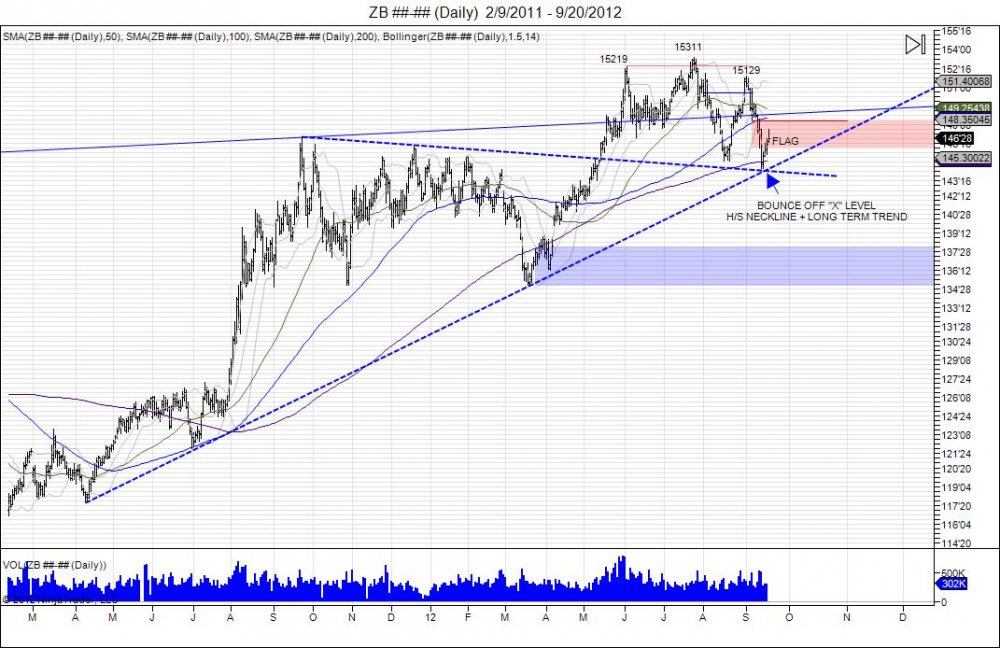
 ZB________Daily___2_9_2011___9_20_2012.jpg

In our last blog posting we noted how the 30 year bond fell into its "X" markets the spot level as the market fell into 14415 to take out the August lows and test major support based off this neckline along with the trendline deriving from the April 2011 low to the March 2012 lows.  Thus far, we have seen the market fight back off this level as shorts cover and buyers have come in to defend. This in turn has the market "flagging".  Flagging is a term used after a market makes an initial move into important support/resistance levels and takes a breather. In this case, the initial move was down from 15129 as the market failed to breach 15311, in turn putting in a right shoulder. The initial move fell to take out the neckline support of 14503 (august lows), placing the market against major support. Flagging is taking place now as the market is fighting off this level in attempt to test upside levels of where the market broke down from.  Today, the market ran it's open from the FOMC day on 9/13 at 14719 and has backed away.  The back and forth should continue, with next major upside resistance coming in at 14810 for sellers to defend. A breach above 15129 is needed to trap and squeeze shorts to void out this head/shoulder topping attempt and target the 15311 highs. Until then the market is in a bearish mode and sellers should look to retest the neckline.  Breaching the level gives room to expand this range from 15311-14503 being a range of 8'8 to the downside. Subtracting 8'8 from the neckline of 14503 gives a downside target of 136'28 to complete the pattern and place the market against the 2012 reversal level that led into these highs which tests the next major support level.

Continue reading
1165 Hits

30 Year Bond Head/Shoulder Topping Pattern

ZB________Daily___12_20_2010___9_11_2012.jpg

The 30 year bond's consolidation above its resistance line from the 2008-2011 highs has seen the market digest within a range of 14503-15311.  The high of 15311 was made in July after an initial high of 15219 in June.  This June high saw the market pulldown to retest its resistance line turning into support. This led to the higher high in July squeezing out early shorts as the market ran into 15311.  Prices were not able to hold above the old June highs and the move above this level turned into a failed breakout as the market reversed lower in August to take out the June lows and fall down to 14503 which retested where the market broke out in May.  Since this low, the market has seen a short covering rally bringing the market back to retest the breakdown off July's highs.  The retest has since fallen short with highs of 15129 put in on the first day of trading in September.  Since this high the market has backed away and retraced down to 14817 which is now retesting the prior week lows of 14810.  This is an attempt to build a right shoulder out of a head/shoulder pattern as the market retested that failed July breakout.  Aggressive bears have already faded the move, however the bear needs a close below 14810 this week to see continue the momentum.  The target for the move is to retest the August lows of 14503 being the neckline.  This brings the market back to where it bounced in August from its old resistance line that turned into support. Should this take place, the bear will have better oppurtunity to take out these lows and fall back below this line since the market saw a squeeze in August to test the July highs in turn building a right shoulder.  X marks the spot as seen in the daily chart above.  The range of 14503-15311 gives a downside target of 13627. Completing this downside target retests where the market reversed in March within 13805-13505 as then next major downside support.  A move past the september highs needs to be seen to trap shorts and target the July high for a short squeeze. 

Continue reading
4075 Hits

Treasury Charts

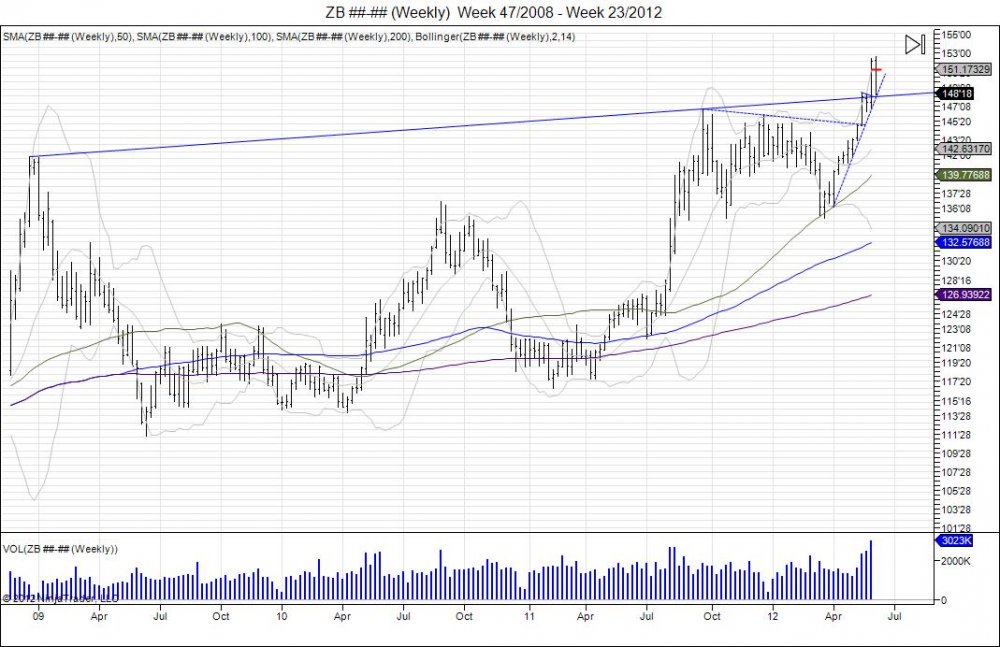
 ZB________Weekly___Week_47_2008___Week_23_2012.jpg

 Following the squeeze above its weekly resistance dating back from the 2009 highs, the market rallied to 15219 before reversing back to this trendline the market squeezed above.  Failure to hold this level turns this move higher into a failed breakout. Resistance comes in up to 15106 where sellers can look to defend these most recent highs with support at 14818-14622, 14508, 13804-13505.

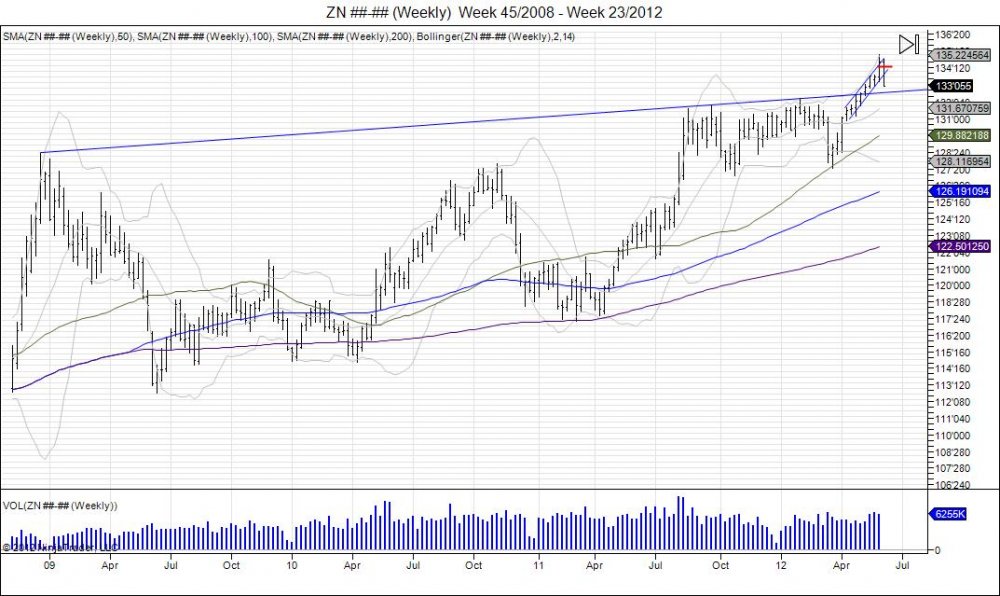
ZN________Weekly___Week_45_2008___Week_23_2012.jpg

 The 10 year has reversed off its highs of 135085 and taken out the lows from this high at 133155.  In turn this has broken the rising channel the market has seen from early April.  A weekly close below 133155 is bearish and turns the level to resistance which gives potential for this latest squeeze to 135085 to become a failed breakout.  Support is seen at this resistance trendline from highs dating back in 2008 within 13217-13106, followed by next major support at 129095-127230 from where this market pivoted higher in March. 

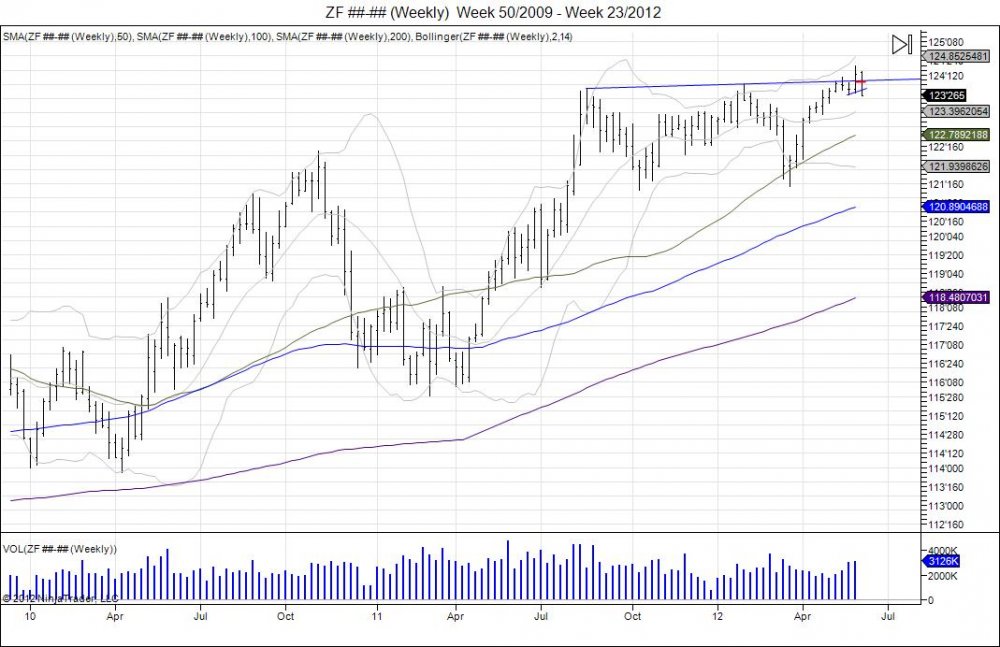
ZF________Weekly___Week_50_2009___Week_23_2012.jpg

Same scenario in the 5 year, a break through resistance from the August 2011-February 2012 highs and a reversal lower to take out the weekly lows off this breakout.  A close below this weekly low of 123285 is bearish and should be used as resistance for sellers looking to defend this breakout.  This turns this breakout into a failed one, with next major support at 123195-123102 followed by 122080-121135 from the March pivot.


Continue reading
2975 Hits

30 Year Bond Hourly

 ZB________60_Min___4_17_2012.jpg


Continue reading
988 Hits

10 Year Note Touches Ceiling Again

ZN________Daily___6_24_2011___4_17_2012.jpg

click to maximize 

Continue reading
2126 Hits