Chicagostock Trading

Chicagostock Trading

US Dollar: Major Correction Coming?

DX12 28


When President Trump was inaugurated in office, the US Dollar topped out with a high of 103815 in January of 2017.  In March of 2017 we wrote, "Will President Trump Devalue the US Dollar", highlighting Trump's comments about the currency, as well as the Bernanke's comments of dollar devaluation as a tool to fight deflation.  One year later, February of 2018, the dollar made a low of 88150, falling 15% from its January 2017 high.  For the last 2 years since this low, the market has worked its way higher in attempt to retest the failure in January of 2017.  The retest is technically major resistance for sellers to defend and buyers to overcome.  Thus far, the dollar has put in a lower high and is slowly backing away. Going forward, the dollar will need to overcome 100 for another shot at the high.  Failure to overcome 100 leaves the market vulnerable to continue falling in attempt to retest the 2018 low which is considered the neckline for a large monthly head/shoulder topping pattern that has developed.  A head/shoulder topping pattern is created when the market takes out a prior high to make a new high (01/17), failing to expand on the new high and falling back to take out the prior low (05/16).  By taking out the prior low, the breakout into the new high is considered a failed breakout. The low made after the breach of the May 2016 low is considered the neckline at 88150 as the market has bounced off this low in attempt to retest the failed breakout.  Breach of the neckline will be key. As breaking the neckline can see sellers chase the market to force expansion of 15.665 range (103815-88150), down to 72485 (88150-15665). The precious metals markets (gold/silver), have already seen a recovery as they have broken away from their multi-year downtrend.  Gold squeezed back to retest the Dec 2012 low of 1520, and has taken a pause since then, consolidating the gains.  Any further weakness in the USD would provide opportunity for the precious metals to push past these resistance levels in attempt to retest their highs.  


Reference: Will President Trump Devalue the US Dollar 
Continue reading
3131 Hits

The Turkey Squeeze - T/A Galore: 2 Inverted Head/Shoulders and a Cup/Handle


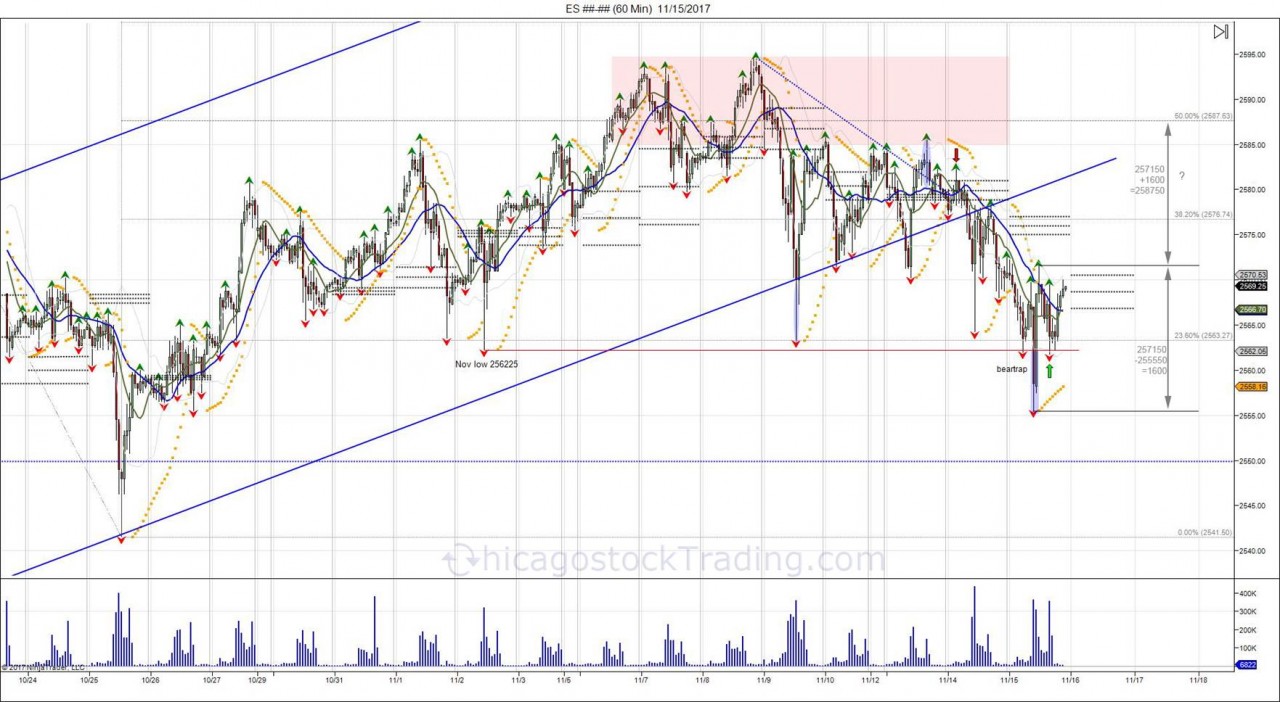
 Last week, the market took out the early November low of 256225, falling into 255550, before quickly bouncing back to 257150.  This break of the monthly low turned into a failed breakdown and a head fake as the market retested 2562 into the end of day, creating a right shoulder for an inverted head/shoulder pattern.  Shorts below 2562 were left trapped, giving opportunity to expand the range up to 257150.  


Continue reading
4075 Hits

Technical Analysis Right Before Your Eyes

Continue reading
3743 Hits

Stocks Strike Out , Cash Takes Profits

1-8-12b_1.jpg


The SP500 for the 3rd time in the last 3 months sold off on NFP numbers.  The last two, were both peak highs. March 7th the SP hit highs of 188750 before turning down to 182350. The FRB chair gave the markets a push on the 31st of March reassuring stimulus measures. This gave way for new highs going into the April 4th report at 189250, only to see these highs once again rejected after the NFP numbers were released that morning.  This higher high and failure led the market to break March lows and fall down to 1803 in April to shake out the long side and lure in shorts. This has led into a short squeeze leading into today's job number as the market retested the failed April highs to give buy side another chance to push through.  Third time was not the charm, as the NFP failed to breach old highs of 189250 and the cash open saw profit taking to hold the NFP high of 1886, setting up a LOWER high, as opposed to the last 2 NFP peaks. 

This selling on the Jobs report over the last 3 month period comes as the market nears the old 6.5% unemployment target the FRB established in December of 2012.  The SP closed 2012 at 1420, 30 year bonds at 147, gold at 1675, and the Yen at 115.  With the unemployment rate now at 6.3% below the 6.5% target that was pulled, we are seeing the 30 year bonds, gold, and the Yen all reverse their trends and show a strong 2014 in contrast to last year.  This is putting major pressure against the market as the 3 of these instruments all started on the lows of the year and grinded up to show a reversal and underlying bid by short covering.  The consolidation in bonds, gold, and the yen over the last 2 months is the markets way of keeping shorts trapped as the year lows hold and market stabilizes to force them to cover into what is now being seen.  The SP500 in contrast, has not changed its 2013 trend as of yet. The year of 2014 started weak with a move down to 1732 only to shake out longs and attract shorts in what turned into a reversal.  This setup a V bottom as the 2013 highs were taken out, and clearing the cache of shorts. now it was time to find new buyers to stabilize prices, and this is where we have been the last 3 months, in search of these buyers, which has led the market to consolidate sideways. Throughout this period, all peak highs that attempted to break higher were used as opportunities to take profits into by the market.  This shows that the long side is already heavy handed thus finding trouble getting new longs into the boat, giving way for the boat to be tipped for the majority to feel the pain.


Continue reading
1198 Hits

Copper VS SP500 UPDATE / Equity Tops

1-8-12b_1.jpg


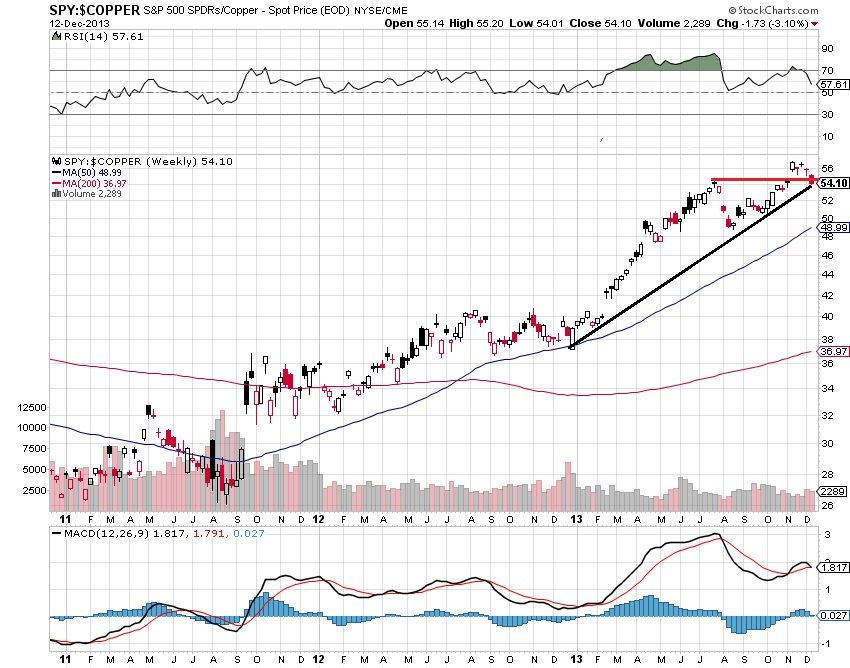
The spread between copper and the SP500 is now down to 5410 after hitting highs of 5679 in November.  This high marked a 25+% move higher in the SP500 and a 13-% move down in copper for the year of 2013.  Copper, known to be bell weather of economy as it shows industrial demand, tends to be a leader for the equity markets.  The fact that it was down this year as the SP500 diverged higher shows the move in equities was fueled only by QE as opposed to underlying macro.  Going forward, a breach of the August low in this spread confirms a failed break out with reversal attempt to cover/buy copper and sell the SP500.


 1-8-12b_1.jpg

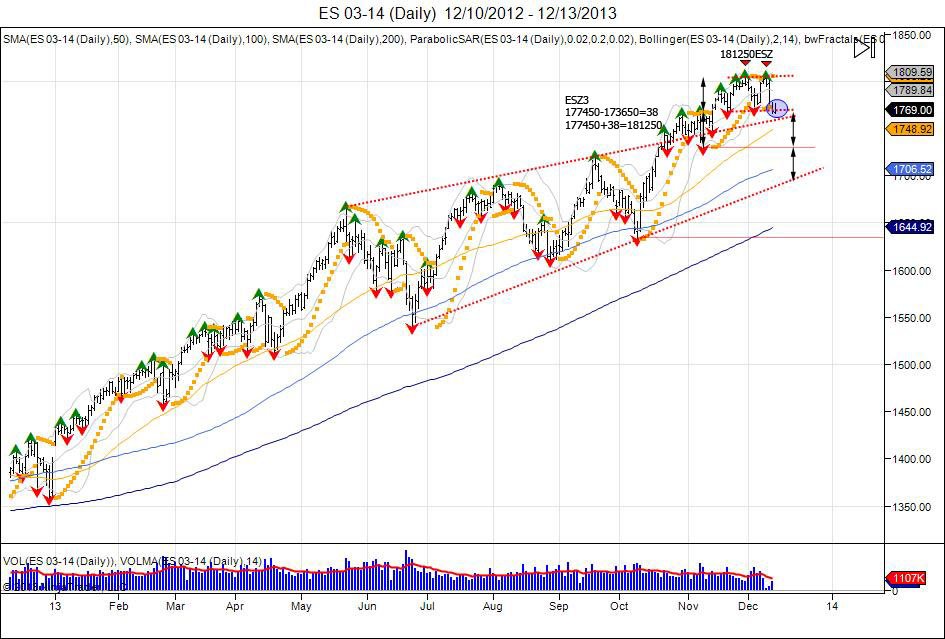
After breaking through the daily pennant created after the May correction that was followed by higher lows and higher highs, the SP500 traded in a tight range of 173650-177450.  This range of (38) was expanded higher as market broke above and turned 177450 into support, completing its target of 181250 to the tee with highs of 181250.  This was followed by a pullback to retest the 177450 level that held at 177775, followed by another retest of highs.  The retest was seen on the December release of the November NFP # that fueled the market to retest highs.  This retest fell short at 181150, seeing a rejection to take out the 177775 low, confirming a short term double top.  Market is now ont he edge fighting to hold above 1760 as this 1774 level becomes new resistance with the double top trapping longs and putting pressure lower.  Continued weakness below 1774 gives way to target the bottom of  old range at 173650 for stops.  Failure to hold 17360 can see the 1774--1736 range expanded down to 1698, into the bottom of the daily pennant and a test of the 100 day moving average which has not ben touched since October.


Continue reading
914 Hits

Accurately Predicting Gold Trends Using Technical Analysis

GC5_8_9.jpg

(click chart to enlarge)

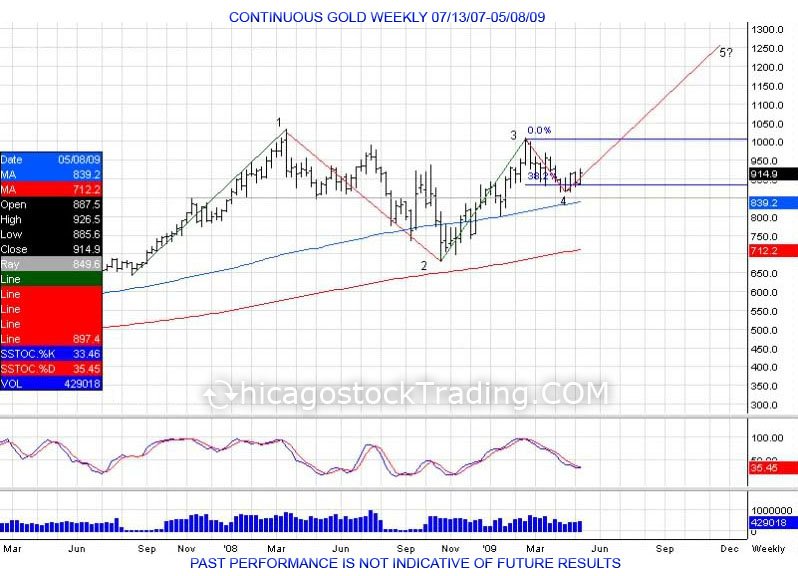
Gold in 2008 was the first time the market breached the $1000 mark, hitting highs of 1033.9 in March just as the Federal Reserve Bank of New York provided an emergency loan to Bear Stearns to keep the company solvent from it's bets in subprime mortgages.  This was followed by a correction and liquidation in the fall just as the equity markets began to crash in September.  The panic and liquidation selling led gold to fall into lows of 681 in October before retreating back to retest the $1000 mark in February of 2009.  This created an Elliot Wave pattern that saw the first wave 651-1033, second wave being the corrective wave from 1033-681, third wave being the move back up from 681-1007, fourth wave which was a very small 38.2% correction of the 3rd wave, setting up for the fifth wave to try and continue higher.


GCTRADE1-2.jpg

(click chart to enlarge)

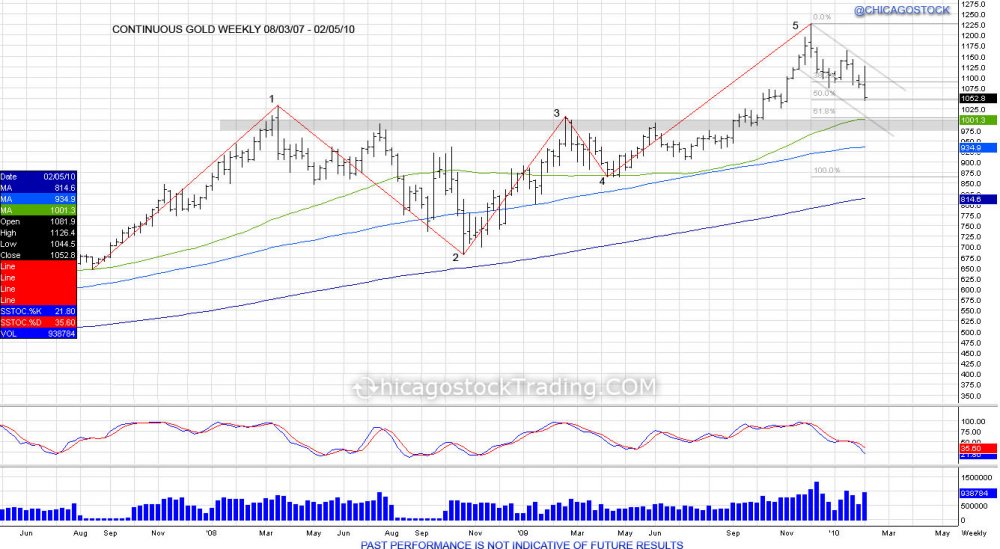
The fifth wave completed with gold moving from 865-1227.5 just as the Federal Reserve bank lowered their federal funds target rate to 0% in January of 2009.  This gave gold the fuel to move back through $1000 and continue this 5th buying wave to take out the old $1033.9 highs.  Showing gold's strength and proving naysayers who did not see gold breaching over $1000 again wrong.  As the 5th wave completed with highs of 1227.5, this led to profit taking and a small correction as gold corrected 50% of the 865-1227.5 move as well as coming back to retest the old 1033.9 highs with the gold making a low of 1044.5 in February of 2010. 


Continue reading
5247 Hits

FLASH BACK on the FLASH CRASH

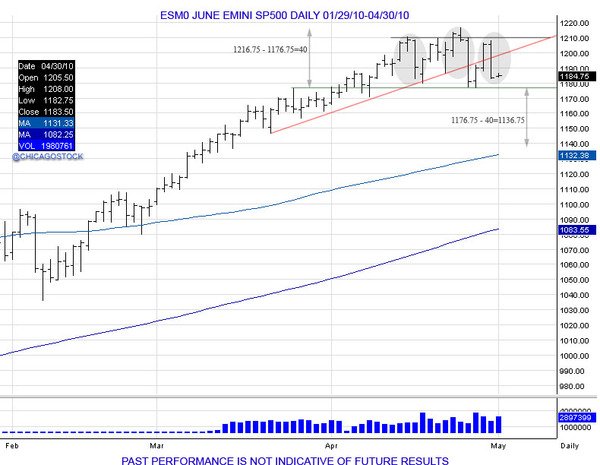
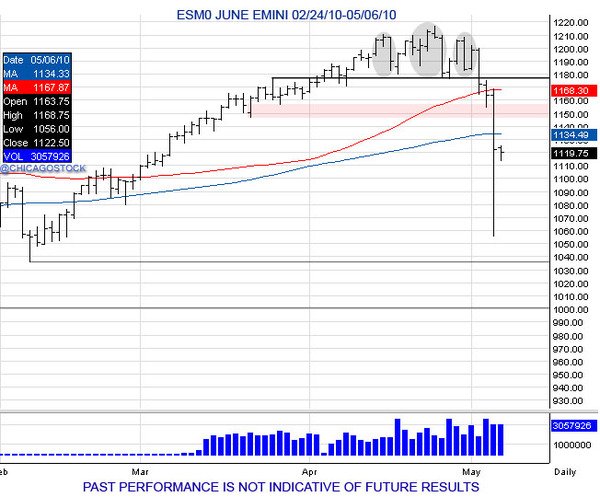
Going into May 6th, 2010, the SP500 was already having trouble on a daily basis, distributing within 1180-1220. After originally making a high of 1210.50 on April 15th, the market fell down to 1179.75 before recovering to take out the 1210.50 high and stop out early shorts.  This higher high up to 1216.75 failed to hold, seeing the market reverse to take out the previous 1179.75 low.  Lows of 1176.75 before another bounce was seen to retest the failed higher high at 1216.75.  The retest turned into a right shoulder as the market failed to push through the April 26th highs and fell through the previous low of 1176.75 to confirm a head/shoulder pattern.  Going into May 6th, the market had already broken below 1176.75 and had a target of 1136.75.


DRUDGE05_06_10.jpg 

SP5_6a.jpg

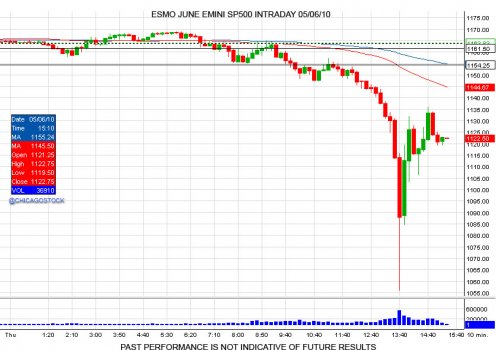
On the day of May 6th, 2010, the market was well below its 1176.75 neckline, opening at 1157.50 and making highs of 1165.00.  Pictures and videos of Greece riots being shown  added fuel to the fire. Things quickly deteriorated after the market fell below 1154 and turned the level into resistance.  This led to the head/shoulder target of 1136.75 to be completed.  With this target completing, this is when the flash crash flushed the market from 1130 down to 1056 before recovering back to the 1130 level into the close.

DRUDGE05_06_10A.jpg


Eventually, the market retraced back to its broken neckline of 1176.75 by making highs of 1174.75 before turning back lower to "back and fill" the flash crash lows of 1056.  Lows of 1002.75 were made in July of 2010 before reversing off the lows and into 1127.75, being were the market failed the prior month in June.  With the markets back to whipping back and forth in attempt to consolidate and build a bottom, a retest of the 1002.75 lows was made with the market falling down to 1037.00 on August 25th just before Ben Bernanke's Jackson hole meeting.  During this meeting "Bernanke Says Fed Will Do `All It Can' to Ensure U.S. Recovery".  With the Federal Reserve promising to defend the markets, this turned the retest of the summer lows into a bottom and the markets turned higher to see a breakout "gap and go" on September 13th with the market making lows of 1108 and holding above the prior day's high close of 1105 to leave a small gap open, giving way for a short squeeze to move back higher and take out the earlier April high of 1216.75 which eventually led to 1373.50 on May 2nd, 2011 before going through another consolidation period that presented another correction, filling the 1105 gap. Another volatile period and more promises of support from the Fed led to another gap and go breakout to start 2012 with a gap open higher with lows of 1259.75, keeping open a gap down to 1252.50 from December 30th and giving way for another short squeeze to move back higher and take out the May high of 1373.50. Throughout 2012, the market kept this gap at 1252.50 open to create another bottom during summer, targeting the year highs.  Small correction in fall of 2012 as the 1441 upside target was completed, making highs of 1468 before falling down to 1340.25 in November to retest where the market broke out in August.  Since these lows, another gap has been made, with 2013 opening above 1440 with lows of 1438.25 and a previous close of 1420.  This has led us to where we are now as the market has gone through another major short squeeze, bubbling throughout the year to take out the all time highs of 1586.75 and breaking above 1600 on the latest non farm payroll number reported on May 3rd.  


Continue reading
5354 Hits

SP500's Struggle and Failure

ES________Daily___11_6_2012___4_18_2013.jpg


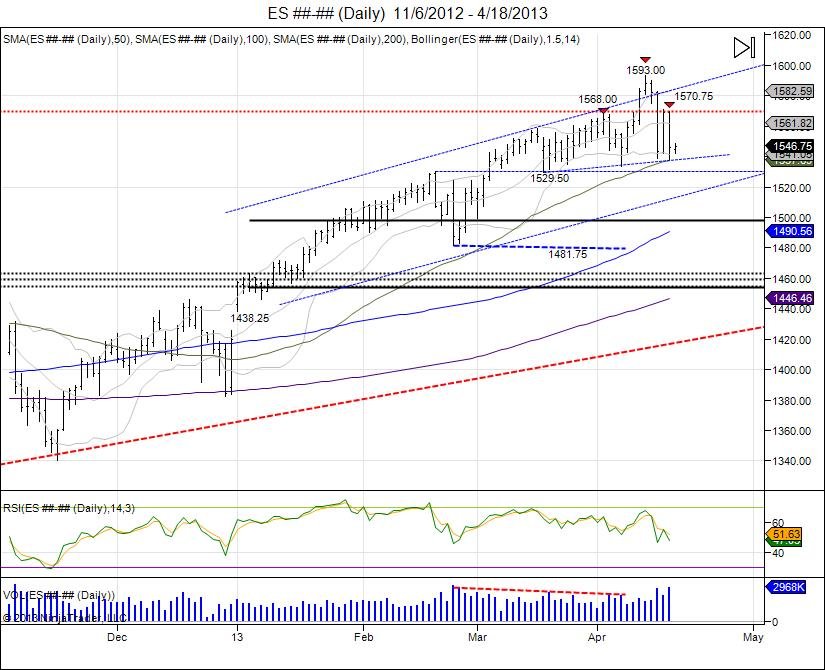
The market fought gruesomely in squeezing out shorts as sellers were attracted following the Cyprus breakdown. This led to a major tug of war, making higher lows and higher highs until 1568 printed and the market reversed into the April NFP report to shake out the series of higher lows test 152950 and hold. Once again luring in shorts thinking the 1568 was the top, only to see a massive short suqeeze taking the market through the old 1568 high to stop early shorts and print new highs of 1593 as the all time highs of 158675 were taken out. 

Since taking out all time highs, the market fell back to retest where it broke out above at 1568. Old resistance failed to hold as new support as the market fell below 1568 which saw next level of support tested at 1555 from the April 5th NFP highs.  The market attempted to stabalize this level, however with the Boston tragedy, selling pressure drove through this down to retest the NFP low of 153325 as the market held at 153875.  This hold led to a bounce back on Tuesday, resetting the market as it came back to the 1568 level to allow sellers a bounce to defend and buyers another oppurtunity against the highs. Buy side failed to materialize and hold 1568 which in turn has seen sellers take control to reverse the market back below Monday's 153875 low.  In turn the bounce to retest 1593 has turned into a right shoulder of a head/shoulder topping pattern.  The neckline was broken on Wednesday as the market took out Monday's lows of 153875, giving 1568 shorts their first target.  At this point buyers are forced to defend last week's lows of 154300.  Closing below this for the week triggers sell signals going into next to continue the move lower. Closing below the daily neckline of 153875 gives room to expand the range of 54.25 (159300-153875) down to 1484.5 which would be a retest of the February lows at 148175. The Cyprus low remains the line in the sand which was a retest of the old February highs, falling below gives room to target February's lows with next major support within 1465-1450.

Continue reading
3755 Hits

SP500 Double Top Caution

 ES________120_Min___3_25_2013.jpg


Last Sunday's breakdown to 1529.50 on the Cyprus news saw the market bounce off the old February highs of 1530 with lows of 1529.50.  This led to a roller coaster ride for the week as the market climbed back to 1552.50, fell down to 1531.75, squeezed back to 1555.75, fell back to 1535.00, and most recently completed the pattern of higher lows and higher highs by getting up to 1560.50.  This was a calculated attempt to defend those lows and make higher highs to squeeze out small sellers.  The latest high was done this Sunday night (one week after the gap down from 1544-1529.50), stopping out small shorts as the previous year high of 1558.75 was taken out.  The market has thus far rejected this new high and fallen down to where the it opened on Friday.  There is major risk now that this higher high turns into a failed breakout and a double top should buyers failed to defend the most recent pivot low of 1535.00.  Minor support off these lows are seen at 1539, however buyers should find it much harder to hold this trend and the lows of 1535 after new highs were set at 1560.50 which give much more pressure to take out these rising lows and squeeze out buyers.  This would confirm the new highs as a failure a double top with a breach of 1529.50. As discussed in the previous video, the market has been working on creating a head above 1530 for a head/shoulder topping pattern which confirms on a move below 1481.75.  


Continue reading
2531 Hits

Yen Gets Down to Tgt Zone

 6J________Weekly___Week_49_2009___Week_42_2012.jpg


6J________Weekly___Week_8_2010___Week_6_2013.jpg


The Japanese Yen has come a long way since putting in it's right shoulder of 12967 in September of 2012 and breaking its neckline of 11879 in December.  This this breach of the neckline, the market has been in a downside chase in a hurry to complete its h/s target of 10494. Target is used by taking range 13264-11879=1385 and subtracting this from 11879 to give 10494.  Lows of 10633 were made this week as the Yen has retraced back to the flash crash levels of 2010.  The opening in May was 10650 which has provided some support at this time with lows of 10532 as seen on the weekly chart. An attempt to bottom out is being made here however major stops remain below this 10532 low from May of 2010 so any buying at these levels is aggressive and most likely short covering.  First level of support comes within 10730-10760 as a range aggressive buyers can defend with small stops below these most recent lows of 10630. First level of upside resistance met within 10960-11075, followed by 11090-11396.


Continue reading
2763 Hits

Apple's Room to 650

 AAPL__Monthly___12_2008___1_2013.jpg

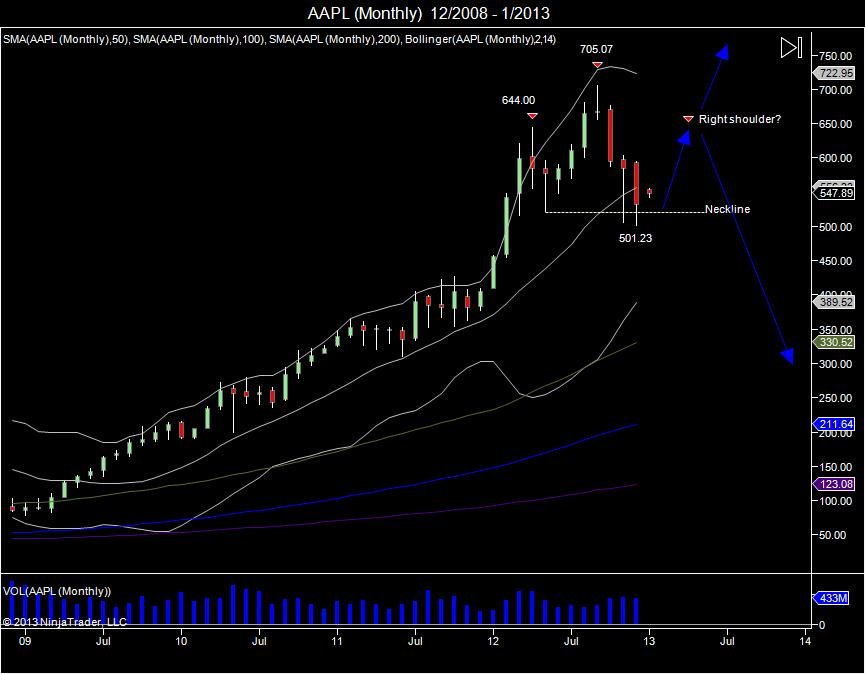
Since putting in highs of 705.07 as the iPhone 5 was announced in September of 2012, doubling from the August 2011 lows of 350, Apple saw a reversal in October that broke the September lows of 656.  This turned into a major failure and sell the news catalyst as the market quickly reversed lower.  This reversal led the market to fall into its 100day moving average on the daily chart, making lows of 623.55 to test where the market broke out in August.  Just as the market was on these lows at 623, Apple bulls were relentless in thinking to just buy the dip. An Apple event was scheduled for October 23 that had these bulls giddy for a move higher. Warning about how this event was what the bulls were hanging their hopes on, a mini ipad.  


Continue reading
3826 Hits

SP500, Nasdaq, and Apple Video Analysis

Continue reading
4141 Hits

The Ultimate Short Squeeze 665-1441 & Accurately Predicting Every Correction Using Technical Analysis


Since the all time highs of 1586.75 set October of 2007, the SP500 corrected into lows of 1255.50 early 2008 with Bear Stearns bankruptcy.  A short squeeze was seen up to 1441 in May of 2008, only to reverse and fall into lows of 1373.50.  This reversal led to a summer decline that took out the years and set up a shaky market going into the fall. As September began, the SP500 made highs of 1303.50 only to reverse and cause a spike in the Volatility Index.  This reversal ultimately led to the crash as the market fell into lows of 665.75, March of 2009.  Since this low, the market has channeled higher on glass stairs as it has gone through few major shakedowns however managed to continue the squeeze and retrace 100% of the breakdown from 1441.  Below are the corrections seen during this move.

Click charts to maximize. 

SP500 sets highs of 1216.75 before stalling to create a head/shoulder topping pattern projecting 1136.75. Ultimately seeing a flash crash with a quick move to 1056 before coming back to the 1130 level. 


2010 SP500 Head/Shoulder Topping Pattern Completes 1136.75 and sees Flash Crash to 1060s:

Continue reading
18776 Hits

Nasdaq Thanks Current Administration for a 182% Gain

 NQ________Monthly___11_1999___11_2012.jpg


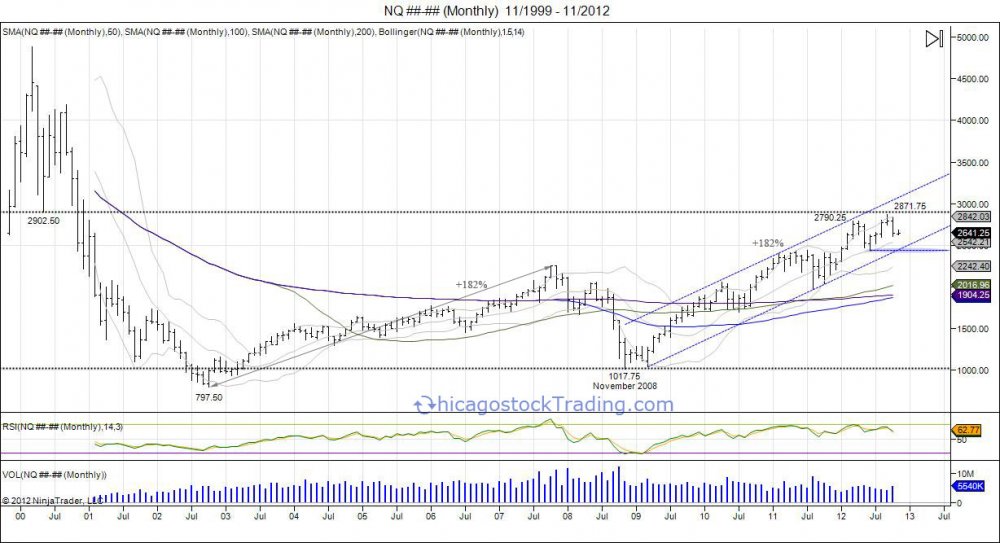
Since the last election in November of 2008, the Nasdaq has risen 182% off the lows of 1017.75 to highs of 2871.75 set just last September.  This 182% increase in 4 years, matches exactly the same amount it rose from 797.50 to 2256.25 within the time period of 2002-2007.  The market corrected after this gain from 2002-2007, falling back to retesting the lows set in 2002.  The test came during the time of the last election in 2008 as the market fell to 1017.75 following the crash of 2008 and found support based off the 2002 lows.  Since this last election and lows, a slow short squeeze and grind higher has taken place, through the 2007 highs and retracing back to where the Nasdaq failed in the dot com era at the 2900 level.  The market fell short of the 2900 level by about 30 points before reversing in October down to 2604.50.  An attempt to test the September high of 2871.75 was seen during the October Non-farm payroll numbers as the Nasdaq rallied to 2840.75 and reversed lower as it failed to move past the September highs. This in turn built a daily head/shoulder corrective pattern that targeted the 2650 level. This small corrective pattern completed in October down as the market fell into its support range of 2650-2600 based off where it broke out to the highs in August.  Going forward, the small corrective pattern is over, however on a longer term picture as we look at the monthly chart, we see this small corrective pattern as a road block going forward.  Based off the longer time frame the September range of 2736-2871.75 now offers a new area of major resistance for the market to work through to regain the upside momentum. Until then, rallies up to this level offer an area for longs to take profits, protect longs, and or short the market.  There is a chance the market fails to test the level as the market is in a downside chase having caught buyers off guard by the reversal and not giving an opportunity to gain on their most recent purchases. Continued pain and chase sees the market falling down to take out the 2433.75 low made in June, to squeeze out these buyers who have been trying to participate in this decline over the last month.  By targeting the June lows, the market squeezes out these buyers and gives opportunity to establish a neckline for a short squeeze to retest the 2736-2871.75 level. This retest of the failure in September gives opportunity for buyers to show their strength by squeezing through and for sellers a level to defend to build a right shoulder for a larger head/shoulders topping pattern based on the monthly chart.  There have been many programs established over the past years to keep the squeeze in equities afloat, the most recent one was the biggest with the Fed coming out with Quantitative Easing without an end date.  This announcement came at the highs and gave the final push in the market up to 2871.75. Thus far it has failed to hold up. Here we are one day before the next election is voted on and the market is in a corrective phase. Regardless of the outcome of the election, we must take caution of October’s reversal as the market is now in sell the rally mode, until a move past the September high is seen.  For buyers and sellers, it is wise to sit on hands as this month of November offers more data to be used. Buyers should await a move down to the June lows to defend, and sellers a test of 2736 to defend.  Ultimately, should the market build this head/shoulder top on the monthly chart, this gives a projection down to the 1900 level to coincide with the August 2011 levels and the 50, 100, and 200day moving averages. During the last 4 years, the stock market (Nasdaq) is up 182%, US government debt per American under 18 is up 53%, the national debt up 52.6% and unemployment has risen from 6.8% to 7.9%.  Looking at these numbers, it appears the past 4 years favored wall street over main street. 


Continue reading
3677 Hits

SP500's Double Top, Nasdaq's Head/Shoulder

 ES________Daily___12_22_2011___10_12_2012.jpg


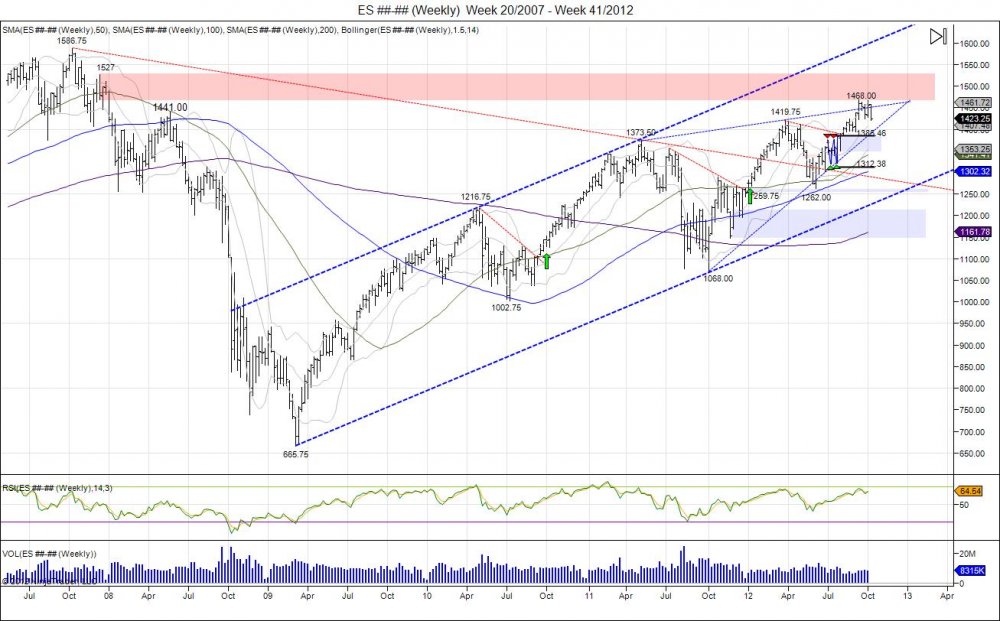
With the SP500 completing its 1441 target coined earlier this early, along with the double bottom made in summer that also targeted this, highs of 1468 were made in September as the short squeeze above the level took the market into this next level of resistance.  The market saw a small pullback off the highs and found support off a small trendline based off the August 2nd pivot lows and through the September 4th lows.  Not quite ready to break down, the market grinded higher to retest the highs made in September.  With the non farm payroll numbers released on October 5th, the market squeezed through 1460, stopping out weak shorts, yet falling short of the 1468 high by 2 handles at 1466 and quickly seeing a rejection during the day.  This rejection continued this week as the market saw this as a failure and a potential to double top.  With the breakdown seen this week that led the market to take out the trendline from the August2-Sep4 lows, this confirmed the double top and now targeted the 1424 pivot lows made on September 26th prior to double topping.  As the market is now working itself through this area of support, next major support comes in at 1410 based off the 1394.50 pivot low made on September 4th, and ultimately sees next major support at 1385 being where the market broke out early August to establish the bullish bias for the second half of the year. This fills the market back to where it broke out during the summer as many coined as a "light volume" rally, and most missed the move higher.  This gives the ultimate level for the market to base out for the year and see if buyers step up at these levels to support the market after squeezing out all these late buyers who have come into the market chasing above 1420.  The 50day moving avearge is being tested here. For this week the bear mission is to close the market below last week's open of 1432.75 to establish a bearish engulfment on the weekly chart to project more weakness going into next week.  Doing so sees first level of resistance at 1427.75, followed by 1451.25 being the lows off the failed 1466 high and the range buyers must work through to regain momentum. 


ES________Weekly___Week_20_2007___Week_41_2012.jpg


Continue reading
5639 Hits

Nasdaq + Euro

 NQ________Daily___3_16_2012___10_5_2012.jpg

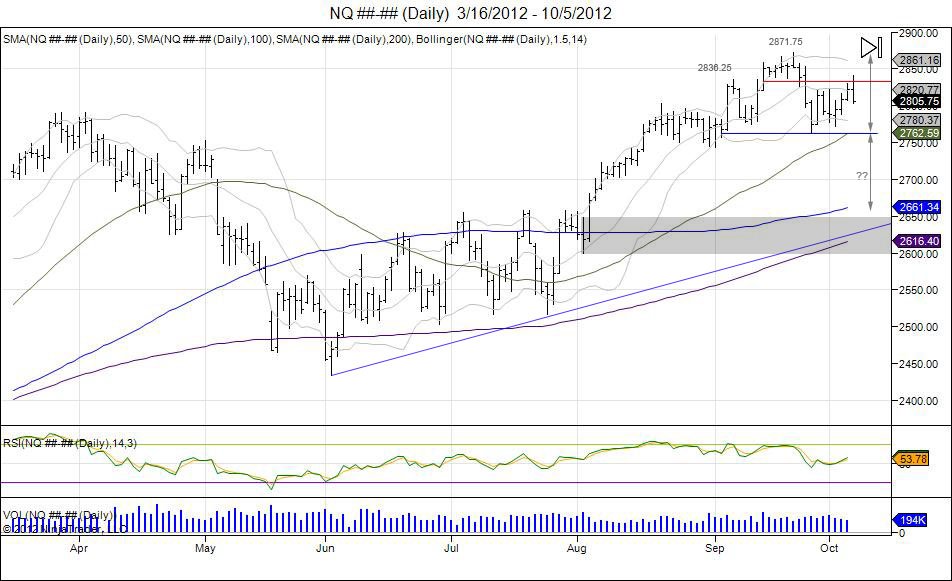
Last month, the Nasdaq future made a higher high of 2871.75, just before reversing to take out the 2775.25 lows made just before that high. The market made lows of 2762.25 on September 26th. Not ready to break the September lows, the market grinded higher off this late September low into retesting where the market failed from the highs. This retest was touched today on the NFP number with highs of 2840.75. This put the market right into the hands of sellers to defend the failed September high, and looking for a right shoulder to build on this failure.  Thus far the market is trading on its lows and giving these sellers oppurtunity to take a portion off as this is being reversed the same day.  Going forward, buyers must work through this 2840-2872 resistance to squeeze out this head/shoulder pattern attempt and stop sellers.  Sellers must look for a move down to the neckline now of 2762.25 to confirm this pattern and allow for another level to take a layer of shorts off.  Continuation of the pattern is seen should the market continue to see sellers below the neckline which gives a downside target of 2652.75, retracing the market to where it broke out early August. 


Continue reading
12522 Hits

SP500 Chart Analysis

 ES________60_Min___9_26_2012.jpg

click chart to maximize


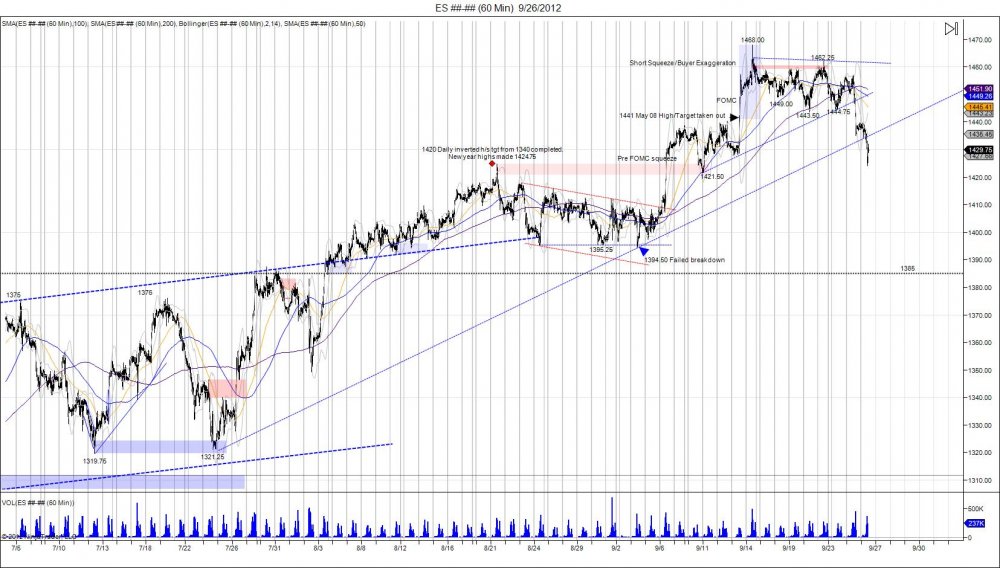
The SP500 completed its 1441 target and squeezed into its next major resistance being 1468, tapping it on the button as buyer exageration and short squeeze above 1441 led the market into this next level. Thus far, the market saw consolidation off 1468 in attempt to build a base down to 1443, however buyers ran out of gas as the market reversed Tuesday as they attempted to test the upper 1450s and fell to take out this 1443.50 level.  This has the market now testing an important support range within 1437-1421 as lows of 1424 were made today, fighting to hold the 1421.50 low made September 11th, being the pivot low prior to the run into 1468.  Below this level comes 1410-1394.50 being the pivot low made on the 4th as the market made a failed breakdown and ran from this into the 1468 level. This level could be the target for this move to squeeze out dip buyers and back and fill into this level.  Should this take place, 1385 comes in as next major support on the downside that we must look for the market to test and attempt to hold to offer oppurtunity to reload. There are many eager buyers who want to come in as the market retraces its FOMC move higher, moving down into where this leg up began at 1394, would certainly hurt these buyers. 


Continue reading
3735 Hits

30 Year Bond Flags off 'X' Level

 ZB________Daily___2_9_2011___9_20_2012.jpg

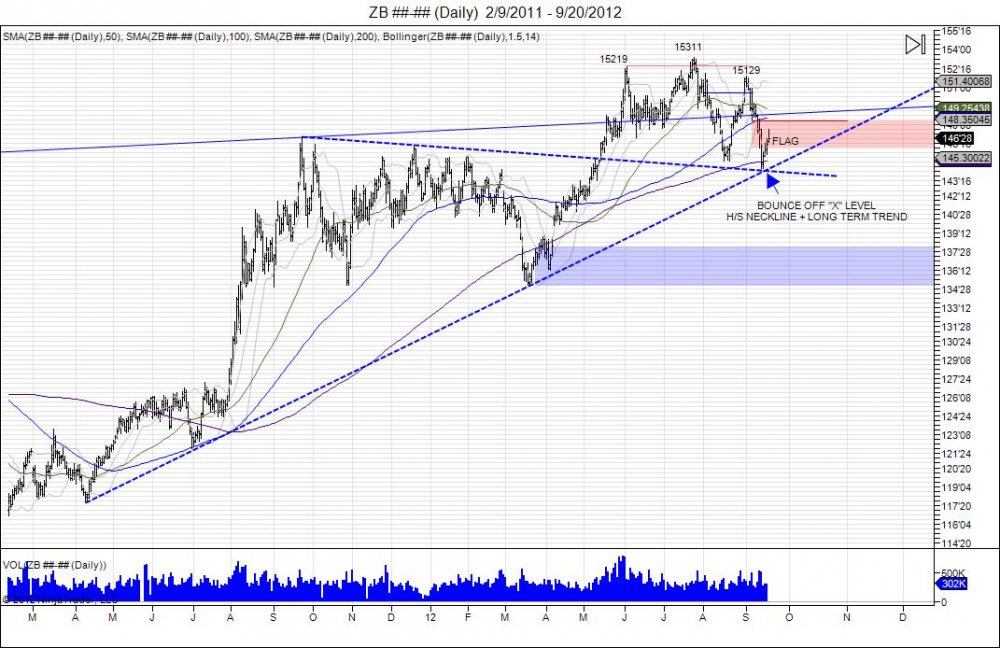
In our last blog posting we noted how the 30 year bond fell into its "X" markets the spot level as the market fell into 14415 to take out the August lows and test major support based off this neckline along with the trendline deriving from the April 2011 low to the March 2012 lows.  Thus far, we have seen the market fight back off this level as shorts cover and buyers have come in to defend. This in turn has the market "flagging".  Flagging is a term used after a market makes an initial move into important support/resistance levels and takes a breather. In this case, the initial move was down from 15129 as the market failed to breach 15311, in turn putting in a right shoulder. The initial move fell to take out the neckline support of 14503 (august lows), placing the market against major support. Flagging is taking place now as the market is fighting off this level in attempt to test upside levels of where the market broke down from.  Today, the market ran it's open from the FOMC day on 9/13 at 14719 and has backed away.  The back and forth should continue, with next major upside resistance coming in at 14810 for sellers to defend. A breach above 15129 is needed to trap and squeeze shorts to void out this head/shoulder topping attempt and target the 15311 highs. Until then the market is in a bearish mode and sellers should look to retest the neckline.  Breaching the level gives room to expand this range from 15311-14503 being a range of 8'8 to the downside. Subtracting 8'8 from the neckline of 14503 gives a downside target of 136'28 to complete the pattern and place the market against the 2012 reversal level that led into these highs which tests the next major support level.

Continue reading
1165 Hits

30 Year Bond Market X Marks the Spot

 ZB________Daily___1_7_2011___9_14_2012.jpg


The 30 year bond market has fallen back down to take out its neckline made from the August lows of 14503. This comes as the market bounced off those levels to retest the June highs only to fall short at 15129 on the first trading day of September. Throughout the month of September, money has been coming out of this market going into the FOMC decision yesterday with lows of 14710.  Following this FOMC decision to continue operation twist along with mortgage back securities, panic selling was seen in the bond market to be the catylst in breaking the August lows.  This move has brought the market down into this major support level to test its neckline.  Smart money that defended the highs in turn creating the right shoulder for this attempt to top have reached an area to cover part of any short positions. Should panic continue and buyers fail to step up to defend this neckline, the head/shoulder pattern completes at 13627 to fill the gap made in April within 13811-14015. Going forward, first level of upside resistance is met at 14605 being the lows from Thursday's FOMC. Thereafter, 14810-15129 is the next range of resistance being the right shoulder buyers must work through to target the highs of 15311 in squeezing out sellers and voiding out the h/s pattern.  Last month's open was 15117 with a close of 15113.  The market opened this month trading 15121, this is setting up to be a bearish engulfment for the month unless the market can manage to push back up to 15113 before the end of the month.

Continue reading
2784 Hits

30 Year Bond Head/Shoulder Topping Pattern

ZB________Daily___12_20_2010___9_11_2012.jpg

The 30 year bond's consolidation above its resistance line from the 2008-2011 highs has seen the market digest within a range of 14503-15311.  The high of 15311 was made in July after an initial high of 15219 in June.  This June high saw the market pulldown to retest its resistance line turning into support. This led to the higher high in July squeezing out early shorts as the market ran into 15311.  Prices were not able to hold above the old June highs and the move above this level turned into a failed breakout as the market reversed lower in August to take out the June lows and fall down to 14503 which retested where the market broke out in May.  Since this low, the market has seen a short covering rally bringing the market back to retest the breakdown off July's highs.  The retest has since fallen short with highs of 15129 put in on the first day of trading in September.  Since this high the market has backed away and retraced down to 14817 which is now retesting the prior week lows of 14810.  This is an attempt to build a right shoulder out of a head/shoulder pattern as the market retested that failed July breakout.  Aggressive bears have already faded the move, however the bear needs a close below 14810 this week to see continue the momentum.  The target for the move is to retest the August lows of 14503 being the neckline.  This brings the market back to where it bounced in August from its old resistance line that turned into support. Should this take place, the bear will have better oppurtunity to take out these lows and fall back below this line since the market saw a squeeze in August to test the July highs in turn building a right shoulder.  X marks the spot as seen in the daily chart above.  The range of 14503-15311 gives a downside target of 13627. Completing this downside target retests where the market reversed in March within 13805-13505 as then next major downside support.  A move past the september highs needs to be seen to trap shorts and target the July high for a short squeeze. 

Continue reading
3988 Hits