Chicagostock Trading

Chicagostock Trading

SP500's Trouble with 2665 and Thursday's Vol Windows Defined

On Thursday, the day after the FOMC statement, we review the intraday action in regards to Chicagostock's Volatility windows and pivots.  The highlighted blue box, is the cash market open, NYSE 930 AM.  After the open, the cash market had trouble overcoming the intraday pivots, seeing the range act as resistance.  This led the market to fall into the lower Vol window which was met with a defensive bounce.  The defensive bounce gave way for a retest of the open, giving sellers an area to defend and buyers major resistance to overcome.  For buyers that picked up the initial test of the lower Vol window, this provided a bounce to take some profits into.  Second or third attempt at the lower Vol window, increases the odds of seeing the level failing. After failing to overcome the opening range, the market drifted back toward the lower Vol window which was taken out. In order to establish a bearish intraday bias, a 5 minute hold below the lower Vol window needs to be seen.  Sometimes the market can establish a bias, and bounce back to the open to again force sellers to defend their intraday trend.  In this case, the second test of the lower Vol window saw the level taken out, establishing a bearish intraday bias.  Since there was already an early bounce off the lower Vol window, there was not another one and sellers expanded the market lower, forcing longs to liquidate into the close. 
 

Continue reading
2850 Hits

The Ebola Swan- SP500/Yen Market Review


Futures, foreign currency and options trading contains substantial risk and is not for every investor. An investor could potentially lose all or more than the initial investment. Risk capital is money that can be lost without jeopardizing ones financial security or lifestyle. Only risk capital should be used for trading and only those with sufficient risk capital should consider trading. Past performance is not necessarily indicative of future results. Video content hosted by third party.

Continue reading
3168 Hits

Accurately Predicting Gold Trends Using Technical Analysis

GC5_8_9.jpg

(click chart to enlarge)

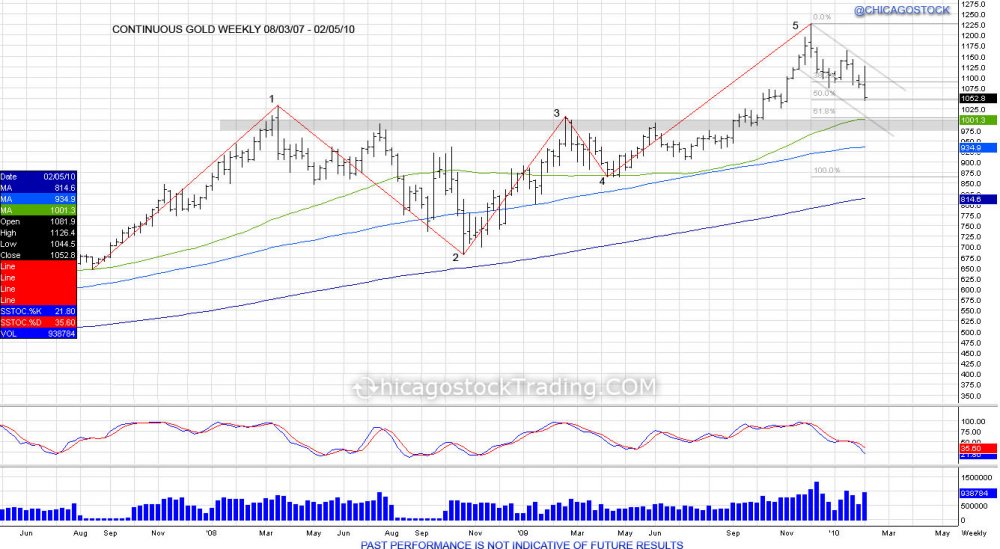
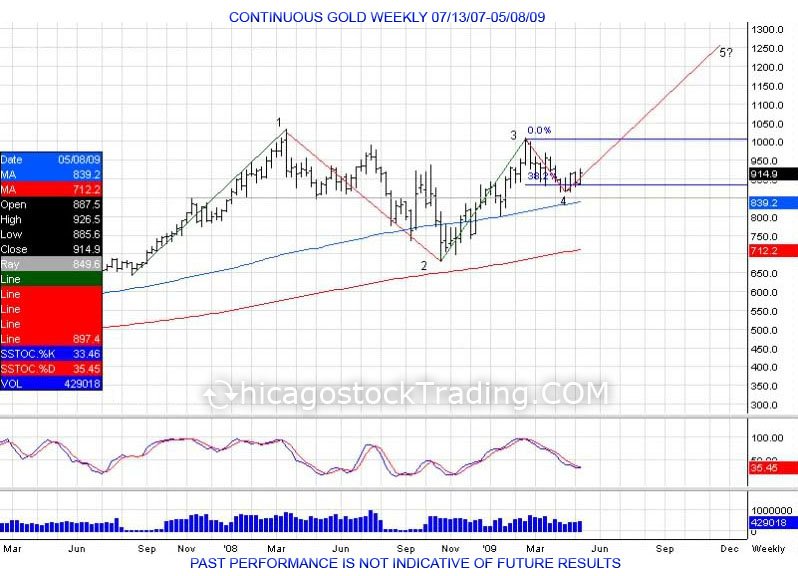
Gold in 2008 was the first time the market breached the $1000 mark, hitting highs of 1033.9 in March just as the Federal Reserve Bank of New York provided an emergency loan to Bear Stearns to keep the company solvent from it's bets in subprime mortgages.  This was followed by a correction and liquidation in the fall just as the equity markets began to crash in September.  The panic and liquidation selling led gold to fall into lows of 681 in October before retreating back to retest the $1000 mark in February of 2009.  This created an Elliot Wave pattern that saw the first wave 651-1033, second wave being the corrective wave from 1033-681, third wave being the move back up from 681-1007, fourth wave which was a very small 38.2% correction of the 3rd wave, setting up for the fifth wave to try and continue higher.


GCTRADE1-2.jpg

(click chart to enlarge)

The fifth wave completed with gold moving from 865-1227.5 just as the Federal Reserve bank lowered their federal funds target rate to 0% in January of 2009.  This gave gold the fuel to move back through $1000 and continue this 5th buying wave to take out the old $1033.9 highs.  Showing gold's strength and proving naysayers who did not see gold breaching over $1000 again wrong.  As the 5th wave completed with highs of 1227.5, this led to profit taking and a small correction as gold corrected 50% of the 865-1227.5 move as well as coming back to retest the old 1033.9 highs with the gold making a low of 1044.5 in February of 2010. 


Continue reading
5371 Hits

FLASH BACK on the FLASH CRASH

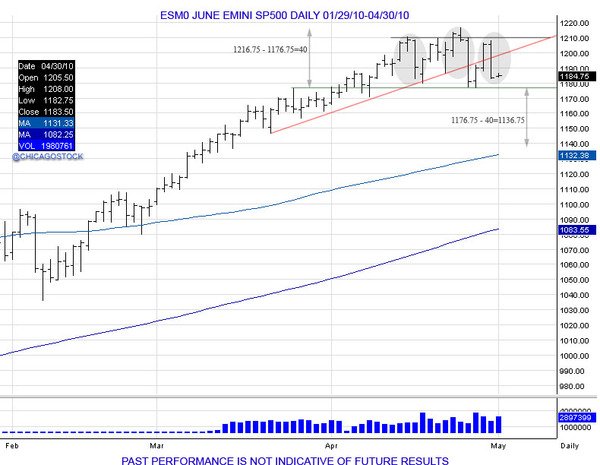
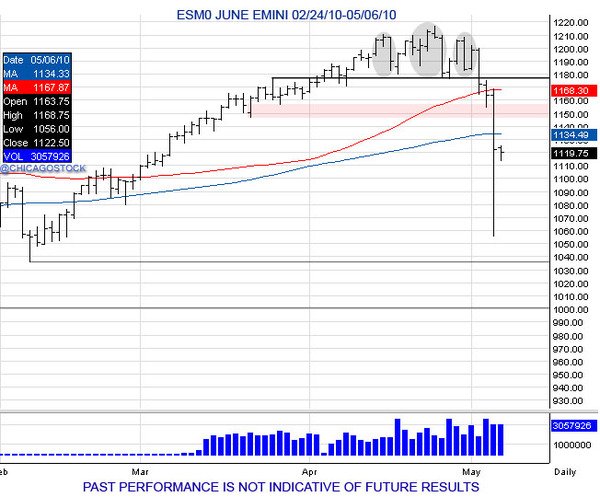
Going into May 6th, 2010, the SP500 was already having trouble on a daily basis, distributing within 1180-1220. After originally making a high of 1210.50 on April 15th, the market fell down to 1179.75 before recovering to take out the 1210.50 high and stop out early shorts.  This higher high up to 1216.75 failed to hold, seeing the market reverse to take out the previous 1179.75 low.  Lows of 1176.75 before another bounce was seen to retest the failed higher high at 1216.75.  The retest turned into a right shoulder as the market failed to push through the April 26th highs and fell through the previous low of 1176.75 to confirm a head/shoulder pattern.  Going into May 6th, the market had already broken below 1176.75 and had a target of 1136.75.


DRUDGE05_06_10.jpg 

SP5_6a.jpg

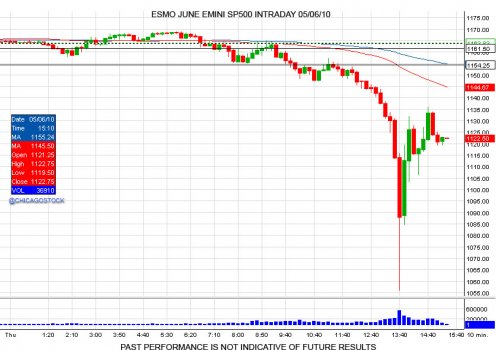
On the day of May 6th, 2010, the market was well below its 1176.75 neckline, opening at 1157.50 and making highs of 1165.00.  Pictures and videos of Greece riots being shown  added fuel to the fire. Things quickly deteriorated after the market fell below 1154 and turned the level into resistance.  This led to the head/shoulder target of 1136.75 to be completed.  With this target completing, this is when the flash crash flushed the market from 1130 down to 1056 before recovering back to the 1130 level into the close.

DRUDGE05_06_10A.jpg


Eventually, the market retraced back to its broken neckline of 1176.75 by making highs of 1174.75 before turning back lower to "back and fill" the flash crash lows of 1056.  Lows of 1002.75 were made in July of 2010 before reversing off the lows and into 1127.75, being were the market failed the prior month in June.  With the markets back to whipping back and forth in attempt to consolidate and build a bottom, a retest of the 1002.75 lows was made with the market falling down to 1037.00 on August 25th just before Ben Bernanke's Jackson hole meeting.  During this meeting "Bernanke Says Fed Will Do `All It Can' to Ensure U.S. Recovery".  With the Federal Reserve promising to defend the markets, this turned the retest of the summer lows into a bottom and the markets turned higher to see a breakout "gap and go" on September 13th with the market making lows of 1108 and holding above the prior day's high close of 1105 to leave a small gap open, giving way for a short squeeze to move back higher and take out the earlier April high of 1216.75 which eventually led to 1373.50 on May 2nd, 2011 before going through another consolidation period that presented another correction, filling the 1105 gap. Another volatile period and more promises of support from the Fed led to another gap and go breakout to start 2012 with a gap open higher with lows of 1259.75, keeping open a gap down to 1252.50 from December 30th and giving way for another short squeeze to move back higher and take out the May high of 1373.50. Throughout 2012, the market kept this gap at 1252.50 open to create another bottom during summer, targeting the year highs.  Small correction in fall of 2012 as the 1441 upside target was completed, making highs of 1468 before falling down to 1340.25 in November to retest where the market broke out in August.  Since these lows, another gap has been made, with 2013 opening above 1440 with lows of 1438.25 and a previous close of 1420.  This has led us to where we are now as the market has gone through another major short squeeze, bubbling throughout the year to take out the all time highs of 1586.75 and breaking above 1600 on the latest non farm payroll number reported on May 3rd.  


Continue reading
5483 Hits

SP500 Double Top Caution

 ES________120_Min___3_25_2013.jpg


Last Sunday's breakdown to 1529.50 on the Cyprus news saw the market bounce off the old February highs of 1530 with lows of 1529.50.  This led to a roller coaster ride for the week as the market climbed back to 1552.50, fell down to 1531.75, squeezed back to 1555.75, fell back to 1535.00, and most recently completed the pattern of higher lows and higher highs by getting up to 1560.50.  This was a calculated attempt to defend those lows and make higher highs to squeeze out small sellers.  The latest high was done this Sunday night (one week after the gap down from 1544-1529.50), stopping out small shorts as the previous year high of 1558.75 was taken out.  The market has thus far rejected this new high and fallen down to where the it opened on Friday.  There is major risk now that this higher high turns into a failed breakout and a double top should buyers failed to defend the most recent pivot low of 1535.00.  Minor support off these lows are seen at 1539, however buyers should find it much harder to hold this trend and the lows of 1535 after new highs were set at 1560.50 which give much more pressure to take out these rising lows and squeeze out buyers.  This would confirm the new highs as a failure a double top with a breach of 1529.50. As discussed in the previous video, the market has been working on creating a head above 1530 for a head/shoulder topping pattern which confirms on a move below 1481.75.  


Continue reading
2531 Hits

Bond Market's Technical Signals Before Cyprus

 ZB 06-13 (60 Min)  3_15_2013_1.jpg

The bond market showed signs of reliance late last week as the SP500 printed new highs early Friday, yet bonds stabilized to create a base from those lows printed on Thursday at 14024.  Friday's action saw lows of 14105, testing and holding the range from Thursday's lows, and in turn building a right shoulder for an inverted head/shoulder pattern as aggressive buyers were using this as an entry with stops below Thursday's lows.  The move on Friday squeezing through the neckline of 14121 confirmed the inverted head/shoulder and rewarded buyers down to 14105. This range of 14121-14024 gave an upside target of 14223 to complete the expansion of the inverted head/shoulder. As the market held above this neckline on Friday, it consolidated after taking out the 14129 high made on NFP day and in turn this consolidation created a bull flag as seen in the hourly chart, also projecting 14223.  

All of this technical analysis confirmed Sunday night as the bond market opened higher at 14210 and squeezed to complete the target of 14223. The catalyst for this, 'news' out of Cyprus putting a tax on bank deposits.  Price action always precedes news as one cannot predict when news comes out, however they can use price action as the roadmap to guide where they can defend levels and where the market can go.  

ZB_06_13__60_Min___3_17_2013a.jpg

Continue reading
4602 Hits

The Ultimate Short Squeeze 665-1441 & Accurately Predicting Every Correction Using Technical Analysis


Since the all time highs of 1586.75 set October of 2007, the SP500 corrected into lows of 1255.50 early 2008 with Bear Stearns bankruptcy.  A short squeeze was seen up to 1441 in May of 2008, only to reverse and fall into lows of 1373.50.  This reversal led to a summer decline that took out the years and set up a shaky market going into the fall. As September began, the SP500 made highs of 1303.50 only to reverse and cause a spike in the Volatility Index.  This reversal ultimately led to the crash as the market fell into lows of 665.75, March of 2009.  Since this low, the market has channeled higher on glass stairs as it has gone through few major shakedowns however managed to continue the squeeze and retrace 100% of the breakdown from 1441.  Below are the corrections seen during this move.

Click charts to maximize. 

SP500 sets highs of 1216.75 before stalling to create a head/shoulder topping pattern projecting 1136.75. Ultimately seeing a flash crash with a quick move to 1056 before coming back to the 1130 level. 


2010 SP500 Head/Shoulder Topping Pattern Completes 1136.75 and sees Flash Crash to 1060s:

Continue reading
18932 Hits

Euro Completes Target Whats Next?

 6E________Daily___9_28_2011___9_7_2012.jpg

The Euro today rallied into highs of 12808, taking out the June high of 12759 and completing the inverted head/shoulder target of 12775 from the 12413 neckline made on the "draghi sale" when the market fell to retest the July lows. The buys at 12147 saw most covered before the break of the neckline.  As the market took out the neckline of 12413 runners were left to see if the Euro can complete its 12775 target. With this complete, this trade is now done. Going forward, new support comes within 12626-12503.  Next major upside resistance is met against 13082 to fill the gap from the May highs of 13287 of where the Euro failed.  

Reference: Euro's Inverted Head/Shoulder

Continue reading
2653 Hits

Bullish SP500 Patterns Hold Up, Target of New Year Highs Completes


ES________Daily___12_30_2011___8_21_2012.jpg

Today the SP500 completed its target of 1422 by the bullish patterns created during the months of May - June.  The year lows of 1259.75 held in June with lows of 1262.00 as the market double bottomed to keep the gap from last year downt o 1252.50 open, keeping the bullish momentum alive.  The market consolidated against these lows and created an inverted head/shoulder pattern with a 1342 neckline, targeting 1422.  An attempt to breakout was seen early July before the market went into another consolidation phase, creating a cup/handle pattern and retesting the 1320-1297 right shoulder.  This created another double bottom against 1420 in July and the market rallied into its upside resistance of 1385.  During the month of August the market squeezed above 1385 and held above to keep shorts trapped which led to a slow chipping away at the May highs of 1411.75.  Which this hold above 1385, shorts were forced to squeeze out, leading to this high of 1411.75 being taken out and finally giving room to take out the year high of 1419.75 and complete the target of 1422 from the 1342-1262 inverted head/shoulder.  Today as the market completed this, instant profit taking was seen as the market reversed down to 1408.  At this point a shakeout can be seen to test downside support down to 1383 with major stops below 1349. Breaking below this low derails the upside momentum to see further downside.  Going forward, as the market looks for downside support and longs who have riden this over the past few months take profits, the late comers and shorts can give the fuel for the extra 20 points to complete the final squeeze of 1441 being the May 08 highs. This completes the short squeeze from the 665.75 lows put in 2009. A squeeze of 1441 can then give room to look for a correction in the market, however will need to see if the market can stabalize or fails following the move.

ES________Weekly___Week_36_2007___Week_34_2012.jpg


Continue reading
3877 Hits

Euro's Inverted Head/Shoulder

 6E________Daily___2_8_2012___8_7_2012.jpg

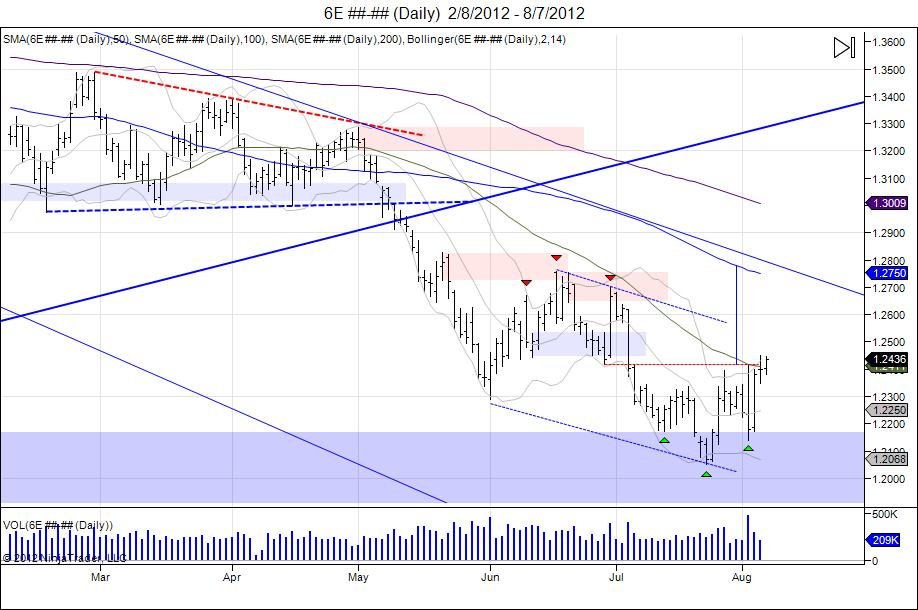
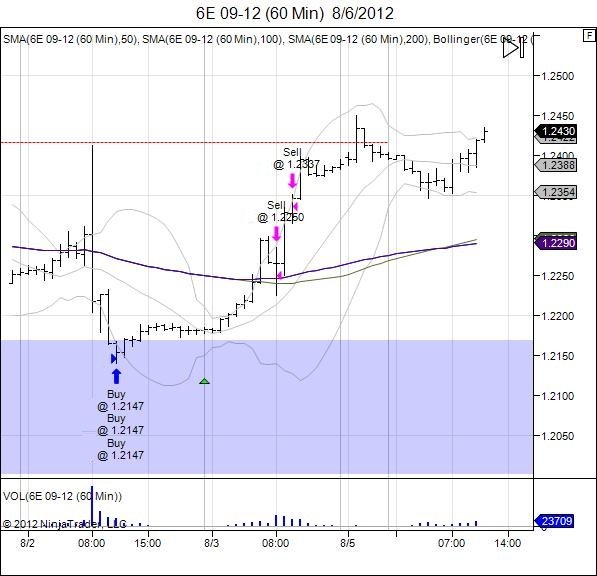
Following last Thursday's "Draghi Sale" as the Euro fell down into lows of 12140 which retested the July lows, the market has sprung back as buyers stepped up to defend this low and sellers failed to break the range. A right shoulder developed with this move and the market is back to testing its neckline of 12417.  The move in itself has given brave buyers of the Draghi sale oppurtunity to have locked in most profits and now allow runners to work as the market attempts to chip away at this neckline.  Shorts in the market are now trapped as the market failed to move lower and the squeeze against the neckline puts pressure against these shorts to cover.  Moving past this resistance gives room to continue the squeeze and use shorts as the fuel to move past the 12051-12417 range. The inverted head/shoulder targets the June highs of 12759, putting the market against its 100 day moving average as well as the top of its daily channel.  Failure to attract buyers above 12417 and a move below 12140 is needed for bears to regain control.


6E_09_12__60_Min___8_6_2012.jpg


euro.jpg


Continue reading
4906 Hits

SP500 Retraces 100%

 ES7_19.jpg


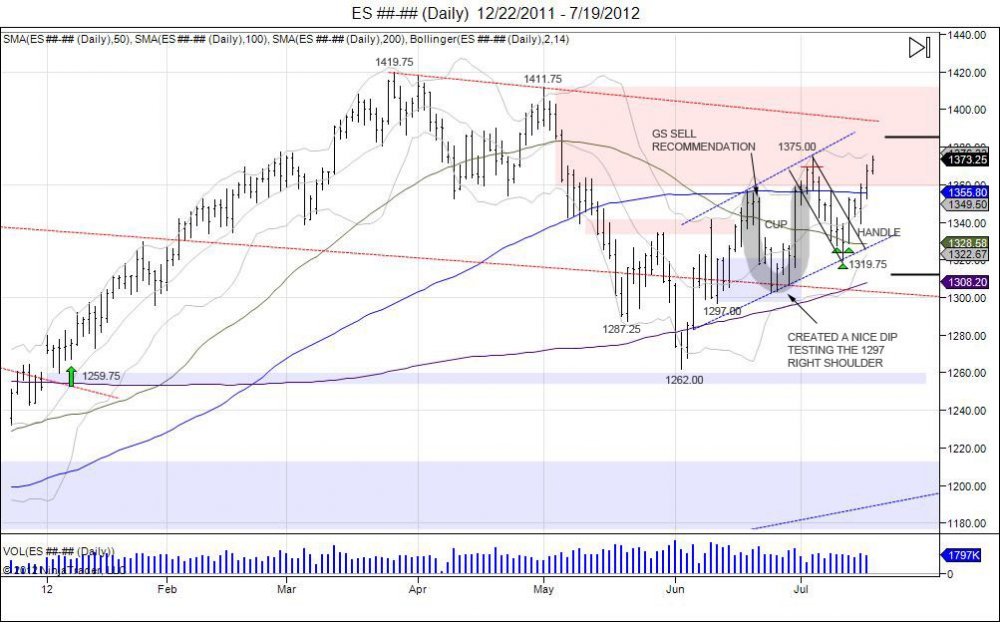
Following the 1319.75 lows made on July 12th as the market retraced lower to test its breakout point on the 29th of June, the Emini SP500 has held this level of support to break out of its handle formation off the highs of 1375. This breakout has led to a 100% retracement back to 1375 as the market has squeezed out this high.  As noted in our market update on June 26th, we believed the pullback offered buyers opportunity to defend the market as the rounded bottom in the CUP was forming, followed by our post on July 12th as the handle was being formed identifying the 1328 level as support.  With the market now at 1375, this rewards those brave buyers by giving opportunity to take money off the table as 2 of the 3 targets are complete, 1348 and 1375.  Going forward, buyers can now run positions with their stop at their entry levels at the 1328 level and let the market attempt to complete its upside target of 1422.  This move past 1375 confirms the cup/handle formation, however the next major resistance comes in at 1390 which retraces the market to where it failed at 1411.75 in May.  Rather than buying at these levels, by stepping in and buying the breakdowns seen over the past few weeks, this has rewarded runners to do the heavy lifting through these major resistance levels. Sellers will be defending 1390 at all costs as this is the last level of defense where if fails, the highs of 1411.75 will be taken out, giving room to complete the upside target of 1422 and attempt to extend into 1441 being the May 2008 highs that saw the reversal into 665.75.  Failure to push through 1390 and a move below 1319.75 derails momentum. 


Continue reading
3131 Hits

Will Bullish SP500 Patterns Hold Up? All Point To Year Highs

 es7_12.jpg


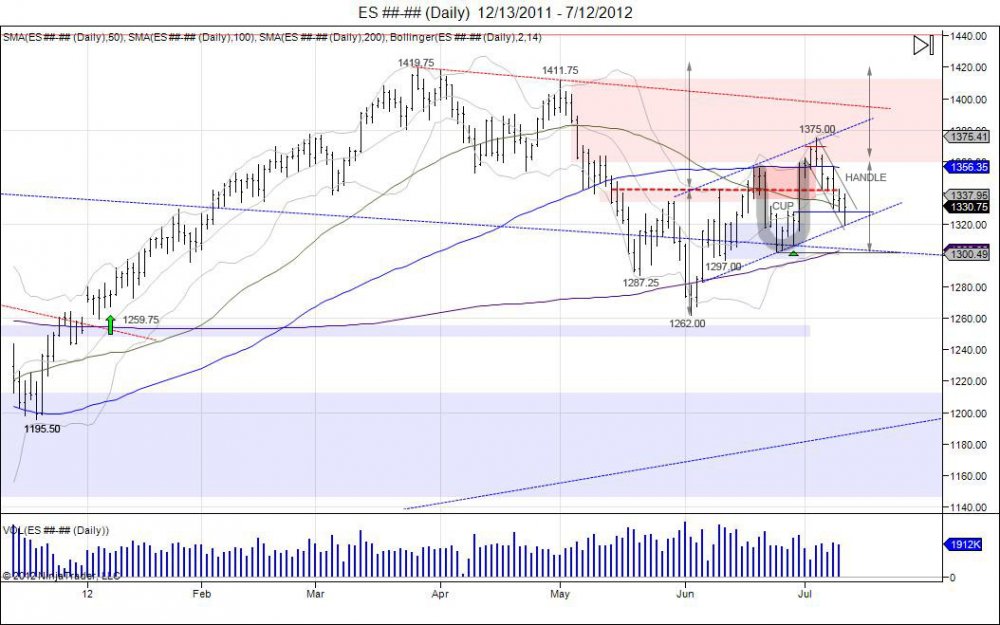
This year started out with a gap above last year's close of 1352.50, leading the market into highs of 1419.75 on March of 2012, which was met with the last level of resistance before the 1441 May 2008 highs which is the reversal that led into 665.75.  The SP500 retraced to test its year lows of 1259.75, only to hold and put in a double bottom at 1262.00 on June 4th.  Since this low failed to take out the year lows, the market bounced early June to squeeze shorts and make a 1342 high.  The market backed off this high and retested the short squeeze by pulling into lows of 1297.00 and holding to create a right shoulder of an inverted head and shoulders pattern as the market was testing its head of 1262.  With the test of the lows holding and the market turning, more shorts were caught as the market rallied through 1342 for another squeeze in attempt to break above its 1342 neckline, only to hit highs of 1357 and stutter.  The market met resistance at its 100day moving average along with the levels from where it broke down May 11th.  Following this failure to hold above the neckline the market was sold along with news from Reuters that “Goldman Sachs recommends shorting US stocks” with a 1285 target.  This news led to weak hands selling dropping the market down to 1317 off its highs of 1353 that day. This retested of the right shoulder lows of 1297 as the market hit 1302.50 on Monday, June 25th.  The following day the market tested this low with a 1303.25 low, and held to reverse and squeeze shorts running into resistance at 1330.  The market backed off this resistance level and retested Tuesday’s reversal by finding support at the open 1306.75 and once again putting in a reversal on this Thursday.  This action created a rounded bottom as the market failed to break below 1297, causing a run higher on Friday to squeeze out shorts due to the failure to break lower, retracing the market into 1375.  This action created a U turn as the market came back above 1357 which was where it broke down and rounded out to come right back into this level. Also known as a CUP.


Since the reversal seen into 1375, the market has gone into consolidation in attempt to build a handle for the cup as downside support is tested.  This handle has retraced the market down to where it reversed at 1328 from June 28th.  This is much steeper then the bulls would like and has the market pressing against this old resistance, acting as new support being the level where the market reversed higher into 1375.  On Thursday, July 12th the market shook below this level into lows of 1319.75 which hit the bottom of its rising channel from the 1283-1302.50 lows as seen above.  The market bounced off this channel and closed above 1328.  Going forward this level remains support with small stops below 1319 followed by larger stops below the CUP lows of 1302.50. A break below this low voids out the cup/handle and puts pressure to test the June lows within 1282-1262.  A close above 1342 is needed to close above these most recent highs and attempt to break out of this handle pattern to retest the premature breakout of 1357-1375.   A break above this confirms the cup/handle pattern with a target of the year highs.  Following this the next major resistance comes in at 1390 off the failed 1411 high in May. This cup/handle formation is also within the larger inverted head/shoulder formation with the left shoulder lows of 1287.25, head of 1262.00, and right shoulder of 1297.00 with a neckline of 1342.00, also targeting the year highs at 1422.  To void out this head/shoulder formation the head of 1262 must be taken out which gives room to take out the year lows of 1259.75 and fill the gap from last year at 1252.50.  So long as this gap is open, the bull is alive as a double bottom has formed by an inverted head/shoulder against the year lows which keeps pressure against sellers as the market attempts to squeeze shorts higher.  The ultimate objective above the year high is squeezing the May 2008 high of 1441 being the high the market reversed from that led into the crash down to 665.75 as seen in the weekly chart. 


Continue reading
7638 Hits

07/09/12 SP500 Intraday Action

ES________5_Min___7_10_2012.jpg

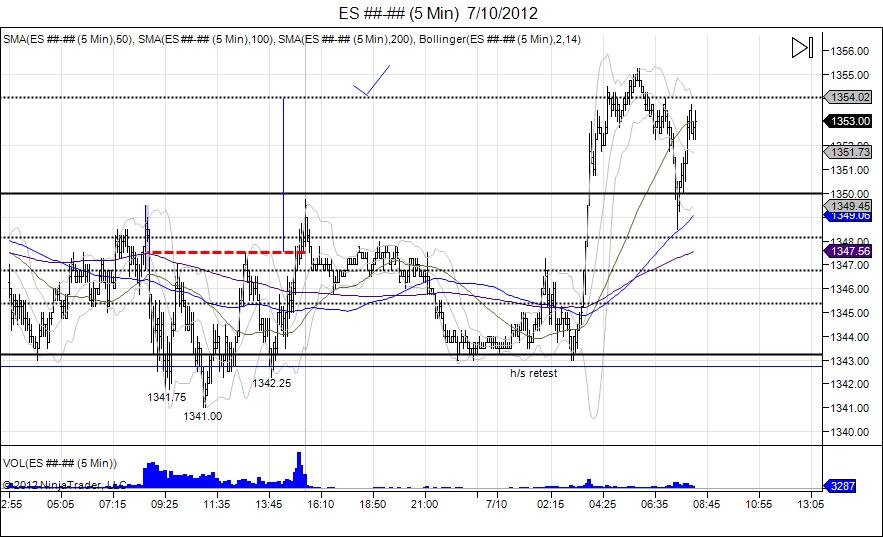
Overnight July 10, the Emini SP500 pulled in to retest its inverted head/shoulders bottom, with a 1343.00 low. The market held the head/shoulders and squeezed higher to complete the h/s target of 1353 with highs of 1355.25.


_______________________ES________5_Min___7_9_2012.jpg


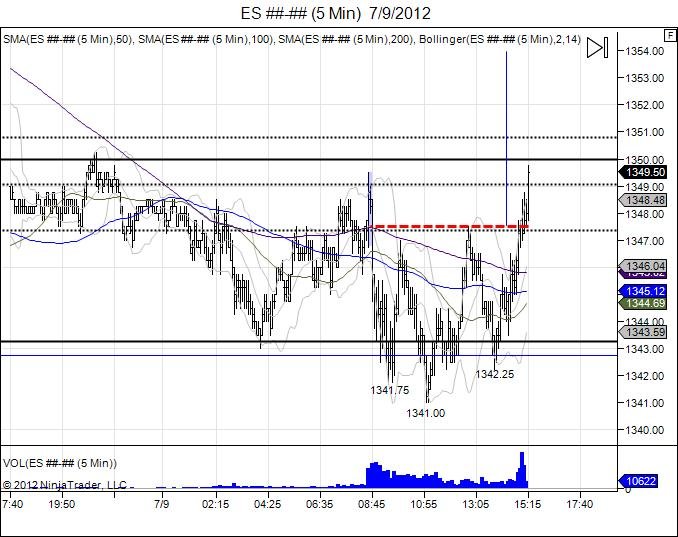
After failing to rally at the open, the market fell down to take out Friday's lows by .50 at 1341.75. A squeeze was seen following this, leading back into the opening range. First test of the opening range met more sellers and the market was seen moving back down into new lows at 1341.00.  Another hold and reversal at this level the market turns back to where it failed previously (1347) and puts in a high of 1347.50, once again meeting sellers at the opening range and not able to hold up.  Another push down was seen, retesting the lows by falling to 1342.25 as the test of 1341.00 was defended by buyers, in turn building a right shoulder for an inverted head/shoulders pattern.  This defense led to another squeeze higher, this time since the low was retested, the market found enough strength to squeeze through its neckline of 1347.50 and put in a new session high of 1349.75 before settling at 1349.50. Today was all about attracting sellers below 1343 and squeezing out longs as the market had 3 bounces off these levels. It was not an easy day being a bull eitheir as the bias for today was bearish, however in the end, the bull squeezed out a new session high. 


Continue reading
2967 Hits

SP500 Plays Out

 ES________Daily___12_23_2011___6_29_2012.jpg


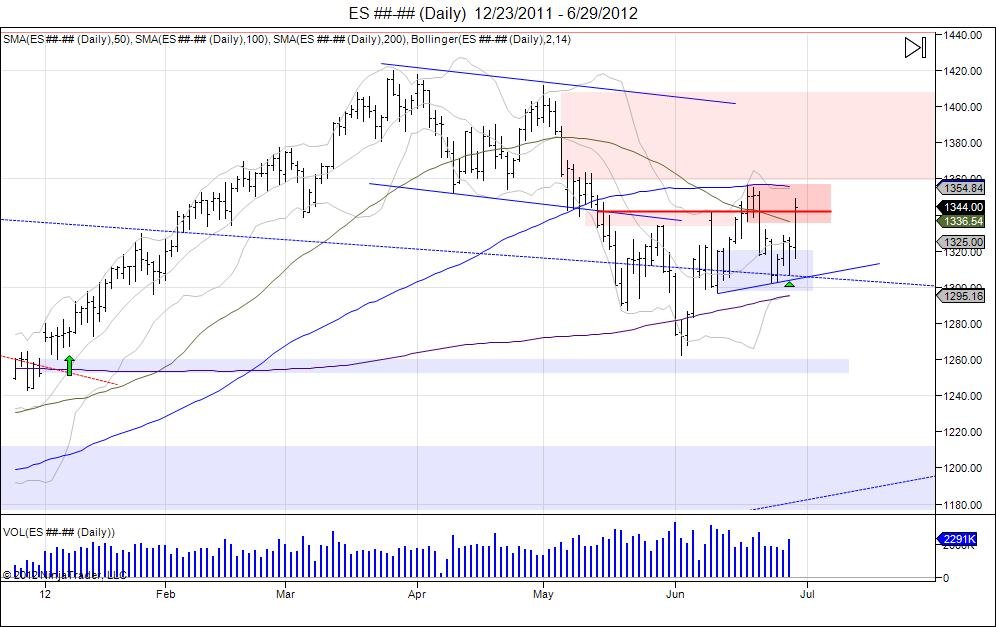
Earlier this week we saw the market fall into retesting its right shoulder down to 1297 following last week's failed breakout above 1342. On Monday the market put in lows of 1302.50, retested on Tuesday at 1303.25, and with the hold, Tuesday brought forth a reversal that led to 1328.50, testing last Friday's resistance. This led to a pullback on Thursday, retesting Tuesday's reversal as the market fell into Tuesday's open of 1306.75 and turned this number into the exact low on Thursday. Once again Tuesday's levels were heavily defended and we are seeing the market do another reversal higher, trading back through 1342 and now retesting last week's failure of 1336.50-1357.00.  As noted on Tuesday in our market update- "We believe this pullback offers opportunity for buyers to step up and trade the long side, scaling out against upside resistance levels and adjusting stops accordingly."  This move gives oppurtunity for these brave buyers who stepped up this week defending the inverted right shoulder down to 1297, to take some profits against these resistance levels.  The market is yet to be fixed, however now must work through 1357 to continue the upside momentum and attempt to trade up to 1391, which retraces and retests where the market failed on May 1st. Ultimately the 1342-1262 inverted h/s targets 1422, giving room for new highs for the year, however we still have the May 2008 highs of 1441 to clip.  Going forward a breach below 1302.50-1297.00 is needed to negate this formation and give room to retest the 1262 lows.


Continue reading
1304 Hits

SP500 Market Update

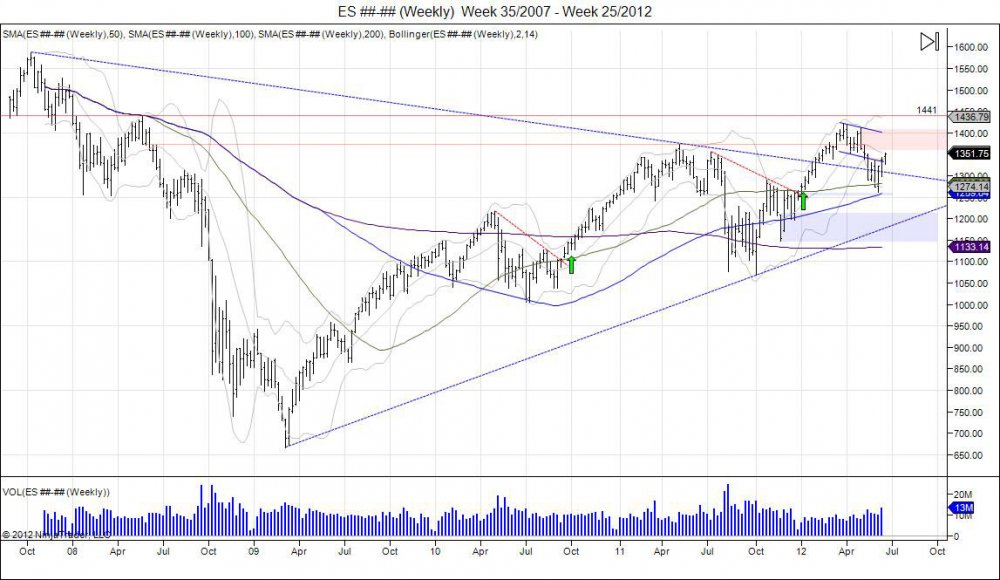
 ES________Daily___12_16_2011___6_19_2012.jpg

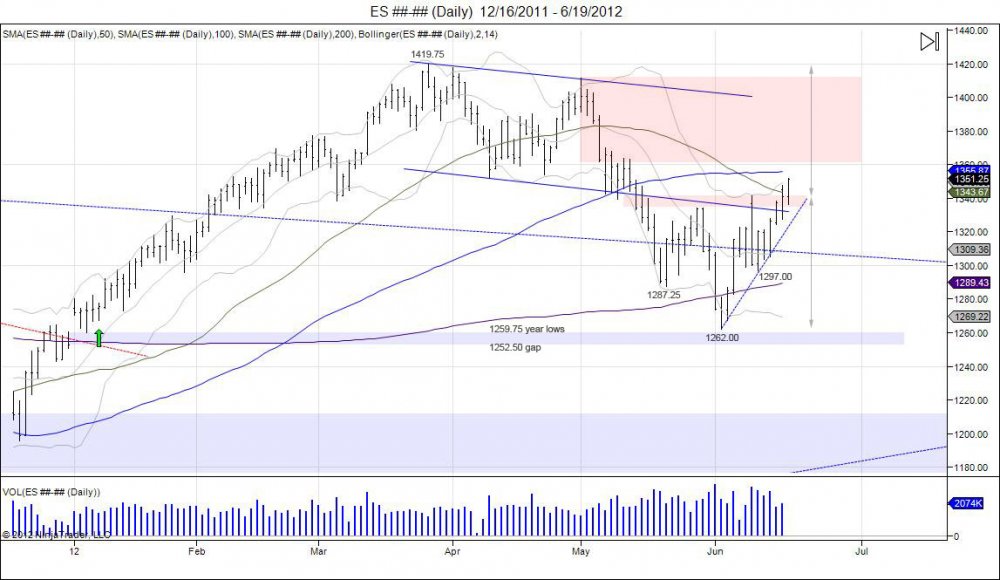
The SP500 is back at trading the levels from where it broke down early May around 1350.  The market broke its channel at that point and fell into lows of 1287.25 May 21st, before seeing a small bounce that failed to regain the broken channel and was pushed back down to a new low.  Lows of 1362 were made, holding the year lows of 1259.75, and keeping the gap from last year down to 1352.50 OPEN.  This caught another bounce into 1342 on June 11th which was followed by another pullback that retested the lows.  The market came down to 1297.00 and found support, in turn building a right shoulder as it retested the 1262 low and has built an inverted h/s formation.  Since this right shoulder low the market has grinded higher and is now trading through its neckline of 1342, putting the market back within the channel it broke early May.  Taking this range of 1342-1262 gives us a range of 80 handles, adding this to the neckline of 1342 sees an upside target of 1422 which targets the year highs of 1419.75.  Recalling the upside target of 1441 being the May 2008 highs, the market stopped right at its last level of defense against this high which put in the highs this year at 1419.75.  We went into correction off the level and retested the lows of the year, however keeping the gap open has kept the potential to retake 1441 still there.  With a new target of 1422 now the market is working its way through heavy resistance and sellers. Doing so will give room to finally complete that May 08 high of 1441.  The bounce here is retracing the market to where it failed in May, so this will be an uphill battle as it comes back to where we failed within 1361-1411.75 as the range for sellers to defend. Failing to continue this move higher and falling back below 1297 puts the lows of 1262 in sight followed by the year lows of 1259.75 and the gap of 1252.50 to derail this bull.

ES________Weekly___Week_35_2007___Week_25_2012.jpg


Continue reading
3435 Hits

Crude Oil's Bull Flag

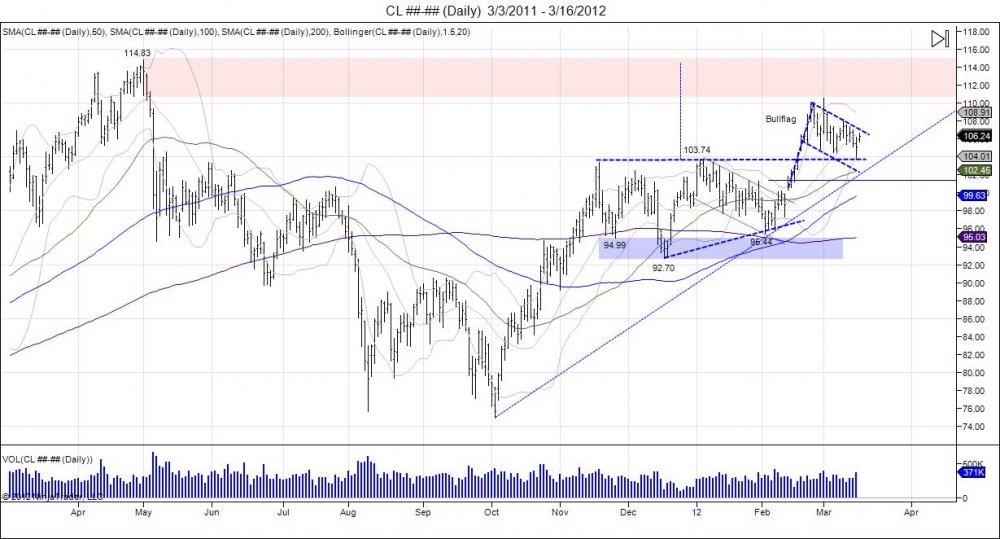
 CL________Daily___3_3_2011___3_16_2012.jpg

click chart to maximize

more...

Continue reading
3165 Hits

Crude oil $107 - "Will not let the price of oil go more then $100"

February 6, 2012, Prince Alwalweed of Saudi Arabia with Maria Bartiromo of CNBC - "Saudi Arabia went public by saying we will not let the price of oil go more then $100. Which means we can use our leverage, our excess capacity to be sure to pump more if needed, to be sure to have it not go over $100, so we will not impact and affect the consumer countries while they're getting out of the economy of the recession slowly but surely, hopefully."

Source: CNBC

more...

Continue reading
4347 Hits

SP500 Video @ Nasdaq with notes

Click chart below to maximize.                                                        

  more...

Continue reading
9647 Hits