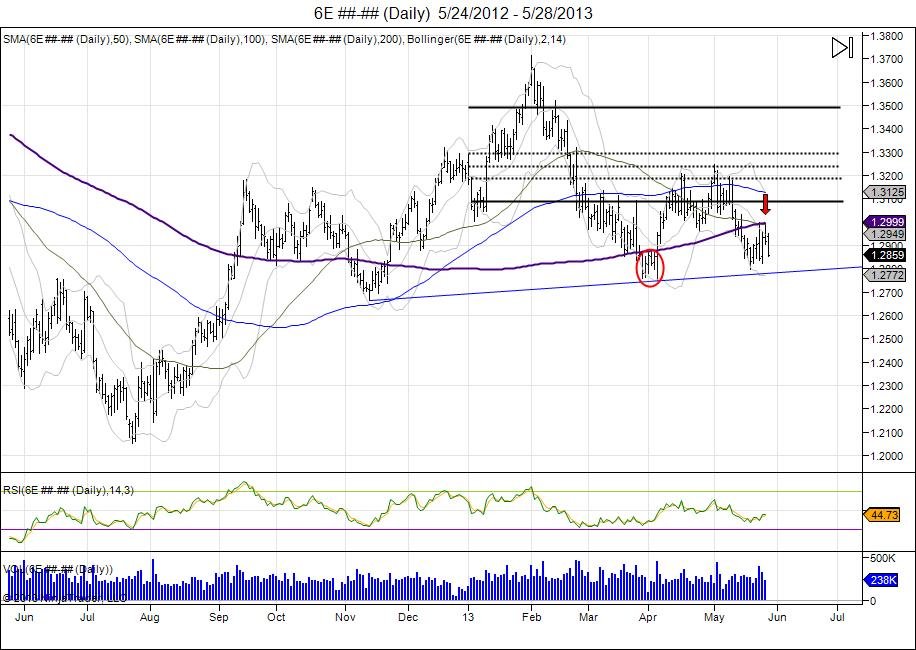
The Euro has closed below its 200day moving average 9 days now since breaking below in May. This comes after an initial attempt to break the average in April was followed by a reversal off new year lows of 12751 that closed the market above the 200day. This turned the break of this average premature and caught shorts below trapped as the market ran into 13200 to run stops from March. Since then, the Euro topped on the 1st trading day of May at 13248, as the 200day moving average slowly caught up to make a tight range. With the failure to hold the pivot low of 12959 from April 24th, the Euro broke its 200day moving average, and this time around the market is getting comfortable under this level by slowly turning the average which is strong support, into new resistance. This was seen last week as the market spiked up to 130, touching the bottom of the 200day, however failing. This consolidation pattern has created a bear flag as a tug of war is taking place by turning the 200day average into resistance, and working to gather strength to break the April lows. With this, the 50 day moving average has also began to cross the 200day average, also known as a "death cross". Breach of April lows confirms the bear in the Euro which should continue to find its 200day average weigh down to attempt a retrace into 124 which is where the market broke out last year. 12906-13000 offers new area of resistance for this momentum, followed by 13075-13200.
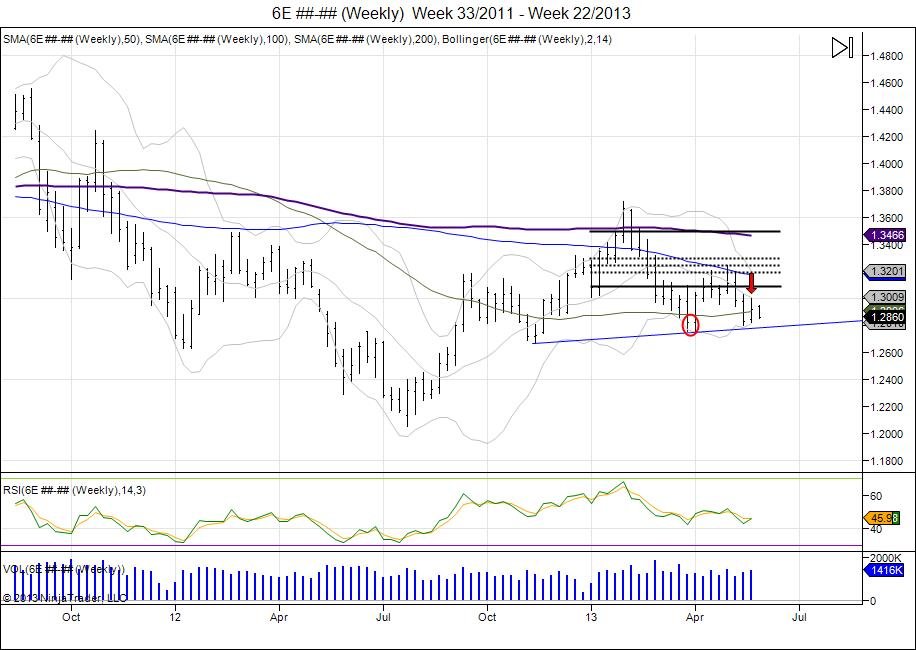
The weekly Euro chart shows a different picture. With last week's attempt at the 200day on the daily chart with highs of 130, shows the market held below its prior weekly high and closed below the prior weekly open, to establish an "inside" week. This has led to continued weakness as this week has began, in attempt for sellers to target last week's low of 12822. Closing below this low on the weekly confirms downside to target the rising trend line for stops and eventually the November lows at 12665.


 12_10_2010 - 1_27_2012.jpg)