Chicagostock Trading

Chicagostock Trading

2016 Top 5 Trends

In no particular order, here were the top 5 major market changing trends of 2016 identified by Chicagostock:

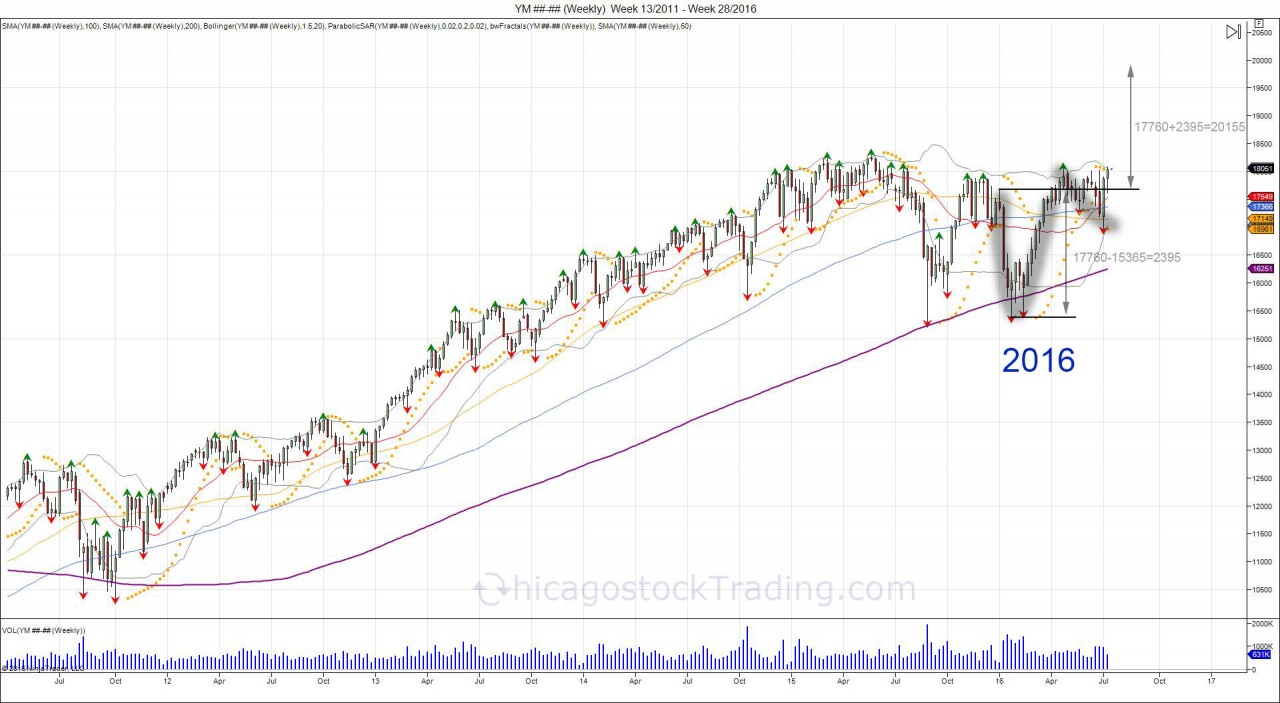
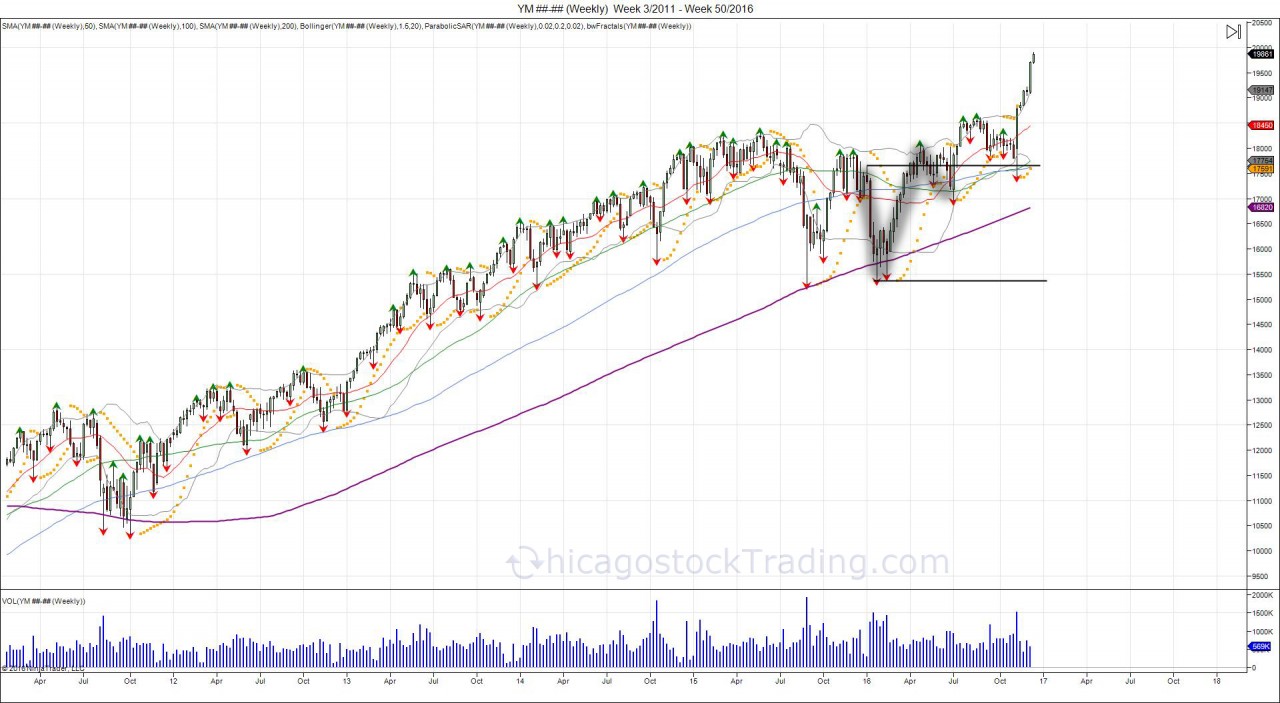
1- DOW JONES CUP/HANDLE TARGET 20K
The stock market started 2016 weak, however recovered the highs of the year by summer, making a U turn. Those that were caught short, bearish, and wrong, were now forced to reverse position, thus creating the cup/handle formation, giving way to expand the U turn up to 20k.
Continue reading
3863 Hits

How Oil Ripped the Face off Shorts

Let's take a look at how the oil short squeeze took place.  In February, oil broke the January low of 2756, falling to 2605 on February 11th.  Just as oil was testing and ready to break 26, the UAE Energy minister came out with remarks that they were willing to cooperate on production cuts.  This instantly reversed the market off the lows to see it recover 30 in the coming days.  Dubbing this the "OPEC put" as it clearly showed members of the organization were attempting to defend 26.  

The move, setup a failed breakdown, leaving shorts below 30 trapped:

Tags:
Continue reading
5248 Hits

Oil's Target via T/A


A few weeks ago, before starting October, crude oil was sitting back at its 2014 lows of 9124, after rallying up to 10768, only to fail the retest of the 2013 summer highs.  This failure, and upside down U turn, led to a small consolidation period as short covering and new buyers materialized to put in a tug of war.  The 2014 reversal of 9124-10768 has a 1644 range.  Taking this range and subtracting it from 9124, this gives downside objective of 7480 to complete the expansion.  This takes place as the market made a technical reversal for the year of 2014 and failed to hold 91, seeing a flush, and expansion of the 2014 range, in the opposite direction. First level of major support is seen at 8090 with sell stops under 7728 to complete 7480 objective. Short term this support level offers an area for shorts to cover and buyers to look to defend, for a move back to retest 84-88 resistance, up to 91.  Failure to hold 7728 gives way to complete 7480 expansion target, which takes out the 2011 7495 low. 


Tags:
Continue reading
4271 Hits

Crude Oil's Short Squeeze Trade

 05_22_jpg.jpg


Recall last week, just before the POTUS national address, crude oil fell into new lows for the year by 2 cents at 9122. The next day after the address, oil fell further down into 9043 before turning into a short squeeze as shorts began to cover their positions, sending the market back above into highs of  9344.

On September 10th, we wrote "With the Presidential address tonight highlighting need to attack ISIS, this gives bulls their last hope for a short squeeze/rally."

"Buyers must step in here to reverse through 9400 in order to trap shorts and attempt a short squeeze through 9600 to test next major resistance into 99-102."

In the above daily chart, the market shows the pierce of the 9124 lows on the 11th and the move up to 9367.  Today, the market retested those lows, allowing sellers opportunity to continue as well as buyers an area to defend.  The retest of last week's lows saw sellers fail to push through; showing some exhaustion on their part, as well as seeing buyers defend the retest.  This has thus far led to a squeeze back to the 9300 level allowing aggressive buyers opportunity to scale out. 


05_22_jpg.jpg

Weekly chart shows clearly defined downward channel in CL from the failed retest of the 2013 highs in June of this year.  This week the weekly bar is seen pulling into retest last week's low and finding a bid. Small short covering as the market breached the 2014 lows and an attempt to create a failed break down under the January lows.  Buyers must look to recover and close above last week's high of 9394 to attempt a trap under the level and look to target 9600 for stops and a retest of the broken trend line from last year's lows with room to retest the broken 6 month vol window up to 10080.  Short term resistance met into 9280, squeeze through 9367 confirms Monday's lows as a successful test of last week's low.  New downside support based off Monday's cash session down to 9175 with sell stops below 9117.  Failure to hold the year lows and get through 9400 gives next major support into 8880.

Tags:
Continue reading
3362 Hits

Crude Oil's New 2014 Low and Key Levels

 05_22_jpg.jpg


Crude oil made new lows for the year by 2 cents on Wednesday at 9122.  This is the third time the market has tested this level, June 2013, January 2014, and now.  To start this year, the market took out last December's low and turned the breakdown into a failure to go into a short squeeze leading up to 10754.  This was crude's second chance to retest last year's failed highs of 11224 as it tried to break through its weekly pennant to the upside.  The retest rejected with the highs being placed in June and the second half of the year July, beginning the liquidation lower.  The move down has been relentless as the market has been driven down below its weekly pennant and broken its trendline from the 2012 lows.  Short term, buyers must hold this new low by 2 cents at 9122 and look for a move through 93 in attempt for a short squeeze to retest 9400.  Failure to hold 9120 gives room into next major support at 8880. With the Presidential address tonight highlighting need to attack ISIS, this gives bulls their last hope for a short squeeze/rally.  ISIS continues to sell crude at deep discounts on the black market. 


Weekly chart on crude oil shows a clearer picture of the failed retest and reversal below the 2014 lows.  Buyers must step in here to reverse through 9400 in order to trap shorts and attempt a short squeeze through 9600 to test next major resistance into 99-102.  Next major sell stops in the market are below 8590 from April of 2013, which gives room down to major support at 8080 with sell stops below 7728 as the June 2012 lows.  Since the trend line from these lows was taken out, a pullback down to retest these lows at 8100 would offer buyers a strong level to attempt a bounce.  As July goes so does the second half of the year. 


Tags:
Continue reading
3898 Hits

DAYTRADING SP500, CRUDE, GOLD WITH CHICAGOSTOCK MONDAY 04/28/14

1-8-12b_1.jpg

1-8-12b_1.jpg


1-8-12b_1.jpg

Continue reading
910 Hits

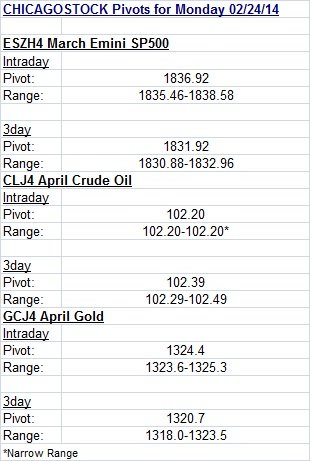
Trading Pivots


Pivots are used to determine areas of reference for support/resistance.  Pivots are calculated by adding the high, low, and close of the determined time period, and subtracting by 3.  This gives a "mean" of the market from that past data. Pivots themselves are not always enough. By adding ranges to the pivot (above and below), this gives an area of cushion around the pivot.  The tighter the range, the more indecisive the previous data was, giving room for expansion of volatility.  In the above examples, the intraday pivots are derived from the previous day's session.  The three day pivots are derived from the last 3 trading sessions.

Continue reading
4447 Hits

Reversals of the Year

 dx3_1.jpg

Continue reading
3757 Hits

Major USD Reversal No One is Talking About


US DOLLAR:

DX2_25.jpg

The US dollar is one of the most important, yet least discussed chart of the year.  Noticing the dollar's break below 79600 late January, early February, only to establish a bearish bias and lure in shorts before turning around higher. The market has held above its reversal window, thus reversing the bearish bias which has led the market to take out its year highs of 8100 set early January.  This U turn is having a major effect and pressure on commodity markets as the USD failed to break lower and is trading on new highs for the year. Take note of the gold chart how it is completely opposite of the dollar chart and is an upside down "U" from the beginning of the year.


ES________Daily___3_14_2012___2_25_2013.jpg


Click charts to maximize

Continue reading
3066 Hits

UPDATE SP500, Crude Oil, Gold

SP500 120 MINUTE:ES________120_Min___2_13_2013.jpg


OIL 120 MINUTE: 

CL________120_Min___2_13_2013.jpg

Continue reading
881 Hits

SP500/Crude Oil Chart UPDATES

OIL HOURLY: CL________60_Min___2_4_2013.jpg


SP500 HOURLY:

ES________60_Min___2_4_2013.jpg


SP500 DAILY: 

ES________Daily___3_14_2012___2_4_2013.jpg

Click charts to maximize.

Continue reading
1209 Hits

Oil and Transports TRADING TOGETHER?

CL________Weekly___Week_4_2011___Week_39_2012.jpg

IYT__Weekly___Week_4_2011___Week_39_2012.jpg

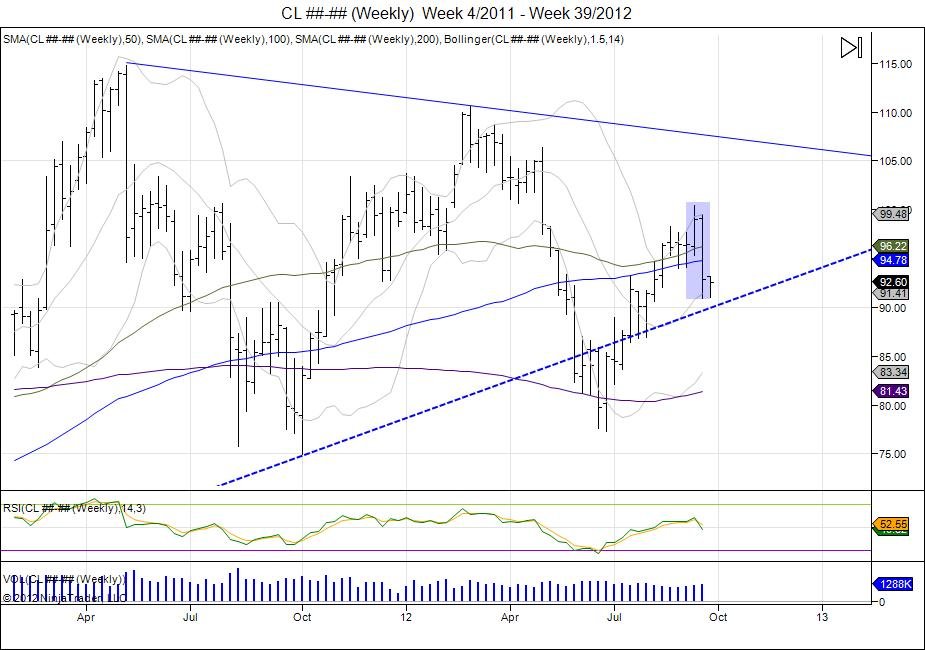
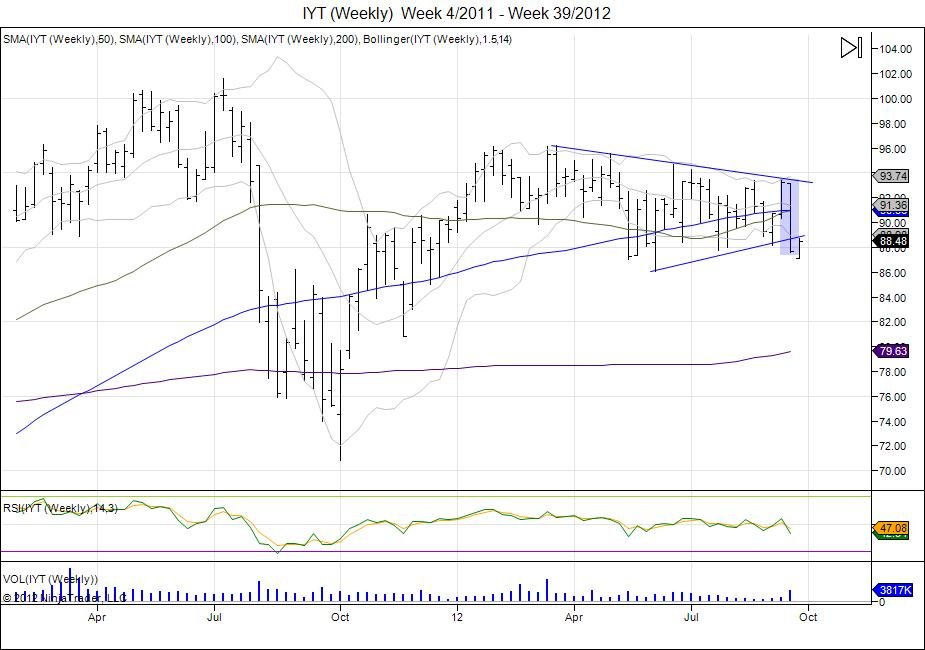
Here is a question... Shouldn't falling oil prices be a positive for the transportation sector?  Looking at the weekly crude oil chart above along with the weekly transportation index fund chart, what do we notice? Both oil and the transports traded exactly the same the past 2 weeks as highlighted in blue.  Crude oil made a high of 100.42, failing to break out and seeing a quick reversal the following week to take out the lows made the prior week.  The transportation index made a high of 9349 and also saw a quick reversal the next week to take out the lows made the prior week. In theory, a weaker oil market should be supportive to the transportation index and the weakness in this sector should not have been as strong. Only we are now living in a QE world and these assets are trading as risk on and risk off.  The weakness and similarities should be noted, as this may be giving a bigger picture of what is going on in the economy, and why the Fed continued with quantitative easing. Going forward, the range from the week these markets made these highs is new resistance needed to breach to move higher.


Continue reading
2541 Hits

Oil moves up $16 off lows, pays 27k


CL________Weekly___Week_48_2008___Week_33_2012.jpg

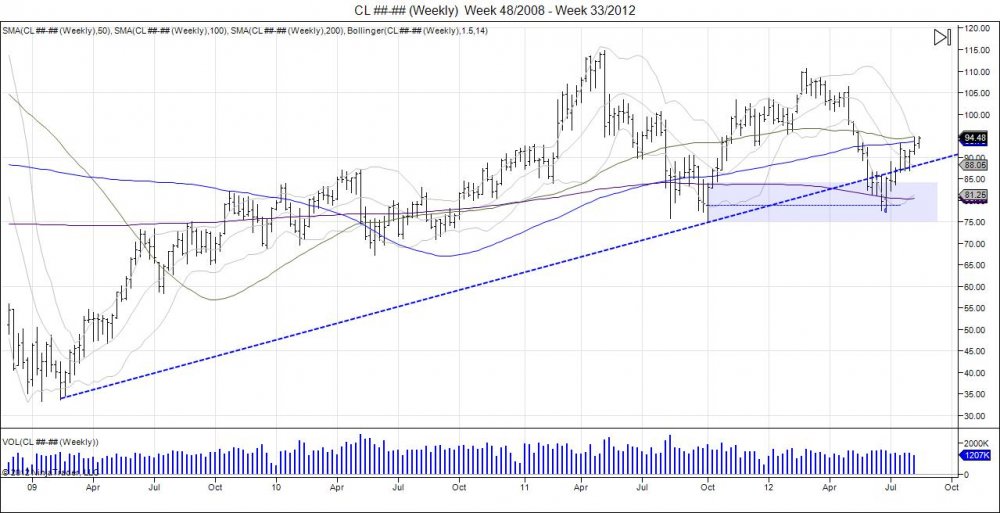
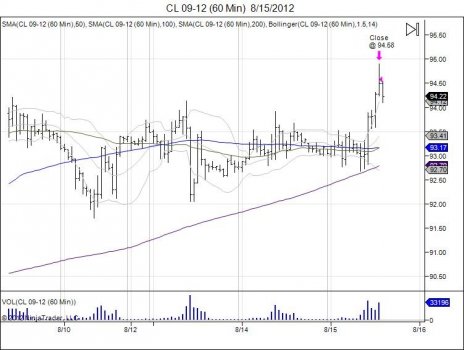
September crude oil contract ran up to highs of 94.90 today with only 5 days remaining for the contract to trade with it's expiration nearing on August 20th.  The move approaches the 9750 target which retraces the market to where it failed May of this year.  With the contract having to go into another roll and only $3 shy of its upside target, it is good enough to finally close out the runner position from 7840.  This contract already had to go through a roll from August into September and with the close of September, the two contracts combined have paid a total of 15.87 on this runner position. More then the first two targets combined which netted 11.35.  There was no risk on the runner after taking profits on targets 1 and 2 and allowing the 3rd to run with a stop at entry, however the trade has completed for a total of $27.22.  

Going forward, 9750-10643 is a major area of resistance for crude oil to work through.  Moving past this range retraces the market to where it failed in May, making a U turn on the weekly chart, where at this point consolidation would need to be seen to build a base and target the year highs above 110.  Until then this is speculation and we need to see the market trade through this major resistance range of 9750-10643. Downside support is seen 8936-8684 and down to 8530.


CL_09_12__60_Min___8_15_2012.jpg


Reference: How We Played Crude

Continue reading
3026 Hits

How We Played Crude


07/03/12 Update:CL_08_12__60_Min___7_3_2012.jpg 

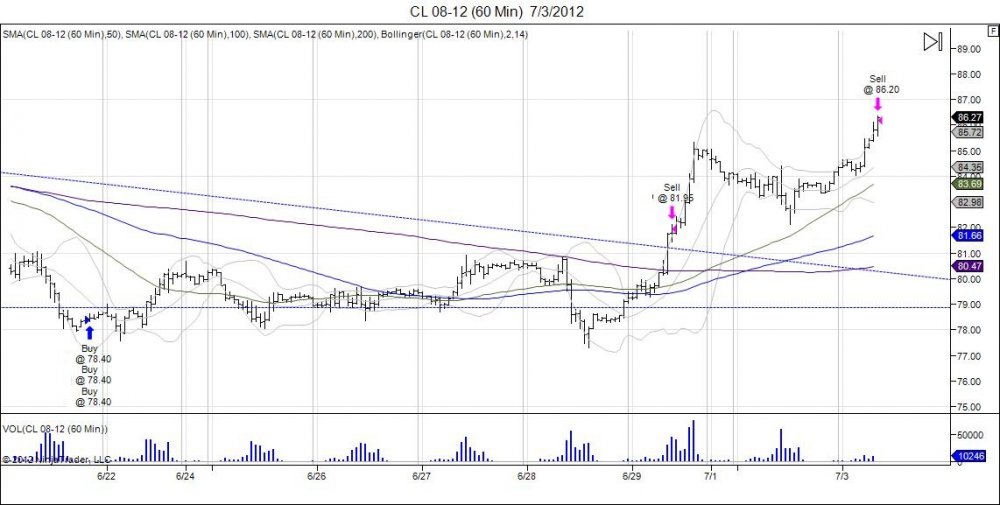
Crude reached its 2nd target of 8640, currently trading 8660s. 2/3 of trade is out.  Total locked $11.35. Next resistance 9020-9220, target on runner = 9750. This runner target will add $19.10 if completed.


_________________________________


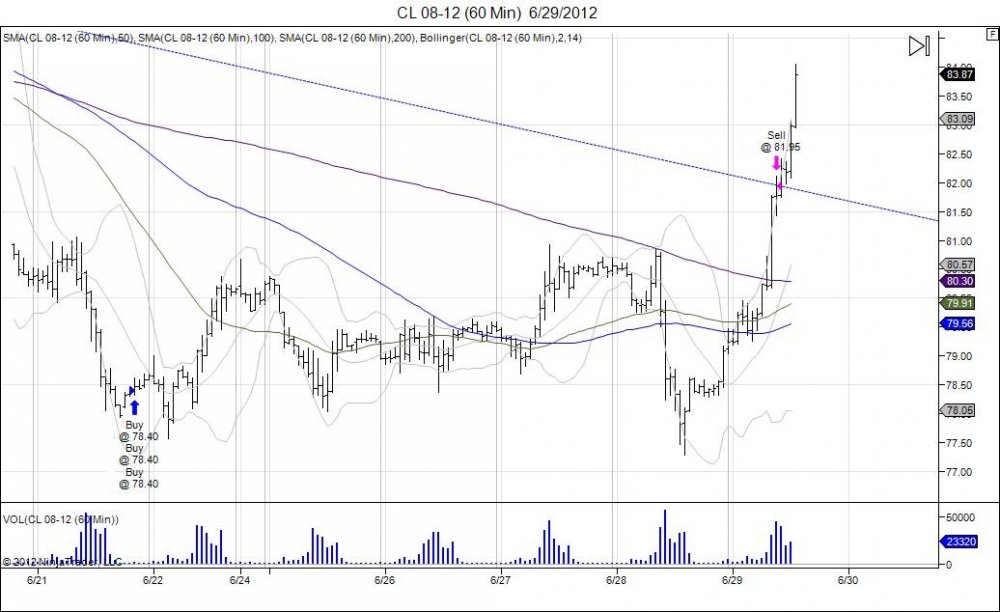
CL_08_12__60_Min___6_29_2012.jpg

It was no easy task holding crude long this week. After attempting to breakout at 8092, the market failed on Thursday and a shakedown was seen squeezing out weak hands as the market fell into new lows for the week at 7728. Wiping paper gains. Sure enough this breakdown turned into a failed one as the market has reversed through Thursday's failed highs of 8084, completing the first upside target of 8240. Having taken some heat, we locked in target one at 8195 with no complaints. The market has confirmed the long side direction following Thursday's failed breakdown by this reversal, and we are seeing that today with the squeeze higher as shorts are forced to cover and longs who were squeezed out are forced to chase the market higher.  To continue higher, downside support is now seen down to 8090. Next upside targets come in at 8640 and 9750. 8474-8589 offers next major resistance, followed by 9750 which retraces the market to where it broke down the first week of May off highs of 106.43.

Continue reading
3685 Hits

Crude Oil Charts

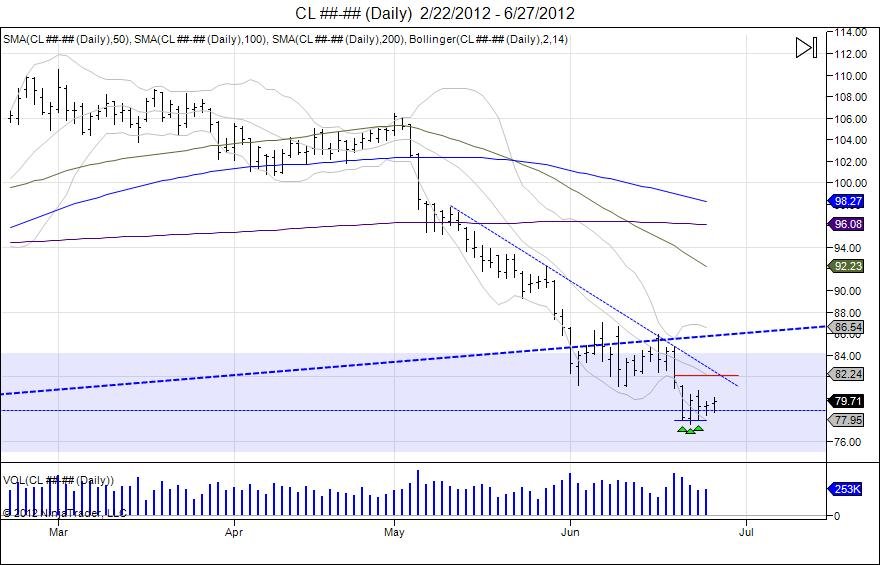
 CL________Daily___2_22_2012___6_27_2012.jpg


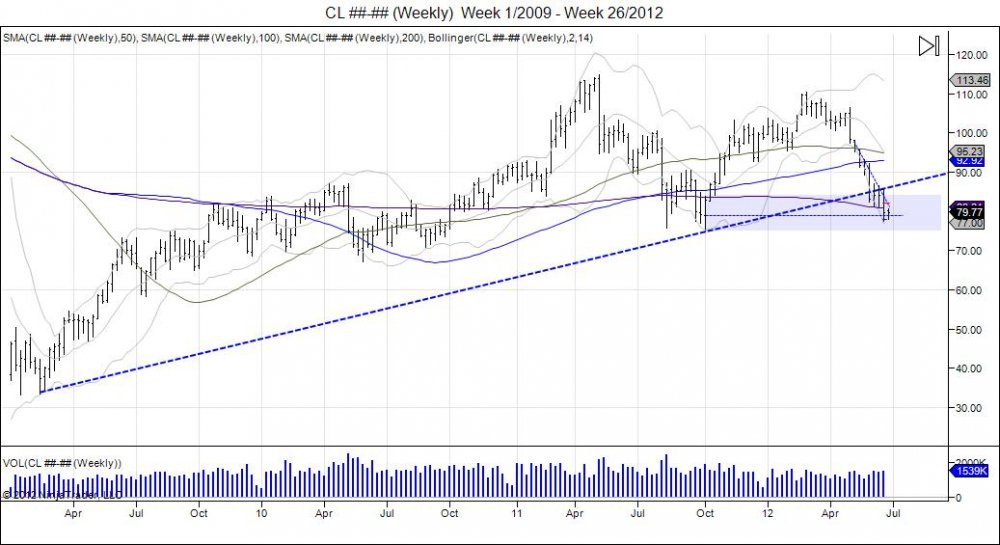
CL________Weekly___Week_1_2009___Week_26_2012.jpg

Tags:
Continue reading
2930 Hits

Crude Oil's Bull Flag

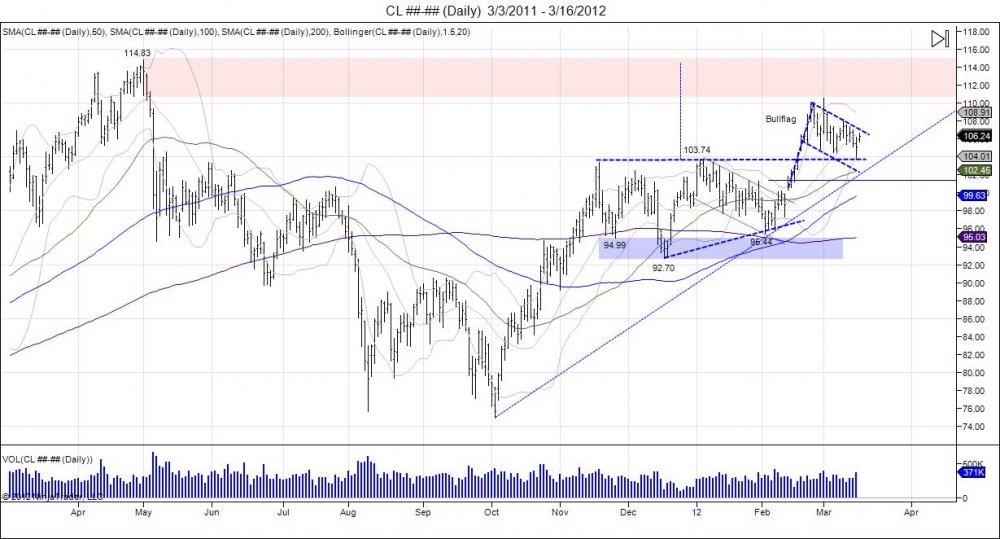
 CL________Daily___3_3_2011___3_16_2012.jpg

click chart to maximize

more...

Continue reading
3165 Hits

Crude oil $107 - "Will not let the price of oil go more then $100"

February 6, 2012, Prince Alwalweed of Saudi Arabia with Maria Bartiromo of CNBC - "Saudi Arabia went public by saying we will not let the price of oil go more then $100. Which means we can use our leverage, our excess capacity to be sure to pump more if needed, to be sure to have it not go over $100, so we will not impact and affect the consumer countries while they're getting out of the economy of the recession slowly but surely, hopefully."

Source: CNBC

more...

Continue reading
4347 Hits