Chicagostock Trading

Chicagostock Trading

Is This the Top?

Last week, we highlighted the inverted head/shoulder technical pattern that was created after the market made new lows for the month in November and caught new shorts on the hook.  This inverted head/shoulder pattern, gave room to expand the market above the neckline of 258950 up to 262350.  The target was met on November 28th, with the market hitting a high of 2627.  


Continue reading
3687 Hits

Technical Analysis Right Before Your Eyes

Continue reading
3852 Hits

Pre NFP Market Update, SP500, Bonds, Midcaps, Yen

Futures, foreign currency and options trading contains substantial risk and is not for every investor. An investor could potentially lose all or more than the initial investment. Risk capital is money that can be lost without jeopardizing ones financial security or lifestyle. Only risk capital should be used for trading and only those with sufficient risk capital should consider trading. Past performance is not necessarily indicative of future results. Video content hosted by third party.


Continue reading
4040 Hits

Pre NFP Market Update Video


Futures, foreign currency and options trading contains substantial risk and is not for every investor. An investor could potentially lose all or more than the initial investment. Risk capital is money that can be lost without jeopardizing ones financial security or lifestyle. Only risk capital should be used for trading and only those with sufficient risk capital should consider trading. Past performance is not necessarily indicative of future results. Video content hosted by third party.

Continue reading
2768 Hits

CAPITULATION LEVELS

Nasdaq futures are staging the ultimate retest as the market is now 500 points from testing major resistance of where the market failed during the dot com bubble. By taking the low of the last major correction at 281775 (May 2013), using the January high of 362525, and the last recent low of 3412 made February of this year as the market’s attempted to breakdown only to fail, this gives upside fib extension levels of where the market can lead to. Thus far we have seen the market extend 38.2% at 3724, being where and what the market is working on now. Continuation of holding above the early 2014 high of 3635, this gives room to continue the squeeze higher as shorts capitulate. A 50% fib extension is met at 3821, followed by 3858 to complete the range expansion from 3635-3412 up to 3858. MAJOR resistance is met within 3900-4230 as the top level of the fib extension, being a 100% extension of the failed breakdown this year from last year’s move up. The first test of this range, should be sold with both hands forward, as this is the first test of the dot com bubble.


Continue reading
4016 Hits

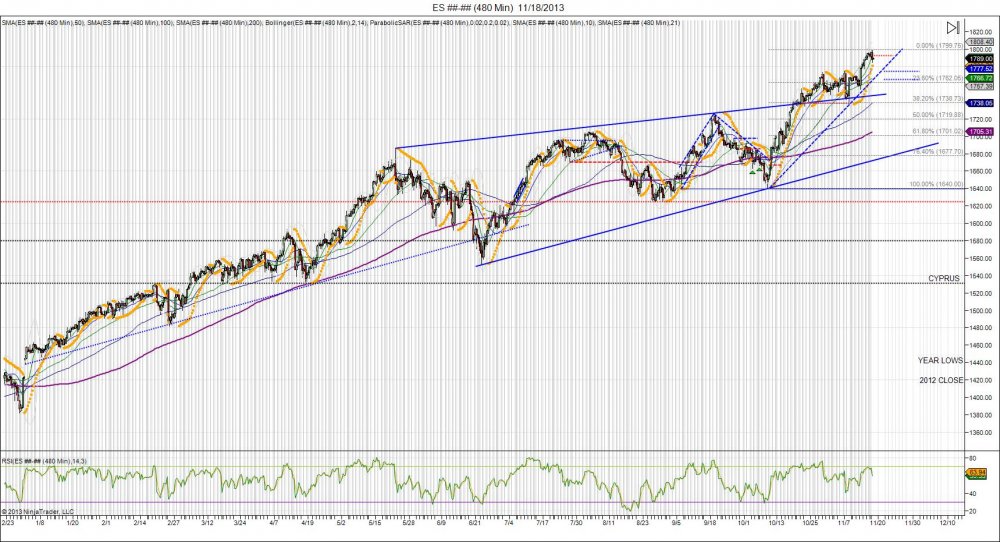
DAILY EQUITY CHARTS FOR NOV 18 2013

(click chart to maximize)

1-8-12b_1.jpg

Continue reading
2862 Hits

SP500, Nasdaq, Midcap Daily Charts

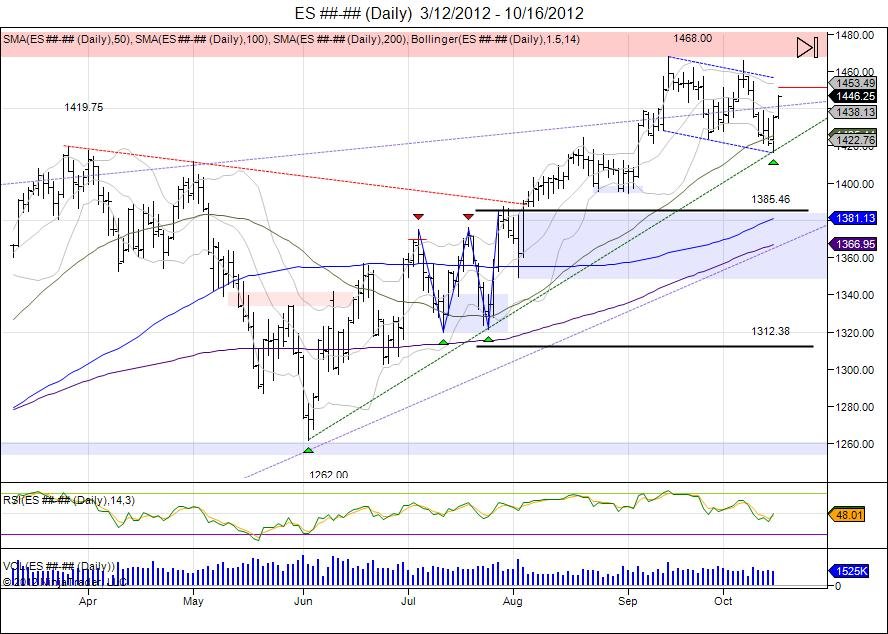
 ES________Daily___3_12_2012___10_16_2012.jpg


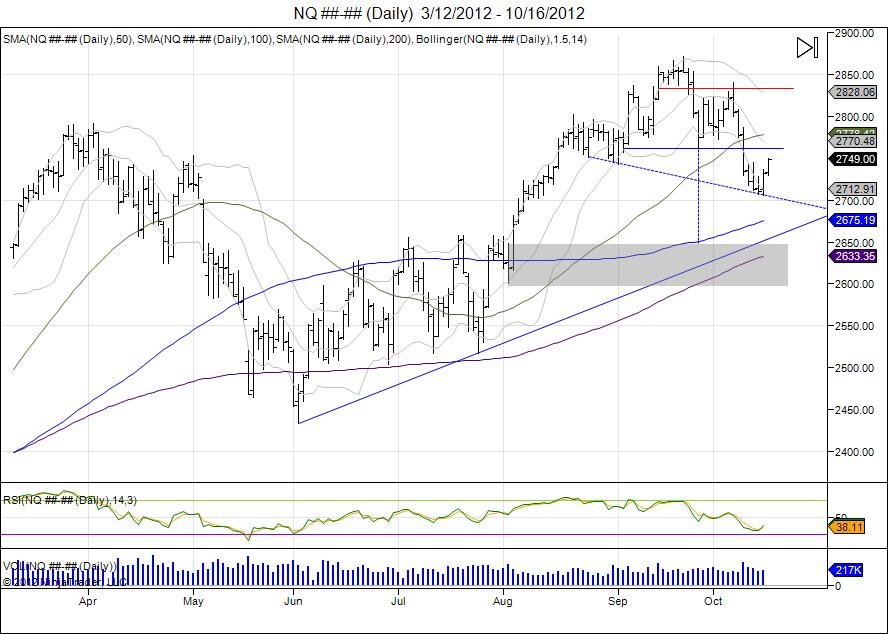
NQ________Daily___3_12_2012___10_16_2012.jpg


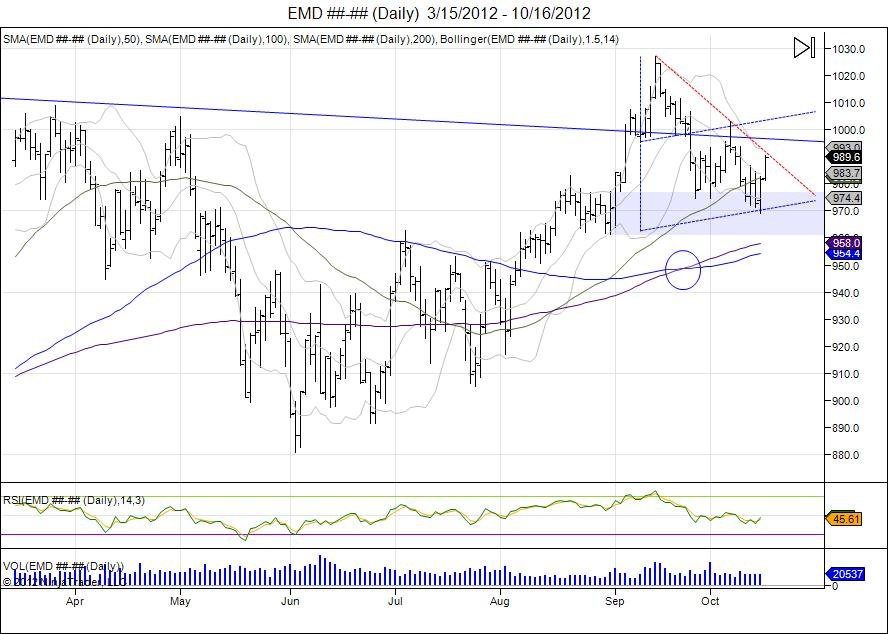
EMD________Daily___3_15_2012___10_16_2012.jpg

Continue reading
3755 Hits

SP500 Chart Analysis

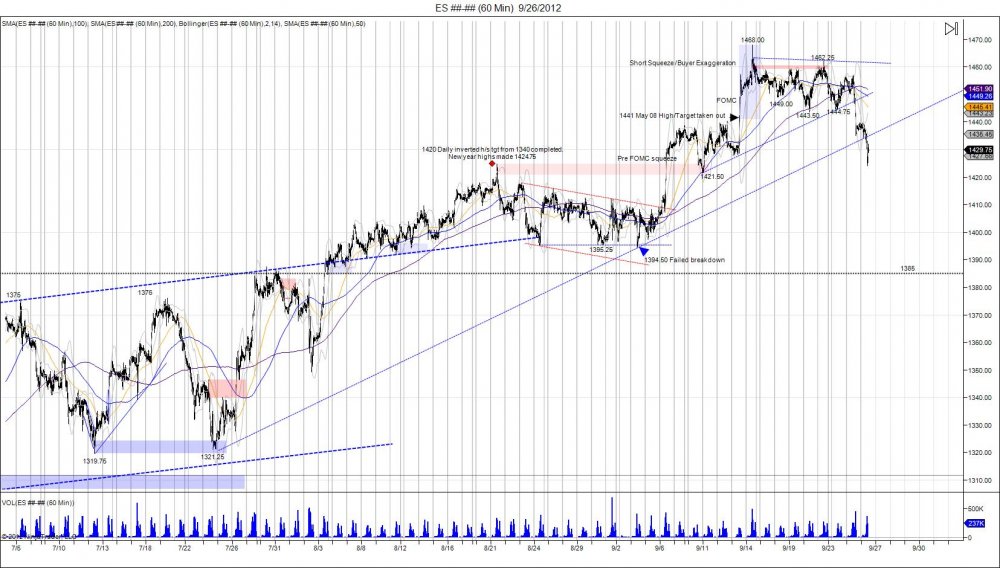
 ES________60_Min___9_26_2012.jpg

click chart to maximize


The SP500 completed its 1441 target and squeezed into its next major resistance being 1468, tapping it on the button as buyer exageration and short squeeze above 1441 led the market into this next level. Thus far, the market saw consolidation off 1468 in attempt to build a base down to 1443, however buyers ran out of gas as the market reversed Tuesday as they attempted to test the upper 1450s and fell to take out this 1443.50 level.  This has the market now testing an important support range within 1437-1421 as lows of 1424 were made today, fighting to hold the 1421.50 low made September 11th, being the pivot low prior to the run into 1468.  Below this level comes 1410-1394.50 being the pivot low made on the 4th as the market made a failed breakdown and ran from this into the 1468 level. This level could be the target for this move to squeeze out dip buyers and back and fill into this level.  Should this take place, 1385 comes in as next major support on the downside that we must look for the market to test and attempt to hold to offer oppurtunity to reload. There are many eager buyers who want to come in as the market retraces its FOMC move higher, moving down into where this leg up began at 1394, would certainly hurt these buyers. 


Continue reading
3861 Hits