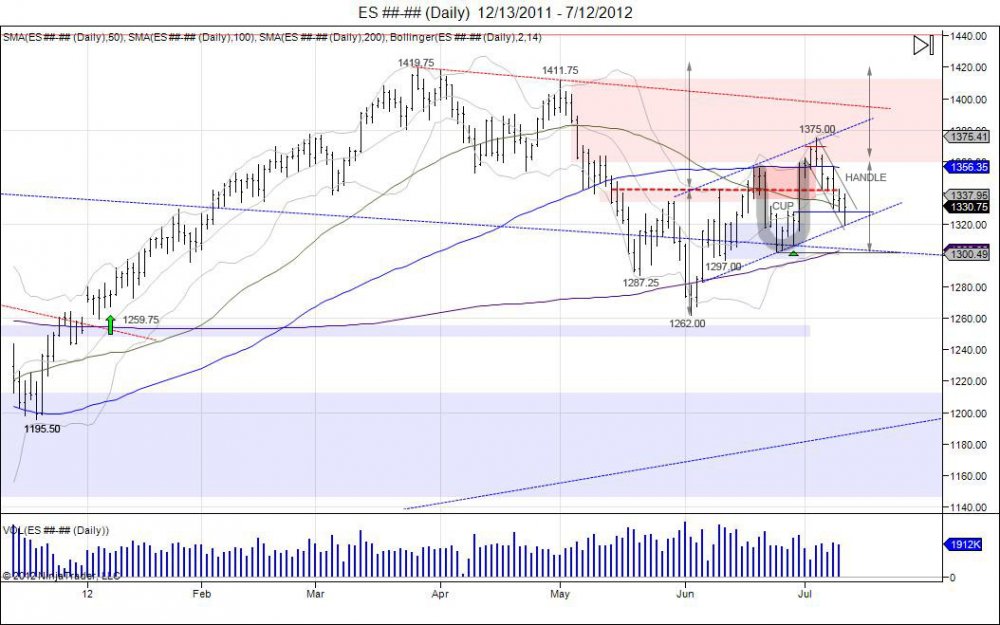
Today the SP500 completed its target of 1422 by the bullish patterns created during the months of May - June. The year lows of 1259.75 held in June with lows of 1262.00 as the market double bottomed to keep the gap from last year downt o 1252.50 open, keeping the bullish momentum alive. The market consolidated against these lows and created an inverted head/shoulder pattern with a 1342 neckline, targeting 1422. An attempt to breakout was seen early July before the market went into another consolidation phase, creating a cup/handle pattern and retesting the 1320-1297 right shoulder. This created another double bottom against 1420 in July and the market rallied into its upside resistance of 1385. During the month of August the market squeezed above 1385 and held above to keep shorts trapped which led to a slow chipping away at the May highs of 1411.75. Which this hold above 1385, shorts were forced to squeeze out, leading to this high of 1411.75 being taken out and finally giving room to take out the year high of 1419.75 and complete the target of 1422 from the 1342-1262 inverted head/shoulder. Today as the market completed this, instant profit taking was seen as the market reversed down to 1408. At this point a shakeout can be seen to test downside support down to 1383 with major stops below 1349. Breaking below this low derails the upside momentum to see further downside. Going forward, as the market looks for downside support and longs who have riden this over the past few months take profits, the late comers and shorts can give the fuel for the extra 20 points to complete the final squeeze of 1441 being the May 08 highs. This completes the short squeeze from the 665.75 lows put in 2009. A squeeze of 1441 can then give room to look for a correction in the market, however will need to see if the market can stabalize or fails following the move.
For precise entry, stop, and target levels on day and swing trades along with updates, click here for more information.


