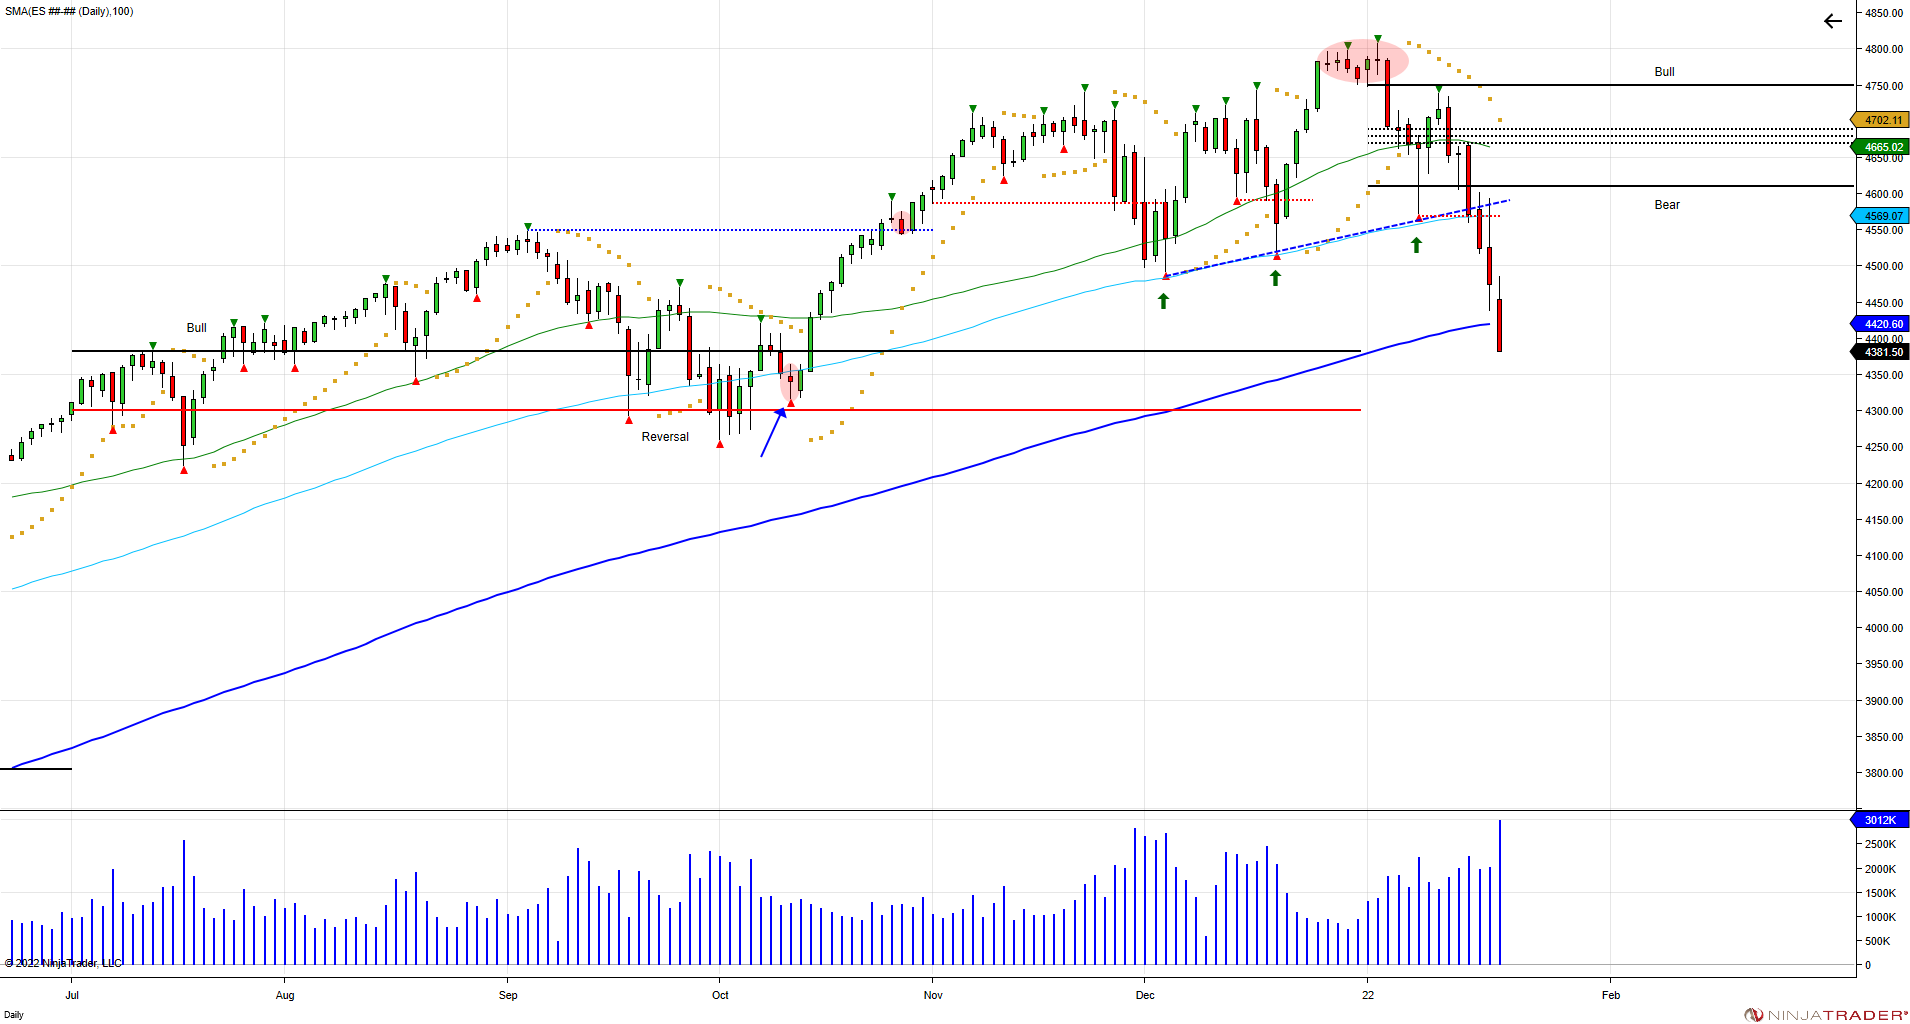
The SP500 gained 1156 points in 2021, or 31%. The market attempted to correct in October with a low of 4260, only to see sellers fail to take control as buyers defended the 6-month reversal window to maintain the bullish 6-month bias. This led to a squeeze in October above the September high of 4549 to force shorts to cover, before spending the next 2 months consolidating above and luring in buyers above. The market ended in 2021 by flirting with 4800. To start the new year, the market broke through 4800 on the 2nd day of trading, only to fail in holding the breakout above, which led to a move below the Jan 3rd low of 4747. The break led to a quick move down to 4572 before bouncing back to retest the failure above 4747. Buyers failed to recover the bull trap above 4747, putting in a lower high at 4739 which left trouble for longs as the market went after 4572 again. The break of 4572 gave way for a break of the December trendline from the rising lows, which is giving way for a retest of where the market broke out originally in October as the 200SMA is being tested for the first time since June of 2020. Buyers are under pressure to perform and to defend the October low, as that is where the pressure is against the next big sell stops to shakeout longs. Short term test of 4365 is the next support in the market that can provide an opportunity to bounce, however, rallies up to 4550 becomes new overhead resistance for sellers to defend and buyers to overcome.

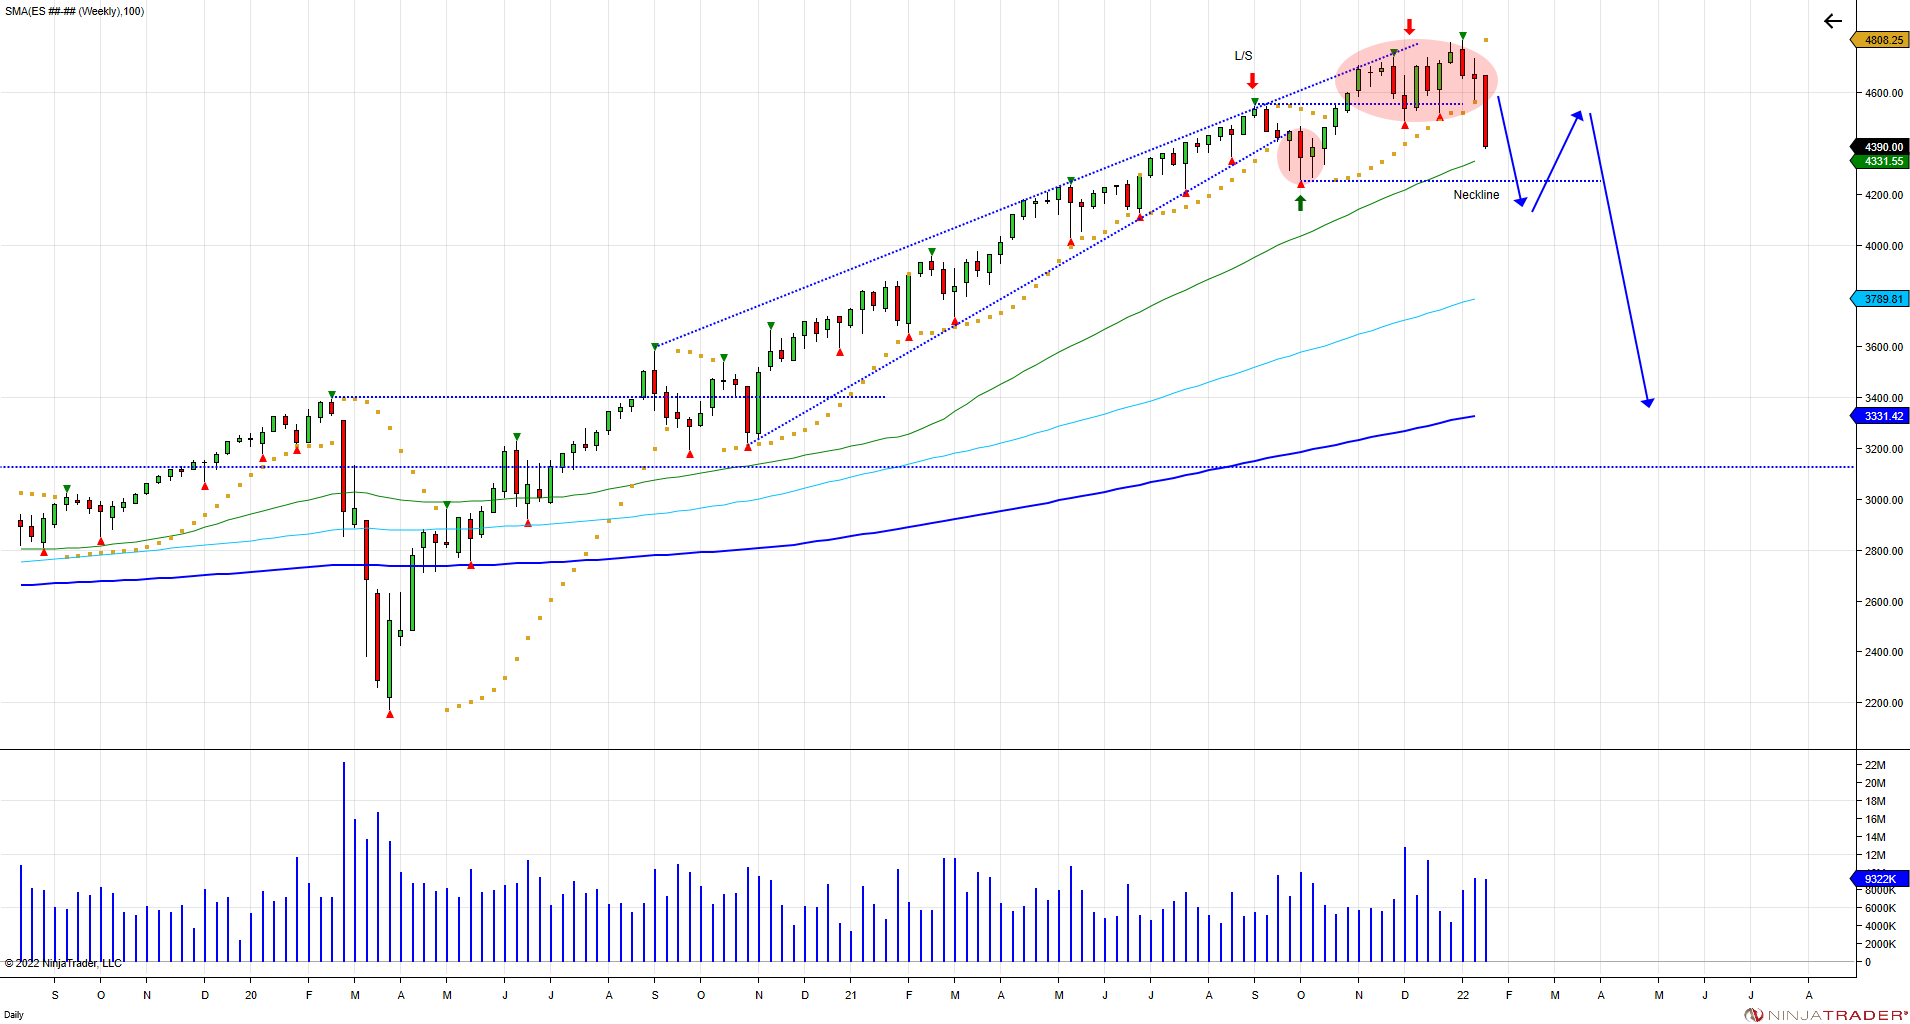
As seen in the weekly chart above, the attempted correction in October lured sellers that were unable to expand lower, which became trapped as buyers stepped up and used them to fuel the next leg up. The market spent 12 weeks above the September 2021 high, luring buyers above, only to now fall back below, which has caught buyers trapped above. Going forward the pain in the market is for the October lows to fail. Until then the pressure is on buyers to defend pullbacks to prevent losing the October low as taking out the level will shakeout longs and confirm the breakout above the September high as a failure. Break of the October low reverses the move and not only will shakeout longs but lforce sellers to chase below, which can then provide an opportunity to bounce back to retest the failure above 4550 in an opportunity for buyers to overcome and sellers to defend the failed breakout above. Failure to recover the failed breakout is what puts in a right shoulder to create a larger head/shoulder pattern. Buyers have a long way to go to get another shot at the ATHs again by recovering the market above 4740. The market moved up 121% from the March low in 2020. After making the V bottom in September of 2020, the market never looked back and rallied throughout 2021 into the 4800 level, forcing longs to chase. Ultimately, the market has the opportunity to retrace back down to 3450-3150 to retest the breakout from 2020. This equates to a 35% decline from 4808 into 3150, which is a 61% fib retracement of March 2020 to the January 2022 high. How long will it take to retest these levels is the X factor. Retests always take place, it's just a matter of time.
The negative start in 2022 is the market attempting to price in rate hikes as the Federal Reserve has come out to say they are looking to hike 4 times this year. The velocity of how the market is moving is based off traders being caught on the wrong side.
