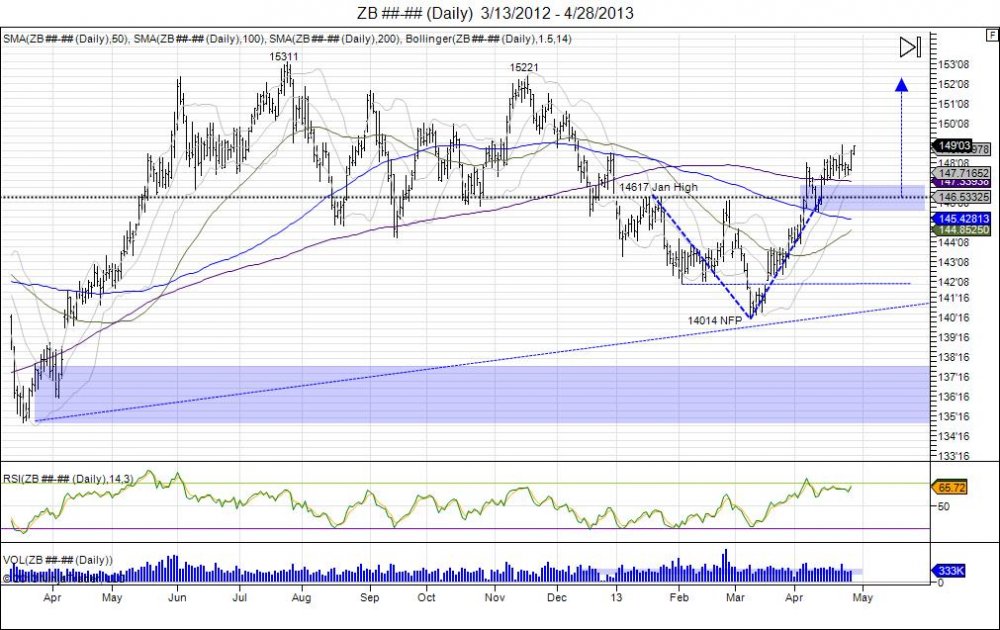
The 30 year bond has consolidated above 14617 in an effort to hold above the year highs after seeing a massive short squeeze that reversed the market from the year lows of 14014. Squeeze was fueled by shorts as the market broke below the February lows on the March NFP release to put in these lows, the market saw a recovery the following Friday going into the "Cyprus bailout". Cyprus news led to gap above 14200 turning level into a failed breakdown as market continued to force shorts to cover until the year high was taken out. The move caught many off guard and in turn cleared out shorts in the market. By holding above 14617 the market now tries to build a base of support to attract buyers that neglected bonds for stocks earlier in the year. The market sees major resistance against 14923. Taking the range of 14617-14014, gives way to push toward 15221 high from November. Just as the Yen tries to target its November gap.
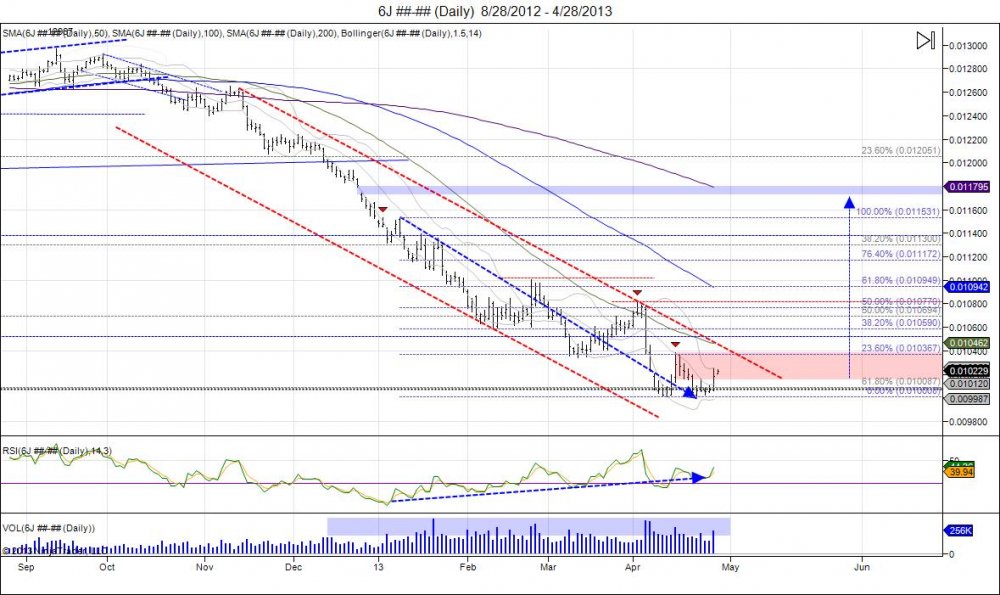
Yen and SP500 show almost exact contrast comparison. As Yen tries to double bottom in April, SP500 is trying to double top. The Yen made lows of 10008 and 10013 before squeezing through 10158 last week. This level has turned into a new area of support should the double bottom be good. Holding above 10150 gives room to force shorts to cover to give room to take out April 15th's 10383 high with next major level of stops above 10809 from April 2nd highs. Above 10809 confirms double bottom against 100 to give way for a massive short squeeze to target the year highs at 11531 and give room to fill last November's gap at 11790. During the past 4 years the Yen has had a tendency to bottom during the Spring months.
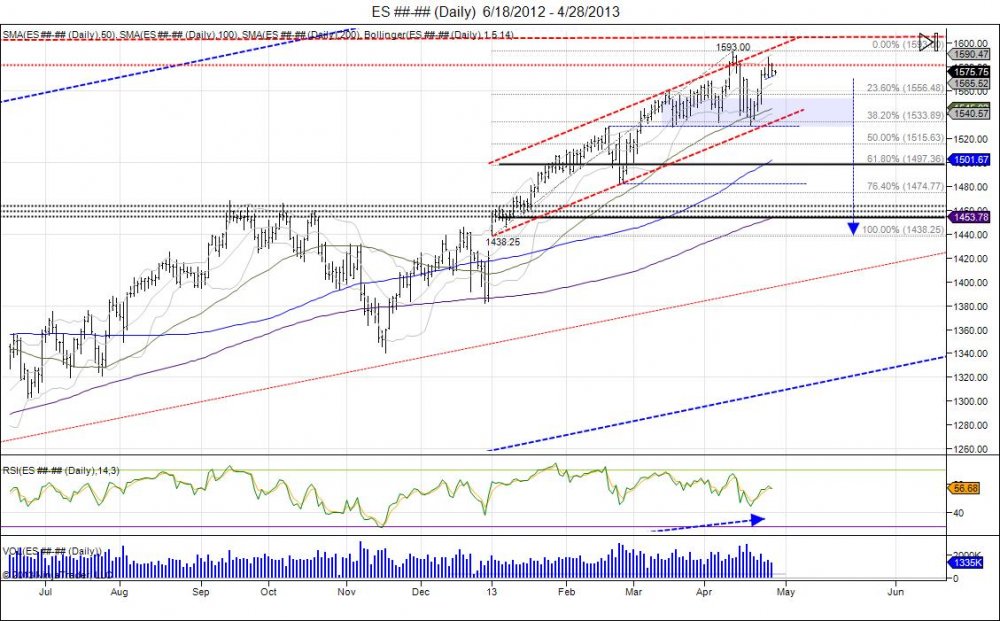
In contrast the SP500 has a small double top as market most recent reversed from 153075 to retest 1593 by making a high of 158825. As the market hits it's head against this resistance it has managed to hold above 1570 to create a very tight trading range. Move past 1588 is needed to retarget 1593 for stops. Break of 1570 gives way to test support at 1555 based from the 153075 pivot low. Taking out this low would confirm the double top to give way to cross the "line in the sand" from the Cyprus lows of 152950 which have held like a rock. This is line in the sand, just as 108 is the line in the sand in the Yen and 14617 was in bonds. In contrast to the Yen with the gap at 11790, the SP500 has a gap down to 142575.
The caveat to equity shorts is the Nasdaq index. This is the only major index that has yet to take out last year's high in which the Nasdaq did 2871.75. The market has slowly chipped away through resistance, creating pennant that has tightened as this has led the market into the door steps of last year's highs. This retest of the highs and waters at 2850 has made the market nervous and shaky as it fell to 2724 in April. This breakdown has seen a reversal squeezing the market back above 2800 and putting pressure once again at resistance. Consolidation period developing with move past 2858.50 to give room for last year's high to be squeezed to complete mission of taking out shorts. Breach below 2800 is what sellers need to break away from this upside pressure and to retest support from 2724.

Volatility has continued to tighten up as it has made lower lows with lower highs over the past year and a half. This has grinded against the 1300 level which was the previous base from April of 2011 before moving up to 48. Most recently market broke its lower trend line on weekly to fall down to 1105 before gapping higher the following week at 1347. This has turned the range from this breakdown into support as a failed breakdown to give room for a move past 18 into the top of the penannt.
Chicagostock Trading: 2 week trial
RISK DISCLOSURE: PAST PERFORMANCE IS NOT INDICATIVE OF FUTURE RESULTS. THE RISK OF LOSS IN TRADING FUTURES AND OPTIONS IS SUBSTANTIAL AND SUCH INVESTING IS NOT SUITABLE FOR ALL INVESTORS. AN INVESTOR COULD LOSE MORE THAN THE INITIAL INVESTMENT.


