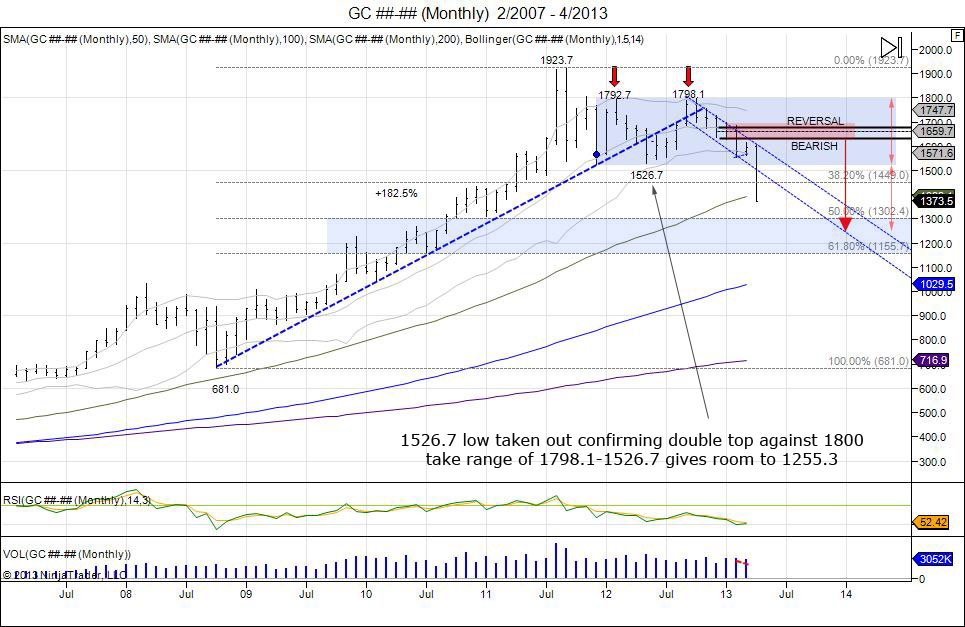
Since the December 2012 FOMC meeting that "Spooked the gold market" as the FOMC members attached a 6.5% unemployment for a target on rates, gold has fallen $362.6. However since the failure to break above 1800 in 2012 and double topping at 1798.1, the market is down $442.8. So why the sudden crash over the past 2 days? As we know the market ran from 681-1923.7 as the FOMC cut their rates down to 0%. The year of 2012 was all about consolidation. It traded in a range of 1526.7-1798.1 which lured in a lot of late buyers betting on "hyperinflation". As gold has most recently failed and broken below this 2012 low of 1526.7, it has confirmed the highs in 2012 as a double top. This range of 271.4 (1798.1-1526.7) can now be subtracted below 1526.7 to give room to expand the market down to 1255.3. This target when put out in December was looked at as a crazy and a lot of "gold bugs" were insulted. Today the market is bringing pain to these gold bugs as it shakes them out. The current breakdown clears and shakes out buyers who came into the market above 1500. The move is good for "smart" money who have been sitting on the sidelines awaiting for the market to go on sale. Completion of this move is seen at 1255 which also retraces the market 50% of its 681-1923 move. In the big picture, that would offer a 50% sale off the highs and bring the market back to where it broke out in 2010. This range of 1200-1300 will offer an area of major support for the market to attempt to build a base for long term buyers to watch for to come in and buy the sale. A break of 1150 would give room to test major support at 1000 being where the market broke out in 2009. Failure to hold above sees the 681 low targeted and at that point the long gold story would be all over. Short term yes the market is very over sold and the long community is in shell shock, the old lows of 1526 is now new major resistance with next level of sell stops below 1309.1 as the 2011 lows.
RISK DISCLOSURE: PAST PERFORMANCE IS NOT INDICATIVE OF FUTURE RESULTS. THE RISK OF LOSS IN TRADING FUTURES AND OPTIONS IS SUBSTANTIAL AND SUCH INVESTING IS NOT SUITABLE FOR ALL INVESTORS. AN INVESTOR COULD LOSE MORE THAN THE INITIAL INVESTMENT.

