Chicagostock Trading

Chicagostock Trading

SP500 & Nasdaq Back to Bottom of Rising Wedge

1-8-12b_1.jpg


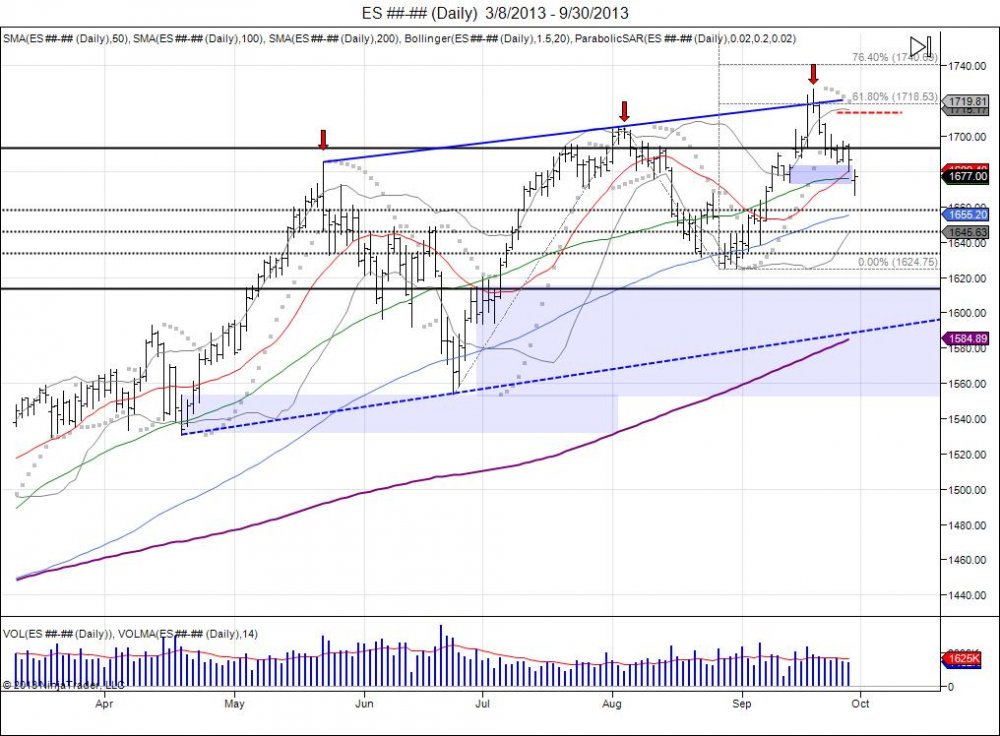
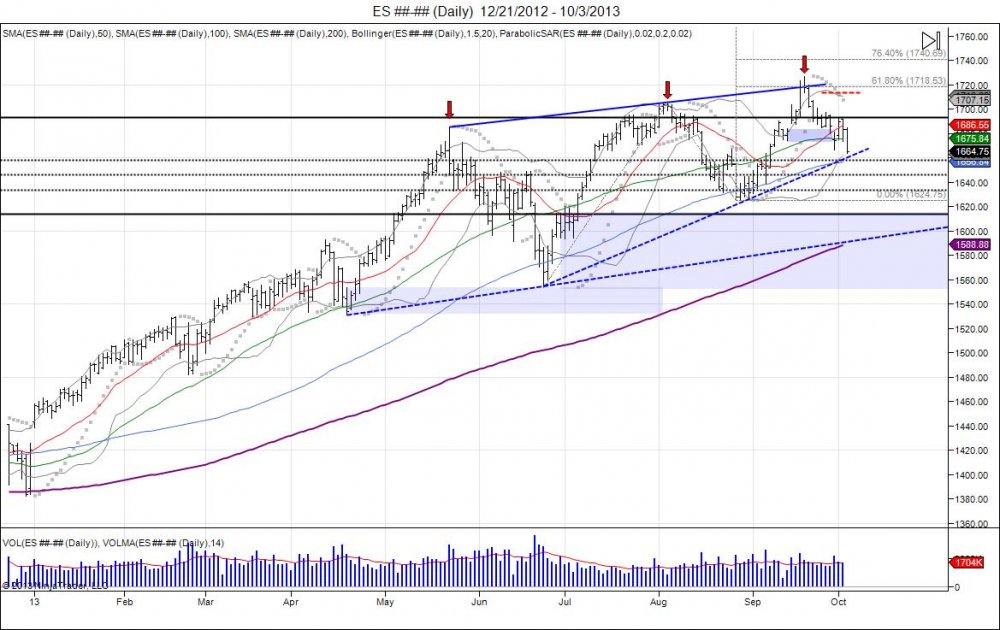
The struggle to top since the first correction in May from 1685-1553, being the most violent of the year, led to higher lows and higher highs as new highs squeezed shorts and every dip became more and more shallow. Buyers continued to pile into these dips making them more shallow, afraid of missing "the next leg up". This recipe is what makes the rising wedge, and a recipe for disaster as bulls and bears make money, but hogs g slaughtered. Thus far the surprises from the Fed on "no summers" and "no taper" have held as the highs as shorts capitulated into 1726s and market gave it all back the following week. Bulls have another opportunity to make a higher low here as the market comes into this support line from the June lows. Failure to hold the August lows of 162475 break the wedge to give way for a test of the June lows to confirm the failed higher high up to 1726.


1-8-12b_1.jpg


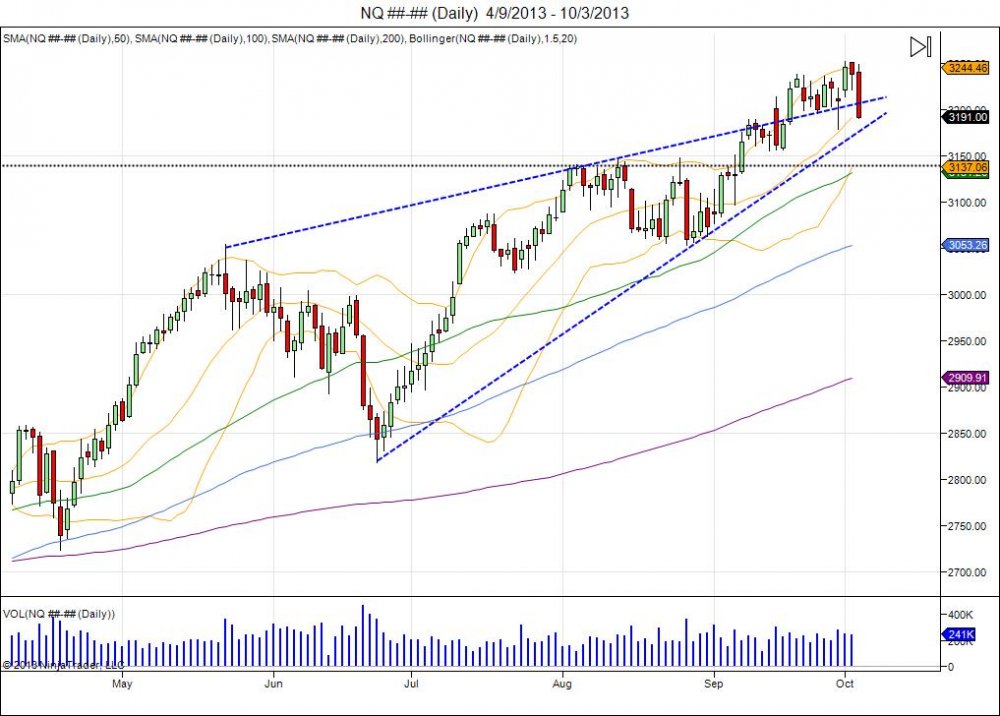
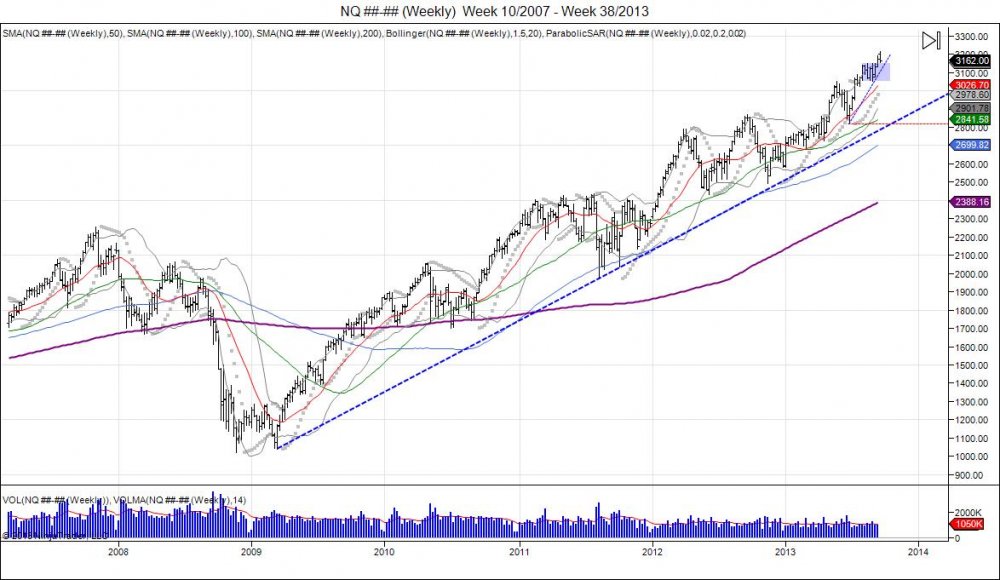
Nasdaq chart shows breakout above rising wedge to squeeze shorts and move back inside wedge to retest support.  This can lead to a water fall effect with confirmation of top on a break of 3055.
Continue reading
3901 Hits

SP500 Market Update

Picture1.jpg


1-8-12b_1.jpg


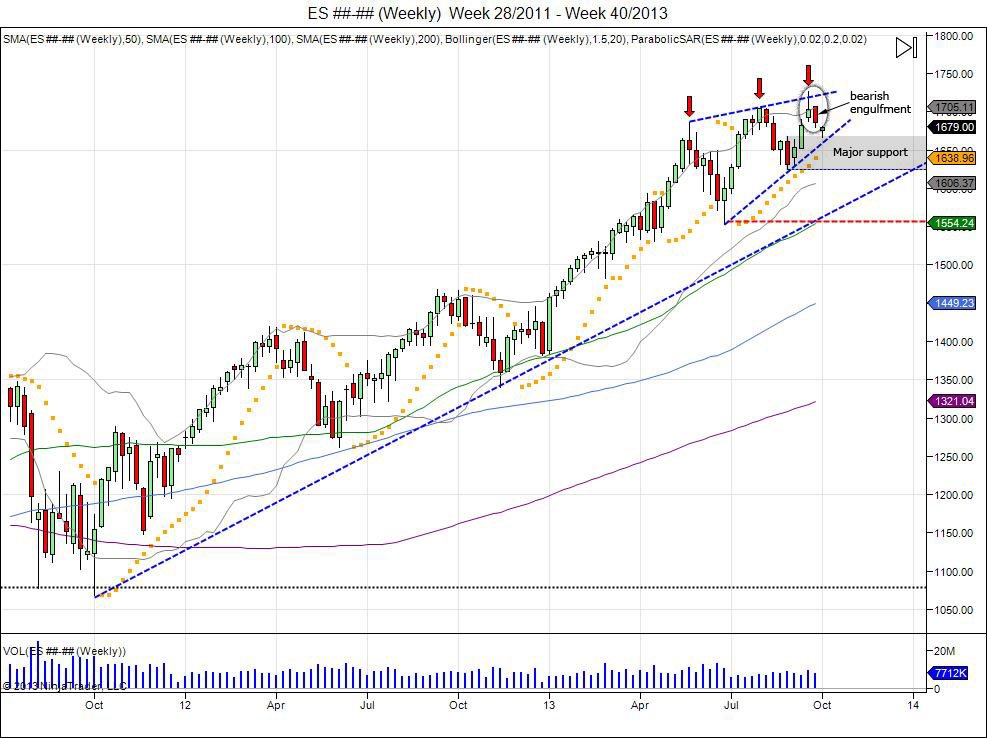
The Emini SP500 rallied once again into the top of its resistance line from the past 2 highs this year on the surprises seen 2 weeks ago with "no summers" and "no taper".  This led the market into highs of 172675 as shorts capitulated, before seeing a reversal that retraced the market back to where it broke out.  Last week, the market fell to take out the lows of 168775 based off those weekly highs of 172675.  This retracement gave way for new buyers to come into support the market post the short squeeze as it came back to its breakout point, however the weekly close below 1693 established a bearish engulfment on the weekly charts, and the close below 168775 further setup bearish signals.  This sees the market coming down to test its major support of 1668 based off the 162475 lows prior to making these new highs. The trend remains up as the rising wedge tightens. Short selling remains aggressive and going against the trend until the market loses the 162475 pivot low prior to the highs. Once these lows are taken out, the market sees next major support down to 1615, followed by 1553 from the June lows.  A breach of the June lows at 1553 is confirmation of this rising wedge being the top to give way to the Cyprus lows down to 1530. Going forward, 1688 comes in as first major resistance, followed by 1713.  The fact that the market gave back all of its "no taper" squeeze, shows wall street is losing credibility in the Fed as they appear to be "all in" with their QE programs. This is where new/fresh buyers need to step in to continue upside momentum.  The 2nd half of the year has established a bullish bias as it has closed above 1693 for 7 days. To reverse this bias, the market must see 7 day closes below 1613.75.


Tags:
Continue reading
2507 Hits

Nasdaq's Rising Wedge

1-8-12b_1.jpg

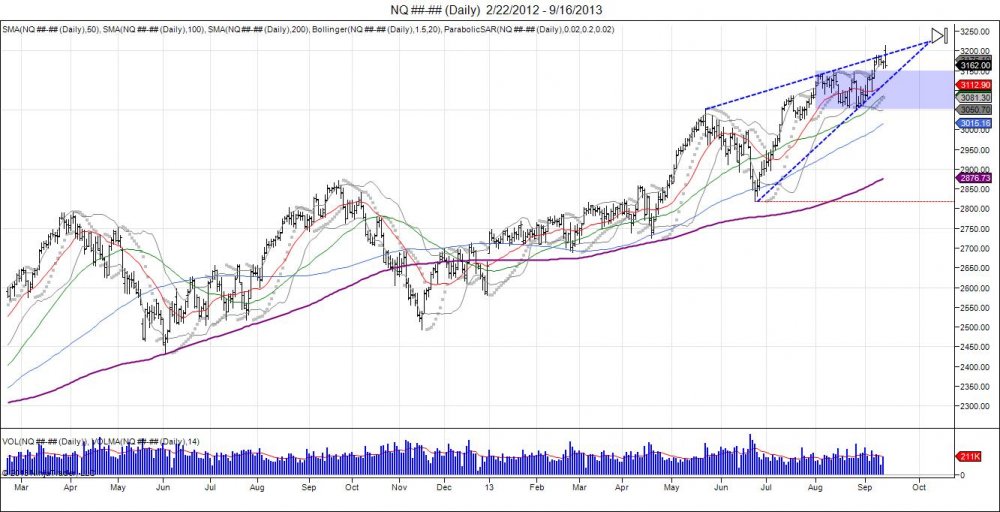
After running through 3050 in July, Nasdaq continued its run into August printing early highs of 3150 before falling back to 3050.  This led to a failed breakdown as the market found support at it's old resistance and turned the month of August into a consolidation month with a range of 3050-3150.  To start September, the pressure was put against the tops at 3150 which eventually gave, seeing the Nasdaq future trade up to 3213 today.  The gap open higher was above its rising wedge which led sellers to come into take profits and bring the futures back down to fill the gap from last friday.  This rising wedge should be taken with caution as the market presses the tops and the wedge tightens.  Going forward, 3150-3050 is new range for Nasdaq to hold to continue the upward momentum. To continue this range expansion of 3150-3050, this gives room up to 3250.  Line in the sand comes at the August lows just below 3050 as a break below this shows the market failed to hold the consolidaiton range and turns the breakout above 3150 as a failure. Major downside support seen within 2920-2870 with stops below the June 281775 low as a breach of this low sees a break of the 200day and a shift in trend momentum. Based off Monday's 3213 high, 3196 is a new level of resistance off these highs.


1-8-12b_1.jpg


Tags:
Continue reading
2661 Hits

Gold Breakout Looking for 1376 Above 1348

1-8-12b_1.jpg


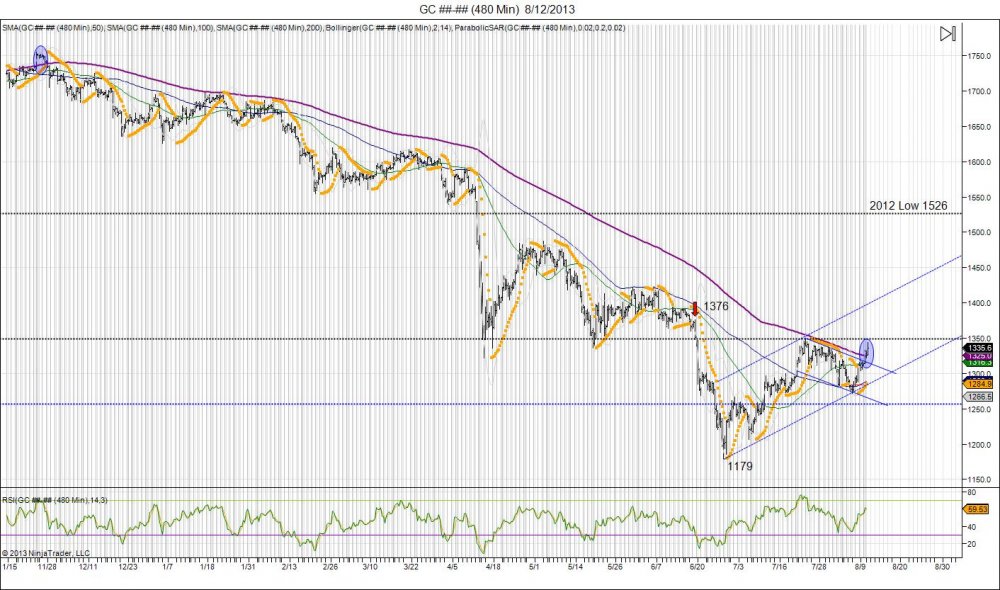
Gold broke out of it's downward channel it has been in since meeting its 1348 resistance level late last month and squeezed through it's 200day moving average for the first time since November 2012 on the 8 hour chart above.  After completing 1255 downside objective from 1526 and even falling further to 1179, this setup oversold conditions which gave way for the short squeeze that saw the market recover back from 1179 into 1348.  This 1348 level is a major level of resistance based off the pivot high of 1376 that led into the flush to 1179.  After hitting 1348 last month the market consolidated and traded lower to shake out longs, putting in lows of 1271.8, to hold 1269.3.  This setup a small double bottom which gave way for a reversal last Friday back above 1300. The reversal late last week above 1300 put pressure against the 1320 pivot high prior to 1271.  Overnight the market took out 1320 to squeeze shorts which gave way to highs of 1343.7.  This is now retesting the 1348 level and putting pressure to squeeze through this to take shorts out and confirm the hold above 1300 to open the gates to the next major level at 1376 being the high that led into 1179.  By taking out 1376 the market recovers its fall from 1376-1179, confirming the "flush".  At this point should gold do this U turn, we look for the market to consolidate and build a base to develop support for continued retracement back to retesting the 2012 lows up to 1526.

Tags:
Continue reading
3674 Hits

Does Bernanke Leaving End the Bull Parade?

1-8-12b_1.jpg


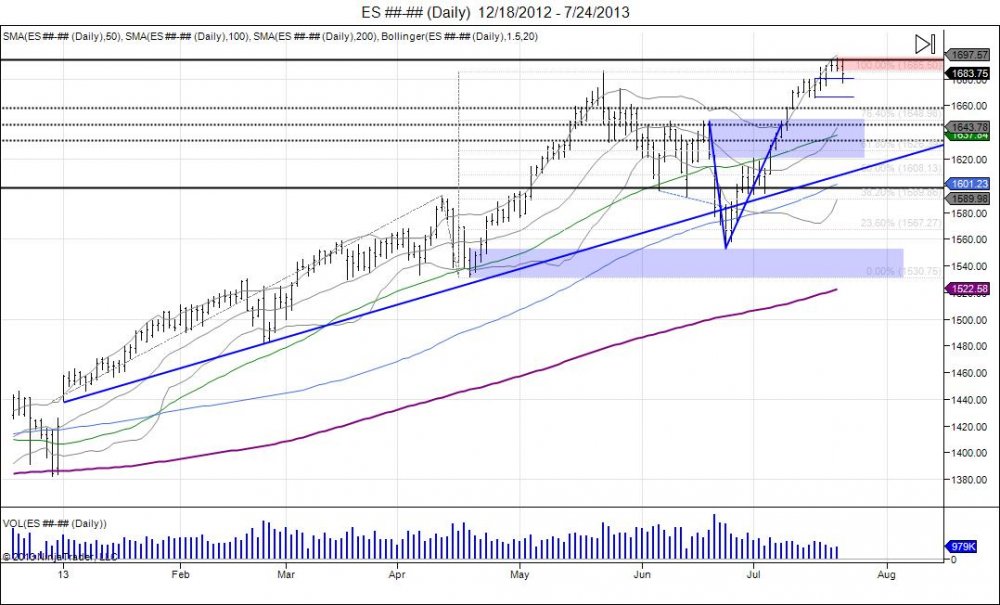
In the aftermath of what was Bernanke's last testimony to congress, equity markets squeezed new highs for the year just as the testimony wrapped up. Most congressmen were applauding the chairman for his service, somewhat having the feeling of a farewell party. The question is, if the chairman is leaving, does this mean the QE party is over and who will be last to turn off the lights? The uncertainty of the next chairman and actions is unknown. It's been quite a ride for the year, opening above 1440, last year's resistance, and seeing a gap and go breakout. Moving through all resistance and squeeze shorts in the process. This took 5 waves in the first half of the year, with 2 being minor corrective waves as tops failed.. Shorts squeezed and investors piling in, forced into equities on a QE high. This saw record highs of 168575 last May before longs began to sell into the squeezed bid to take profits. Bernanke scared investors out on June 19th with worries of tapering QE, seeing the market reverse lower from 1649.  This started a shakedown and panic into testing major support based off 1530 which originally began the leg up through 1600. The bull strongly defended this test holding in the low 1550s to prevent the reversal in trend. The market was walked back up to the 1649 level just in time to give Bernanke a second chance on another FOMC release of July 10th, and creating a "V" bottom. Bernanke was able to calm the market enough to break through 1649, triggering a short squeeze to give way to take out the all time high from May.  The latest and "last" testimony to Congress from the Fed chairmen had the market sitting on all time highs.

The SP500 followed the Transports lower Wednesday after failing to take out 3 day highs and setting up a small flat top.  The bounce to test the highs was seen as Apple earnings led the stock to jump $20 higher, luring in buyers to the SP500 for a run through 1700, only to reverse lower and close below 3 day lows. The reversal has the market pressing against major support, within 1681-1665, based off last week's pivot higher.  Failure to hold this range sees weakness in buyers and a reversal on the daily chart.  This creates the potential for a double top with the market failing to attract new buyers after taking out the May highs.  New money at these levels have new risk of uncertainty of the next Fed chairman. Next support seen at 1650, followed by 1615 with sell stops below 1550. Breach of 1550 targets 1530 Cyprus lows and the pivot that led into these all time highs. Minor upside resistance 1688-1696, break through needed for buy side to continue momentum.


Continue reading
2879 Hits