Chicagostock Trading

Chicagostock Trading

Return to "normal"

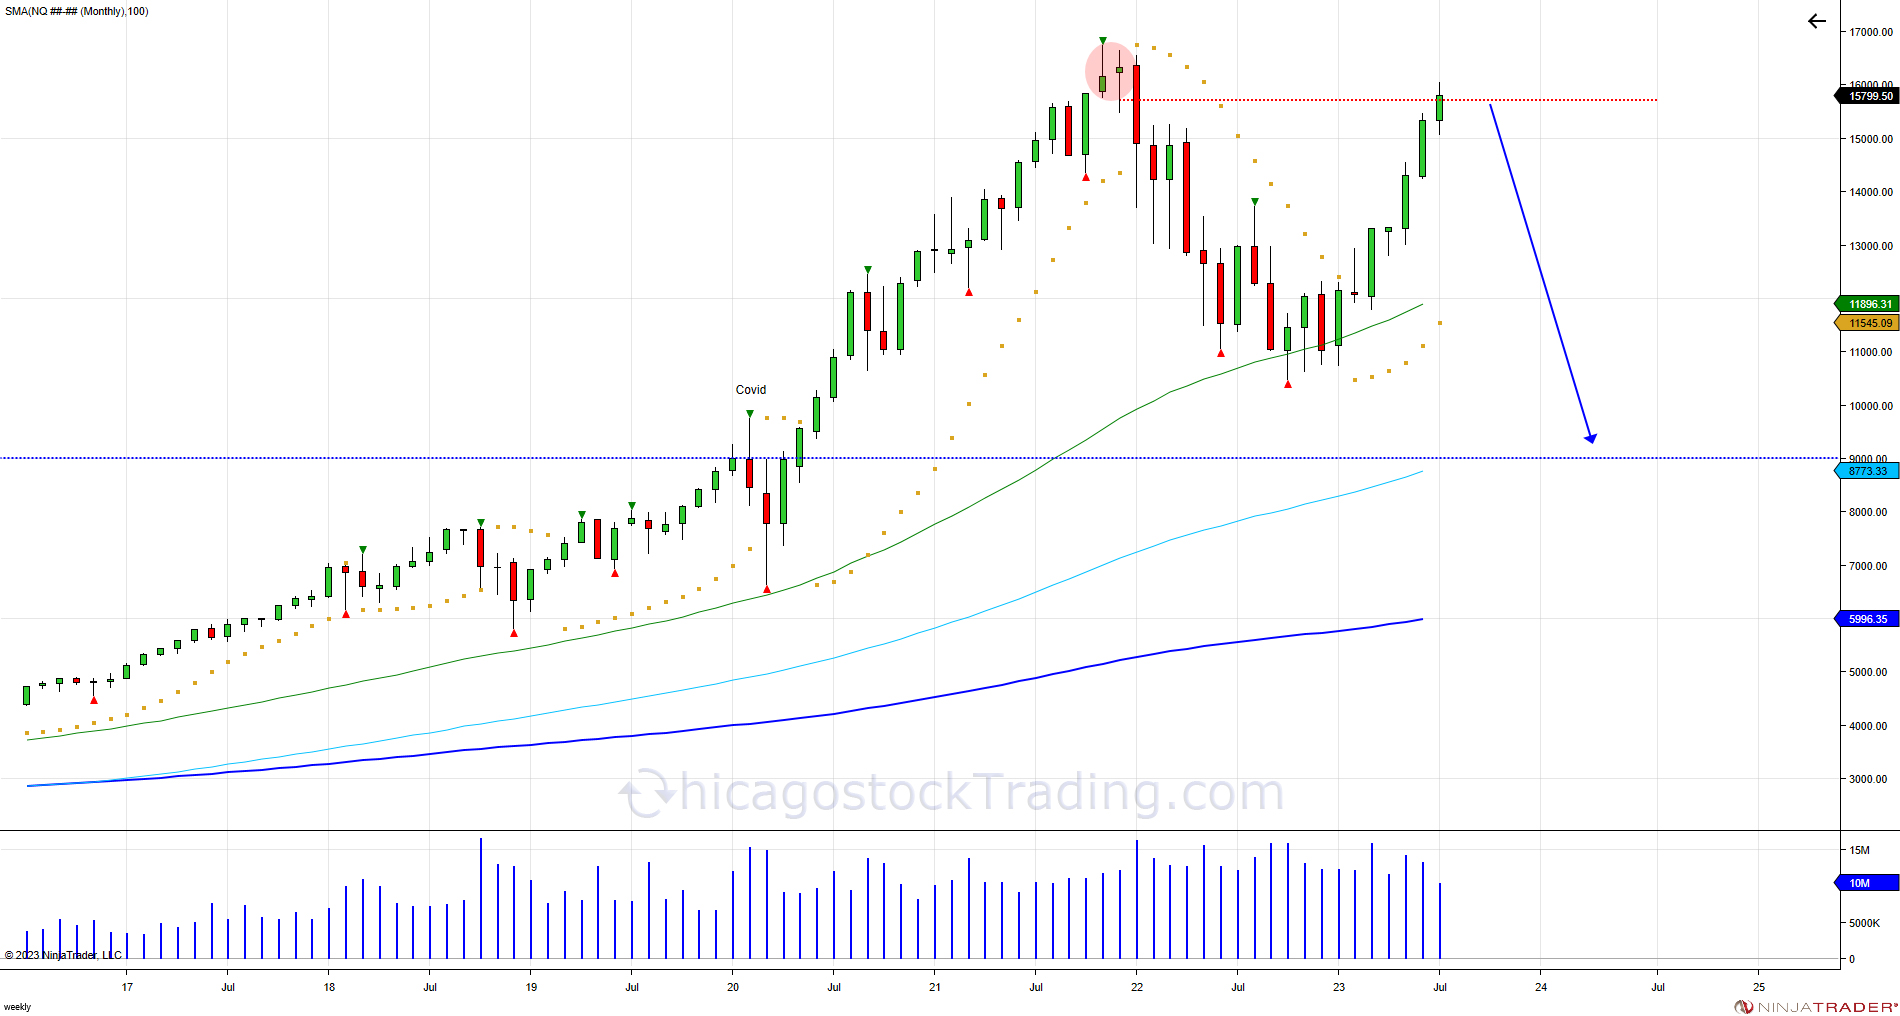
NQ Monthly 2023 07 9 57 42 AM

After the Nasdaq put an all-time high in November of 2021 at 16767, the market dropped 37% in the year 2022 to a low of 10484. The Fed has continued its hike program, which has raised rates to a 22-year high while signaling further hikes would be data-dependent. Investors are assuming they are done hiking interest rates. “There is belief that the Fed is probably done,” said Timothy Graf, head of EMEA macro strategy at State Street Bank & Trust Co. “Markets are also seeing a US economy that’s held up far better than the consensus outlook. They are pricing that we have achieved a landing that everyone thought would be impossible to achieve.” Meanwhile, earnings continue to beat analyst estimates. On top of that, GDP rose in Q2 at 2.4% above estimates of 1.8% and higher than the previous period of 2%, showing an expansion of the US economy.


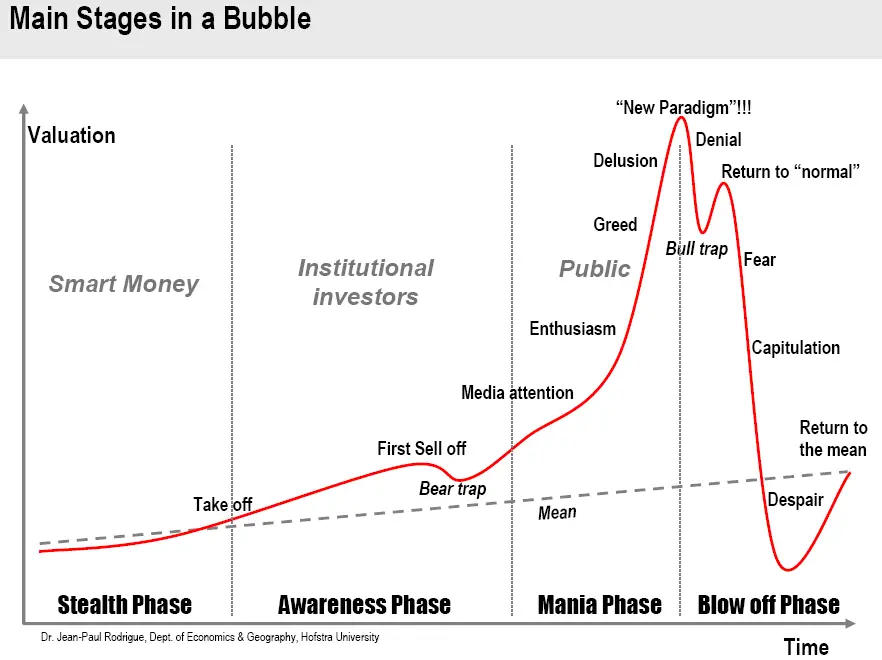
This strong data comes as the market retests the failure from November of 2021 where it trapped buyers to bring up the question, have we returned to "normal"? If you take a look at the chart on the main stages of a bubble, the Nasdaq is tracking it back to the return to normal phase. The retest of the November 2021 failure is key resistance for buyers to overcome, as well as sellers to defend, hedge, or lighten up on positions. We are at a point of testing supply and looking for demand as demand will have to keep up to continue the rally in any attempt at taking out the 2021 high.  Failure to push through and a failure at these levels can give way for another wave down that would be more fierce than what we saw last year, giving opportunity to retrace back down to retest the March 2020 high from where the market took off after the Covid breakdown. 


Image


Tags:
Continue reading
2269 Hits

A Look At Today's Intraday Reversal

ES 09 22 10 Minute 2022 07 14 6 26 42 PM


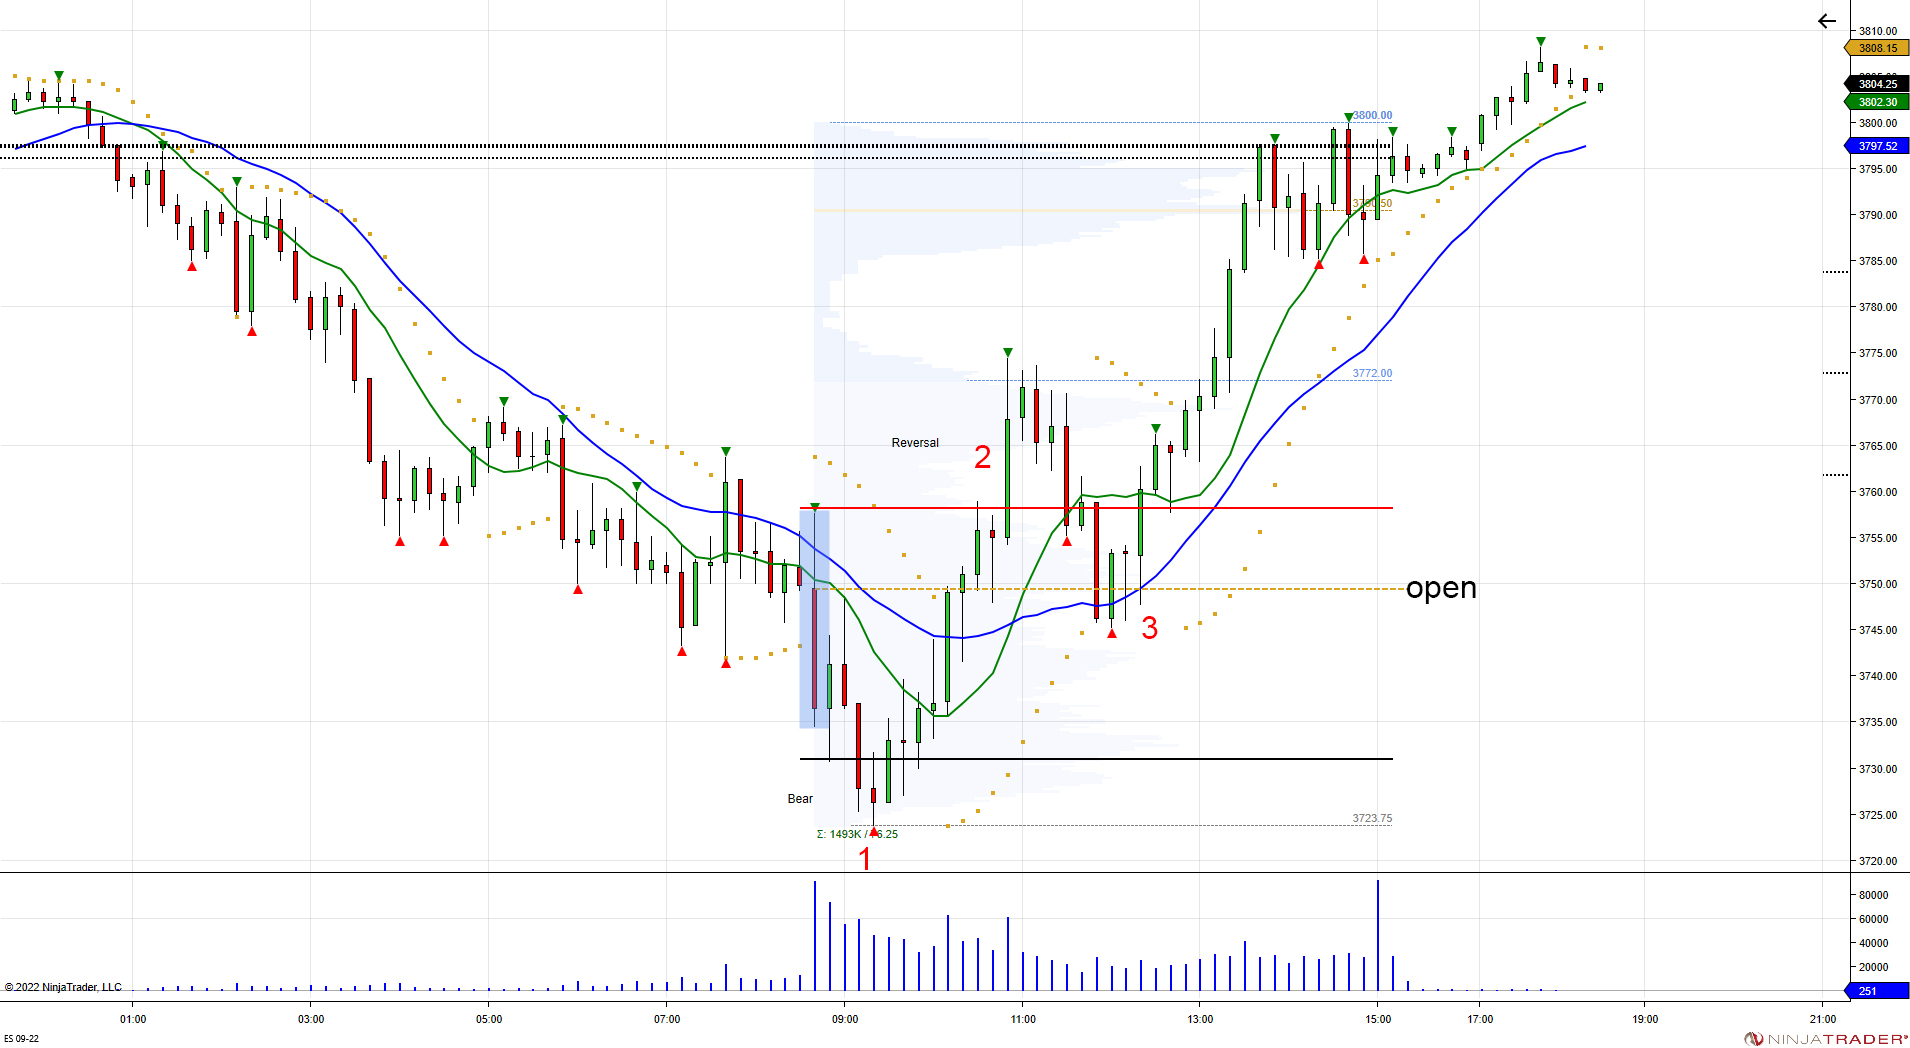
The market was sold in the overnight, setting up the cash market to open with a gap down.  Cash market opened down, forcing sellers to chase weakness and breaking the lower Volatility window at 3731.  By doing so, this set a bearish intraday bias, luring in "late sellers".  When sellers were unable to expand below the lower vol window and the market recovered back above window, these late sellers were caught in a trap and used to fuel a run through the opening high and reversal window, reversing the bear bias.  When a bias is reversed, in this case a bear one, it tells us the sellers were wrong and shorts on the day are then forced to cover their shorts and buy pullbacks.  Pullbacks into the open, and the lower vol window become support as shorts are covering. In this case buyers defended the open, which kept sellers from buying back lower, giving way for another run and expansion back to the intraday pivot as sellers were forced to cover at higher prices. 


Traps move markets, volatility windows are helpful to identify momentum on the day, but also when a trap is being set. When a majority of the selling is done in the overnight, the lower vol window becomes key to luring in late sellers.  If they are unable to continue expanding lower, they get caught in a trap and used to move the market in the opposite direction.


Sign up here for a 2 week free trial to receive daily ES reports, volatility windows and pivots: https://www.paypal.com/cgi-bin/webscr?cmd=_s-xclick&hosted_button_id=T9TWRWFGUB8NJ


Access to our chat room, screenshare, and live trading 1 week free trial here: https://www.paypal.com/cgi-bin/webscr?cmd=_s-xclick&hosted_button_id=59K8NHY2S5B6N

Tags:
Continue reading
2643 Hits

What to look for next after a stumbling start to the year

ES Daily 2022 01 23 4 14 52 PM

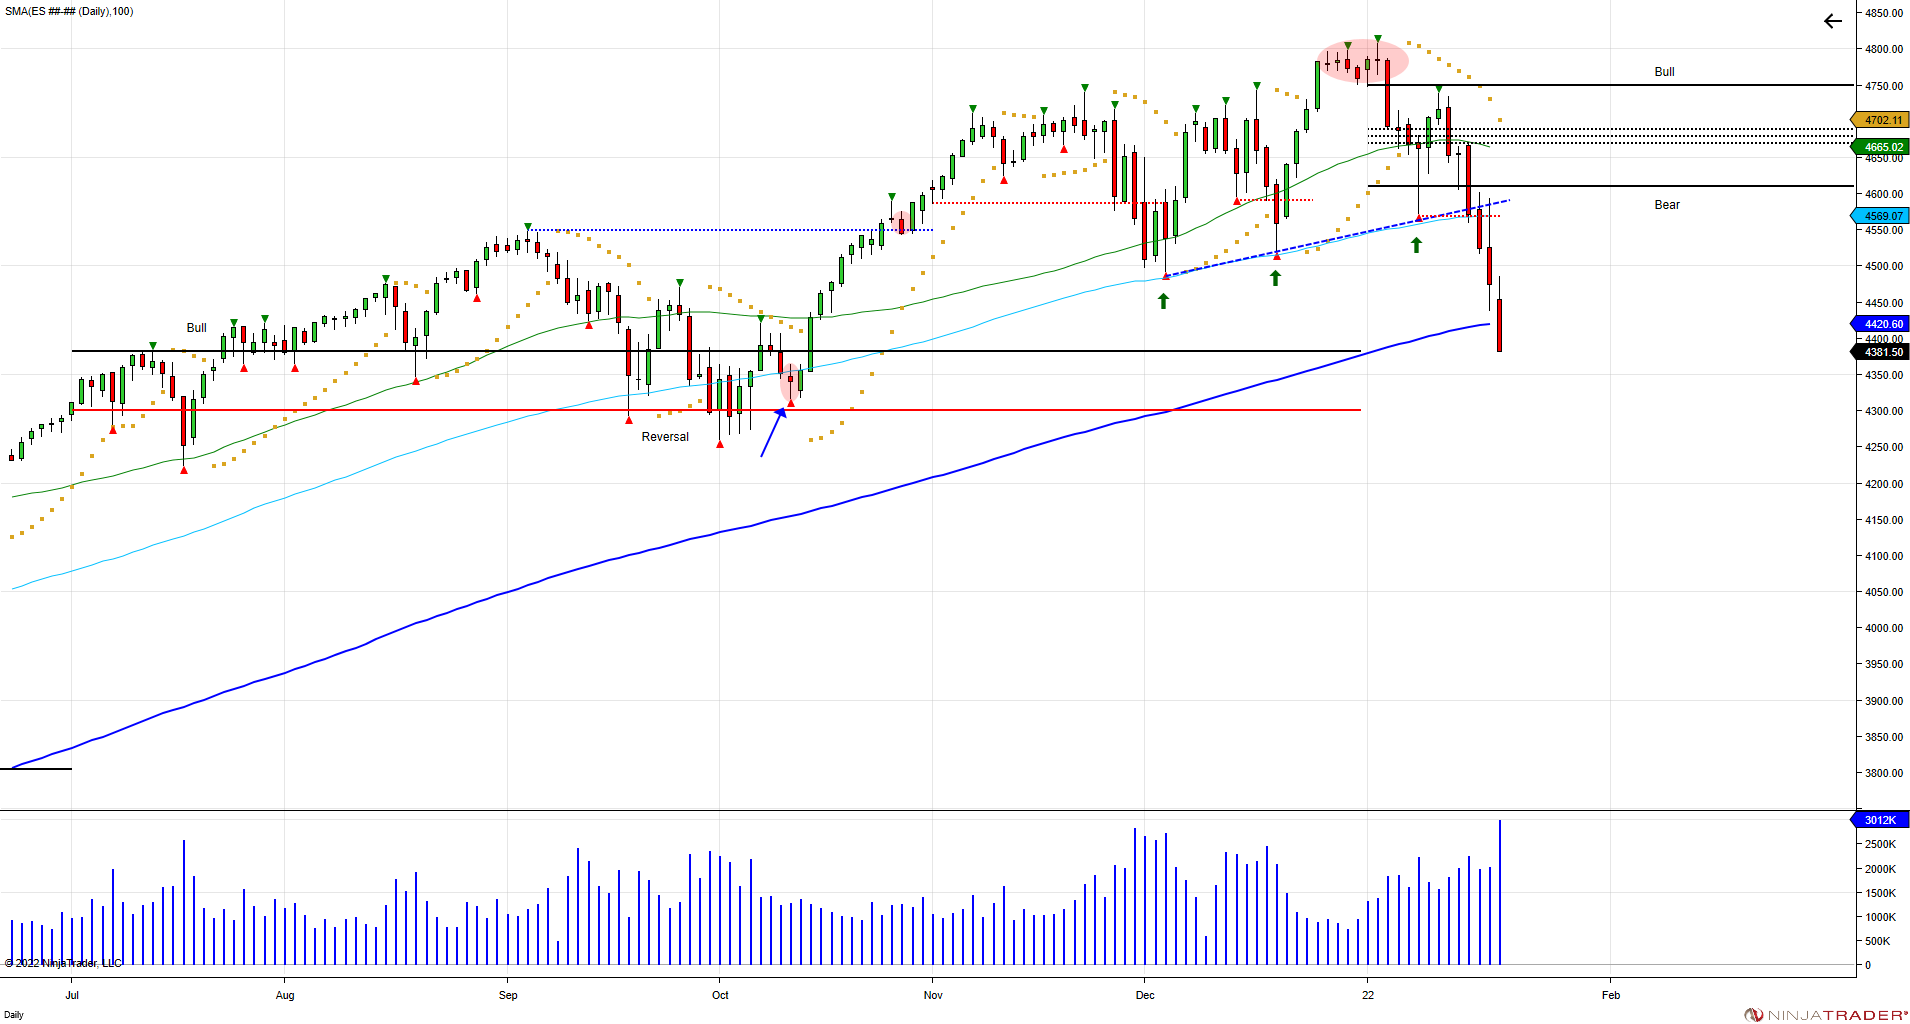
The SP500 gained 1156 points in 2021, or 31%. The market attempted to correct in October with a low of 4260, only to see sellers fail to take control as buyers defended the 6-month reversal window to maintain the bullish 6-month bias. This led to a squeeze in October above the September high of 4549 to force shorts to cover, before spending the next 2 months consolidating above and luring in buyers above. The market ended in 2021 by flirting with 4800. To start the new year, the market broke through 4800 on the 2nd day of trading, only to fail in holding the breakout above, which led to a move below the Jan 3rd low of 4747. The break led to a quick move down to 4572 before bouncing back to retest the failure above 4747. Buyers failed to recover the bull trap above 4747, putting in a lower high at 4739 which left trouble for longs as the market went after 4572 again. The break of 4572 gave way for a break of the December trendline from the rising lows, which is giving way for a retest of where the market broke out originally in October as the 200SMA is being tested for the first time since June of 2020. Buyers are under pressure to perform and to defend the October low, as that is where the pressure is against the next big sell stops to shakeout longs. Short term test of 4365 is the next support in the market that can provide an opportunity to bounce, however, rallies up to 4550 becomes new overhead resistance for sellers to defend and buyers to overcome.


ES Weekly 2022 04 4 33 16 PM

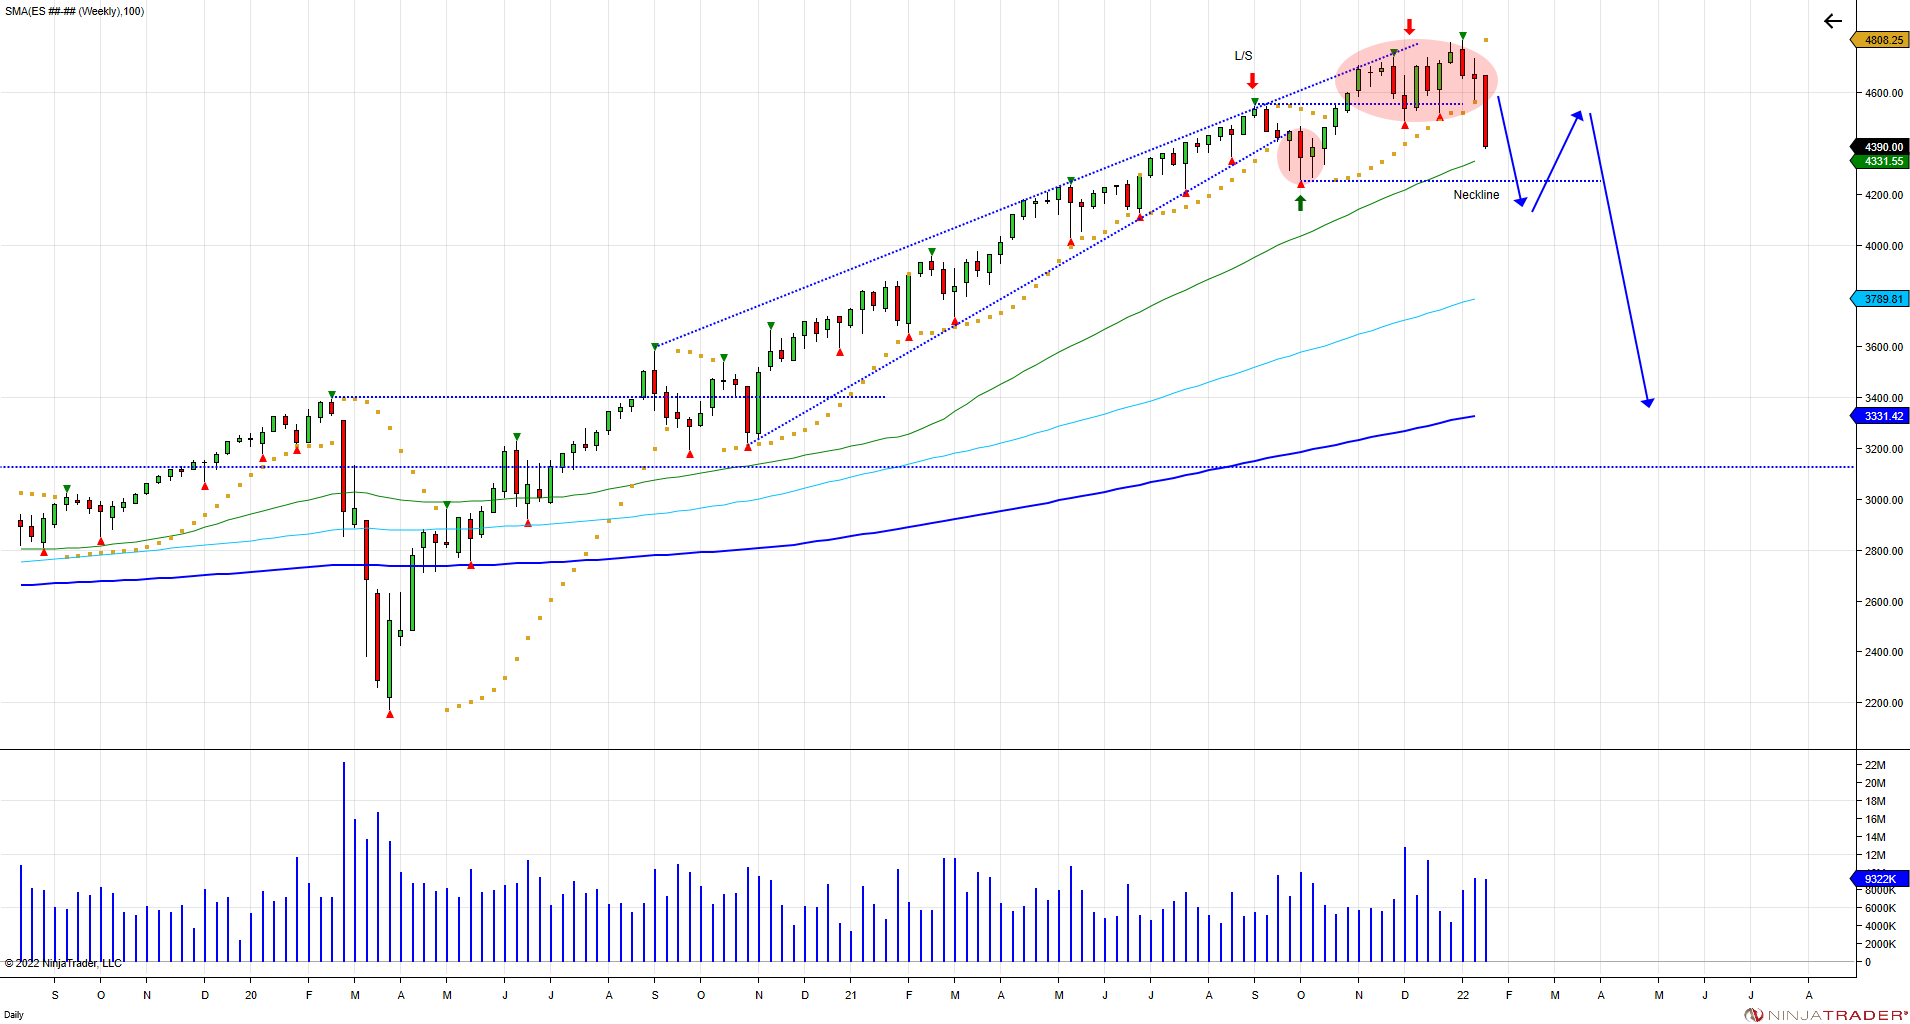
As seen in the weekly chart above, the attempted correction in October lured sellers that were unable to expand lower, which became trapped as buyers stepped up and used them to fuel the next leg up. The market spent 12 weeks above the September 2021 high, luring buyers above, only to now fall back below, which has caught buyers trapped above. Going forward the pain in the market is for the October lows to fail. Until then the pressure is on buyers to defend pullbacks to prevent losing the October low as taking out the level will shakeout longs and confirm the breakout above the September high as a failure. Break of the October low reverses the move and not only will shakeout longs but lforce sellers to chase below, which can then provide an opportunity to bounce back to retest the failure above 4550 in an opportunity for buyers to overcome and sellers to defend the failed breakout above.  Failure to recover the failed breakout is what puts in a right shoulder to create a larger head/shoulder pattern. Buyers have a long way to go to get another shot at the ATHs again by recovering the market above 4740. The market moved up 121% from the March low in 2020. After making the V bottom in September of 2020, the market never looked back and rallied throughout 2021 into the 4800 level, forcing longs to chase. Ultimately, the market has the opportunity to retrace back down to 3450-3150 to retest the breakout from 2020. This equates to a 35% decline from 4808 into 3150, which is a 61% fib retracement of March 2020 to the January 2022 high. How long will it take to retest these levels is the X factor. Retests always take place, it's just a matter of time. 

The negative start in 2022 is the market attempting to price in rate hikes as the Federal Reserve has come out to say they are looking to hike 4 times this year.  The velocity of how the market is moving is based off traders being caught on the wrong side.  

Tags:
Continue reading
3028 Hits

Is History Repeating?


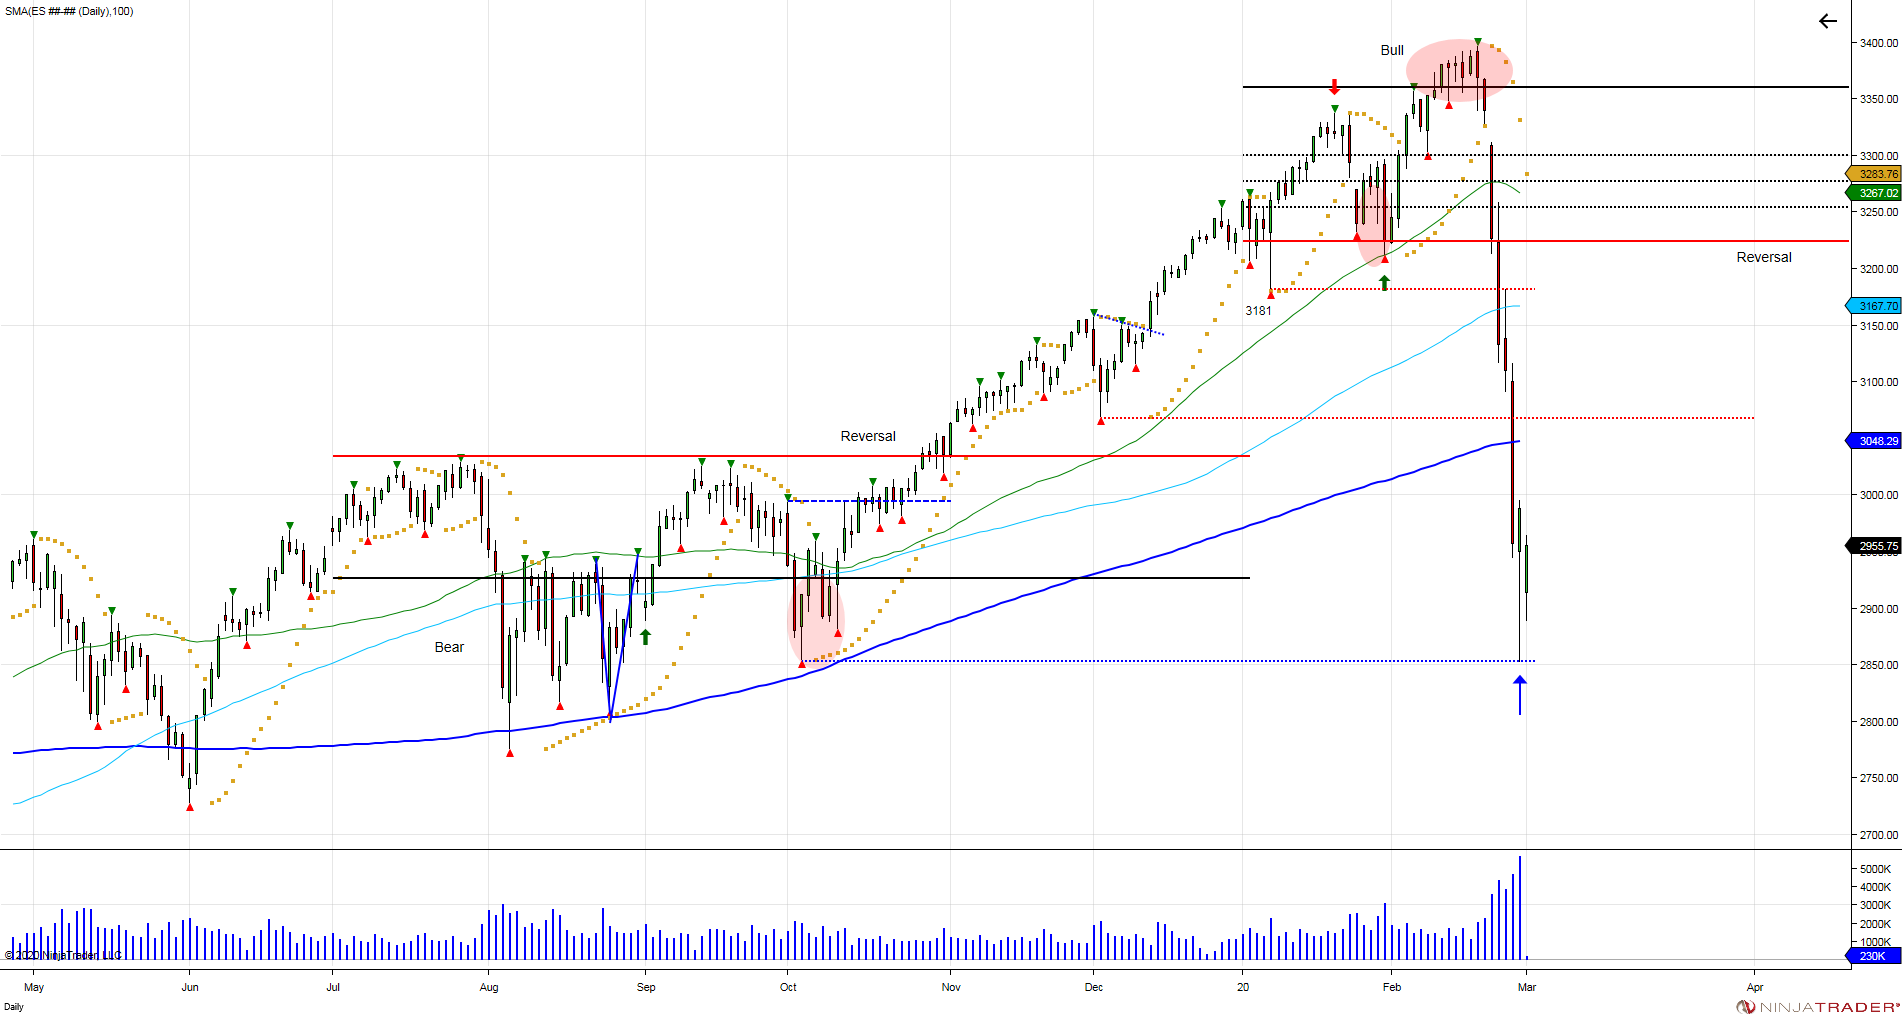
The year 2020 started with a continuation of the rally that began the year before in January of 2019. The 2nd half of 2019 shorts were caught and used to fuel the market into new highs. To start the new year, the market continued on its gains, managing to hold above its 6-month volatility window for exactly 6 days which was the time needed to establish a bullish 6-month bias, and the rug was pulled from underneath, fueled by the fear and pandemic that came to the forefront. As noted on February 20th, 2020, “if one is a contrarian, this is what you’d want to get everyone on the bid to sell into.”


What happened:

ES Daily 2020 03 01 8 11 21 PM


The move was sparked by the news of the pandemic, but fueled by buyers being caught on the wrong side. 


Fast forward to this year…


ES Daily 2021 07 29 8 50 41 PM


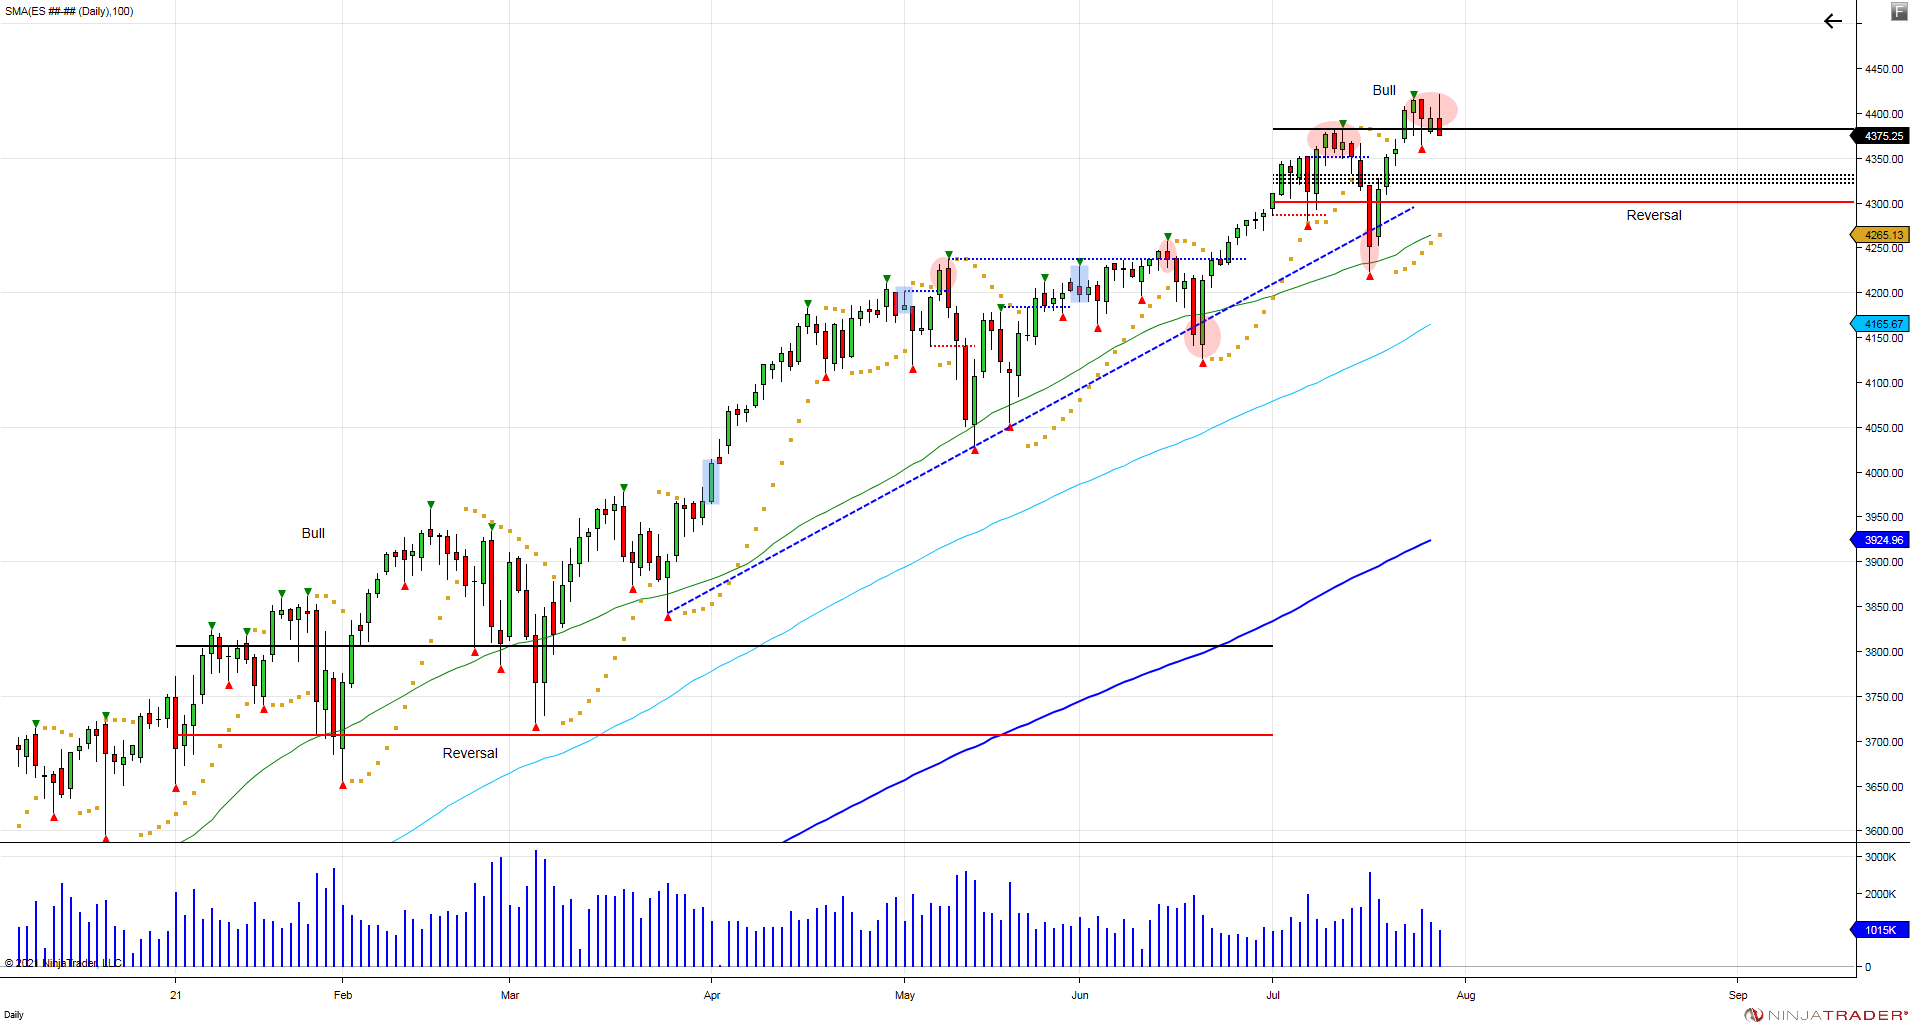
The market began the year by continuing on last year’s rally. Overcoming the January 6 month Volatility Window at 3800, to establish a bullish 6-month bias, and expanding higher into the end of the first half. The 2nd half of the year, July, started with the market making a new high, before correcting down to 4224, which was followed with a bounce-back into a new high. For the 2nd half of the year, 5 daily closes above the Volatility Window of 4382 are needed to establish a bullish 6-month bias. The market managed to do this on Thursday, July 29th, 2021. Just as the bias was set, the market is falling back below the window. Is this setting a trap? The key to the bias is that not only it lures in buyers above the window, but forces buyers to now defend pullbacks to prevent the bias from being reversed. Again if one wants the market to go in the opposite direction, they want everyone caught off guard and on the wrong side, this is what makes the biggest moves as they're unexpected. We will see if history will repeat itself as they begin talking about locking down the country again. By setting the bull bias, pressure is on buyers to defend pullbacks to maintain it and prevent a reversal. A reversal takes place with 5 daily closes below the reversal window at 4302. Doing so, would reverse the 6-month bull bias, have longs caught on the wrong side which can be used to expand the market lower. So long as the reversal window holds, buyers have control and will need to overcome the upper Volatility Window at 4382 again in an attempt to continue expanding higher.

Continue reading
4138 Hits

Will it be different this time?

ES Daily 2021 01 28 9 46 54 PM

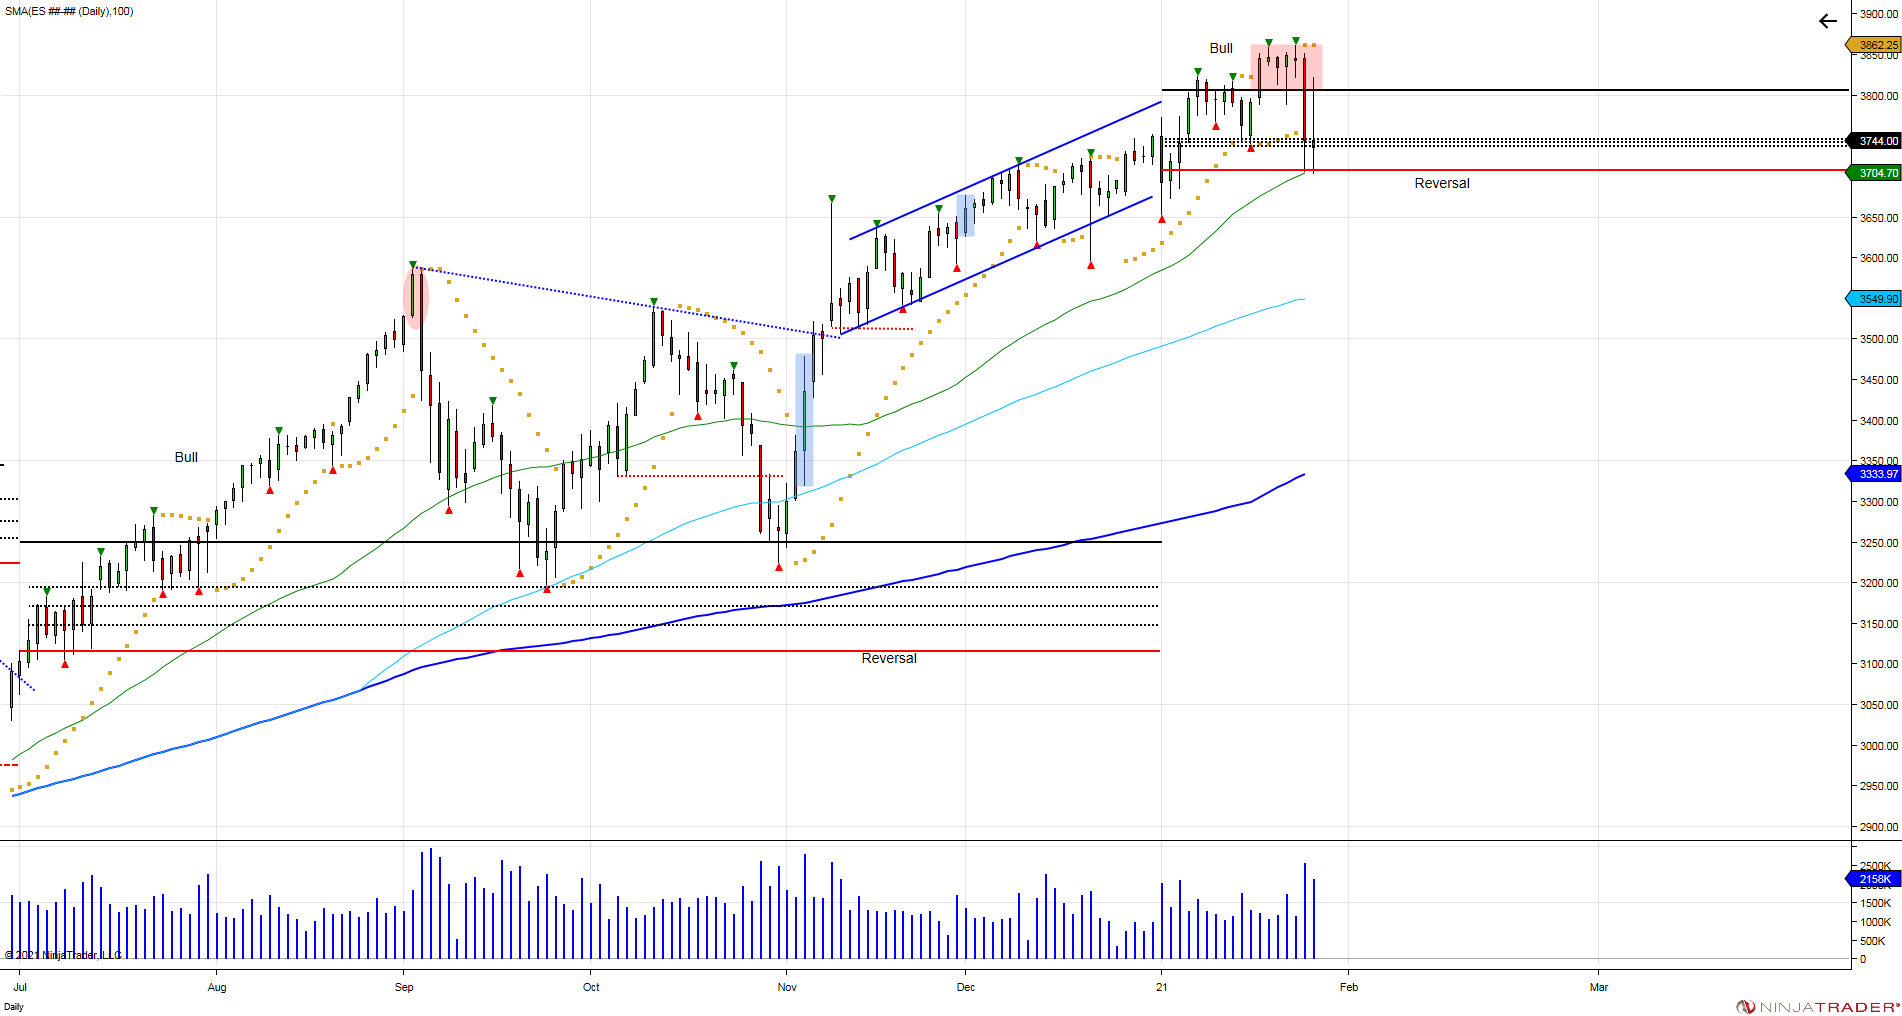
They say history repeats itself, and the recent action in the market may prove that to be true.  Though we will never see the exact same thing repeated, and as we know, past performance is not indicative of future results, what we do know is that human psychology is the same.  That psychology is what produces these patterns that is seen in the charts, whether its greed, or fear. 

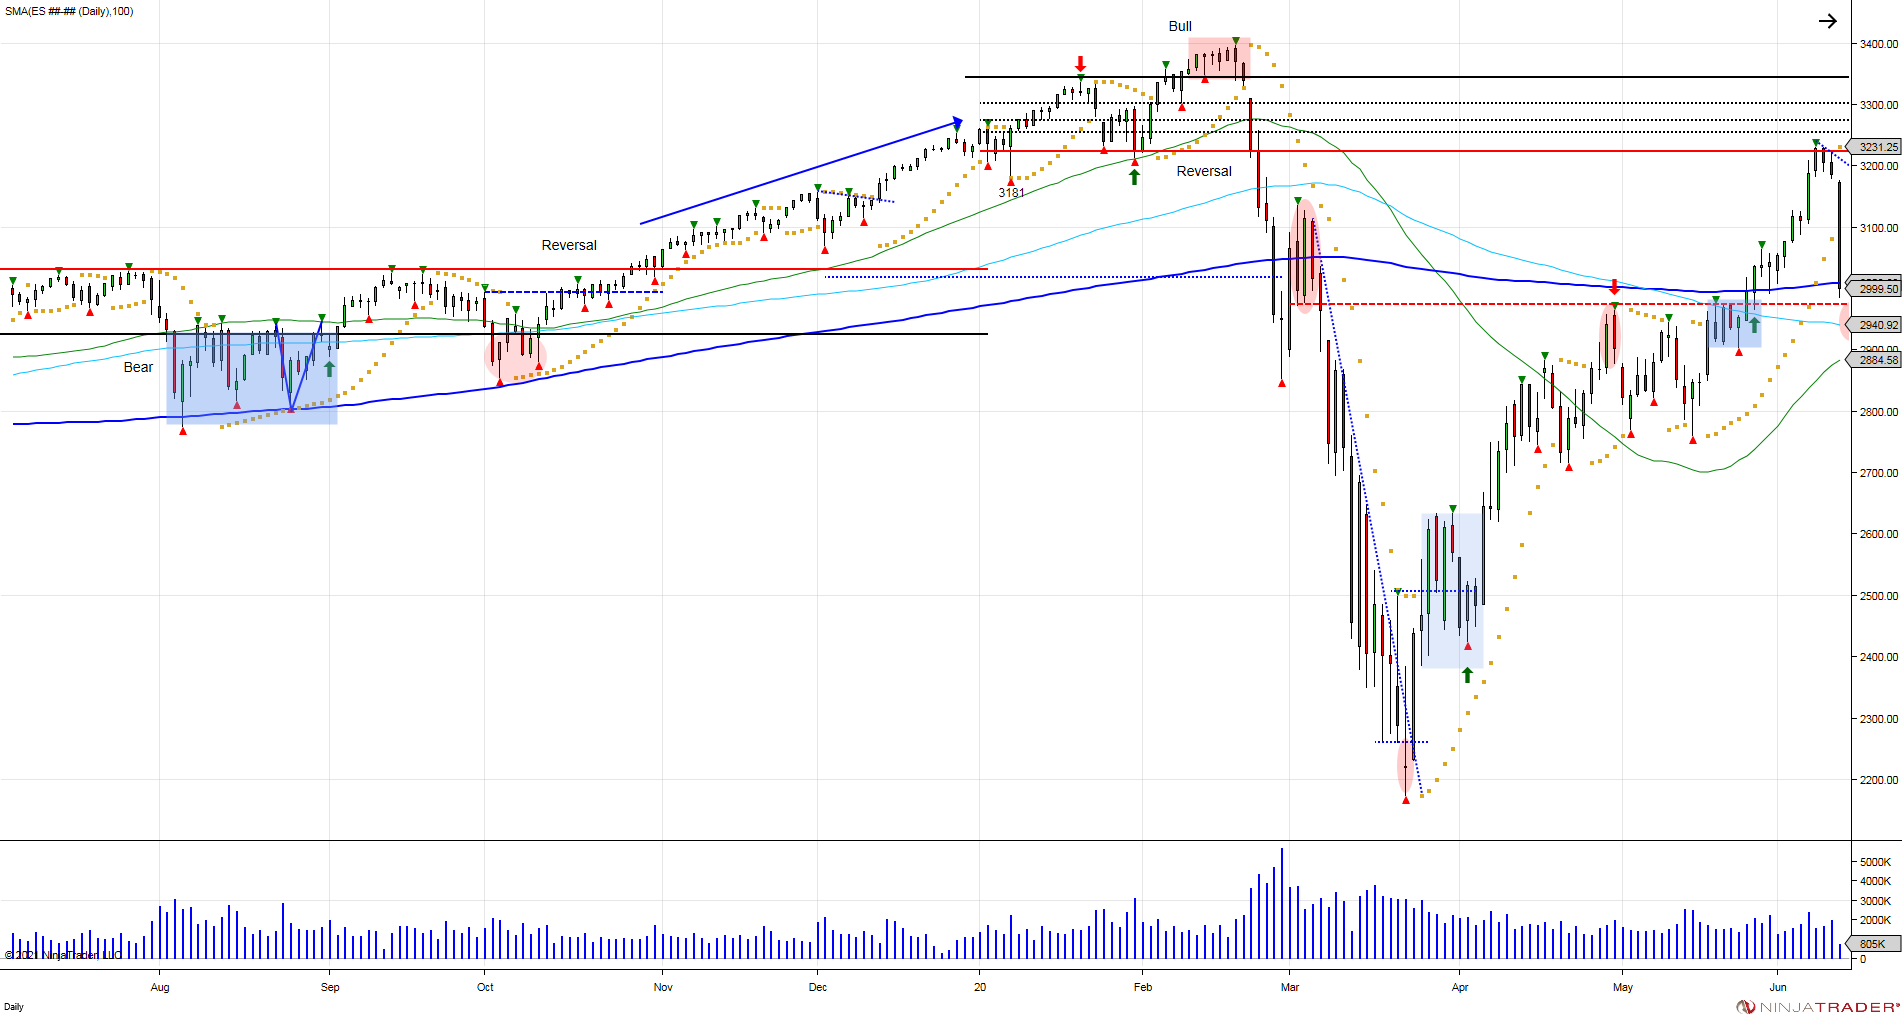
Remember last year we came off a big rally from the prior year (2019).  January and February of 2020 continued onto the rally, luring in late buyers only to trap them as the market reversed its bull bias and used trapped longs to expand the market lower as they were forced into liquidating.  This can be seen here as we warned: http://www.chicagostocktrading.com/blog/sp500-6-month-volatility-window-update.html and http://www.chicagostocktrading.com/blog/sp500-6-month-vol-window-catches-late-buyers-again.html

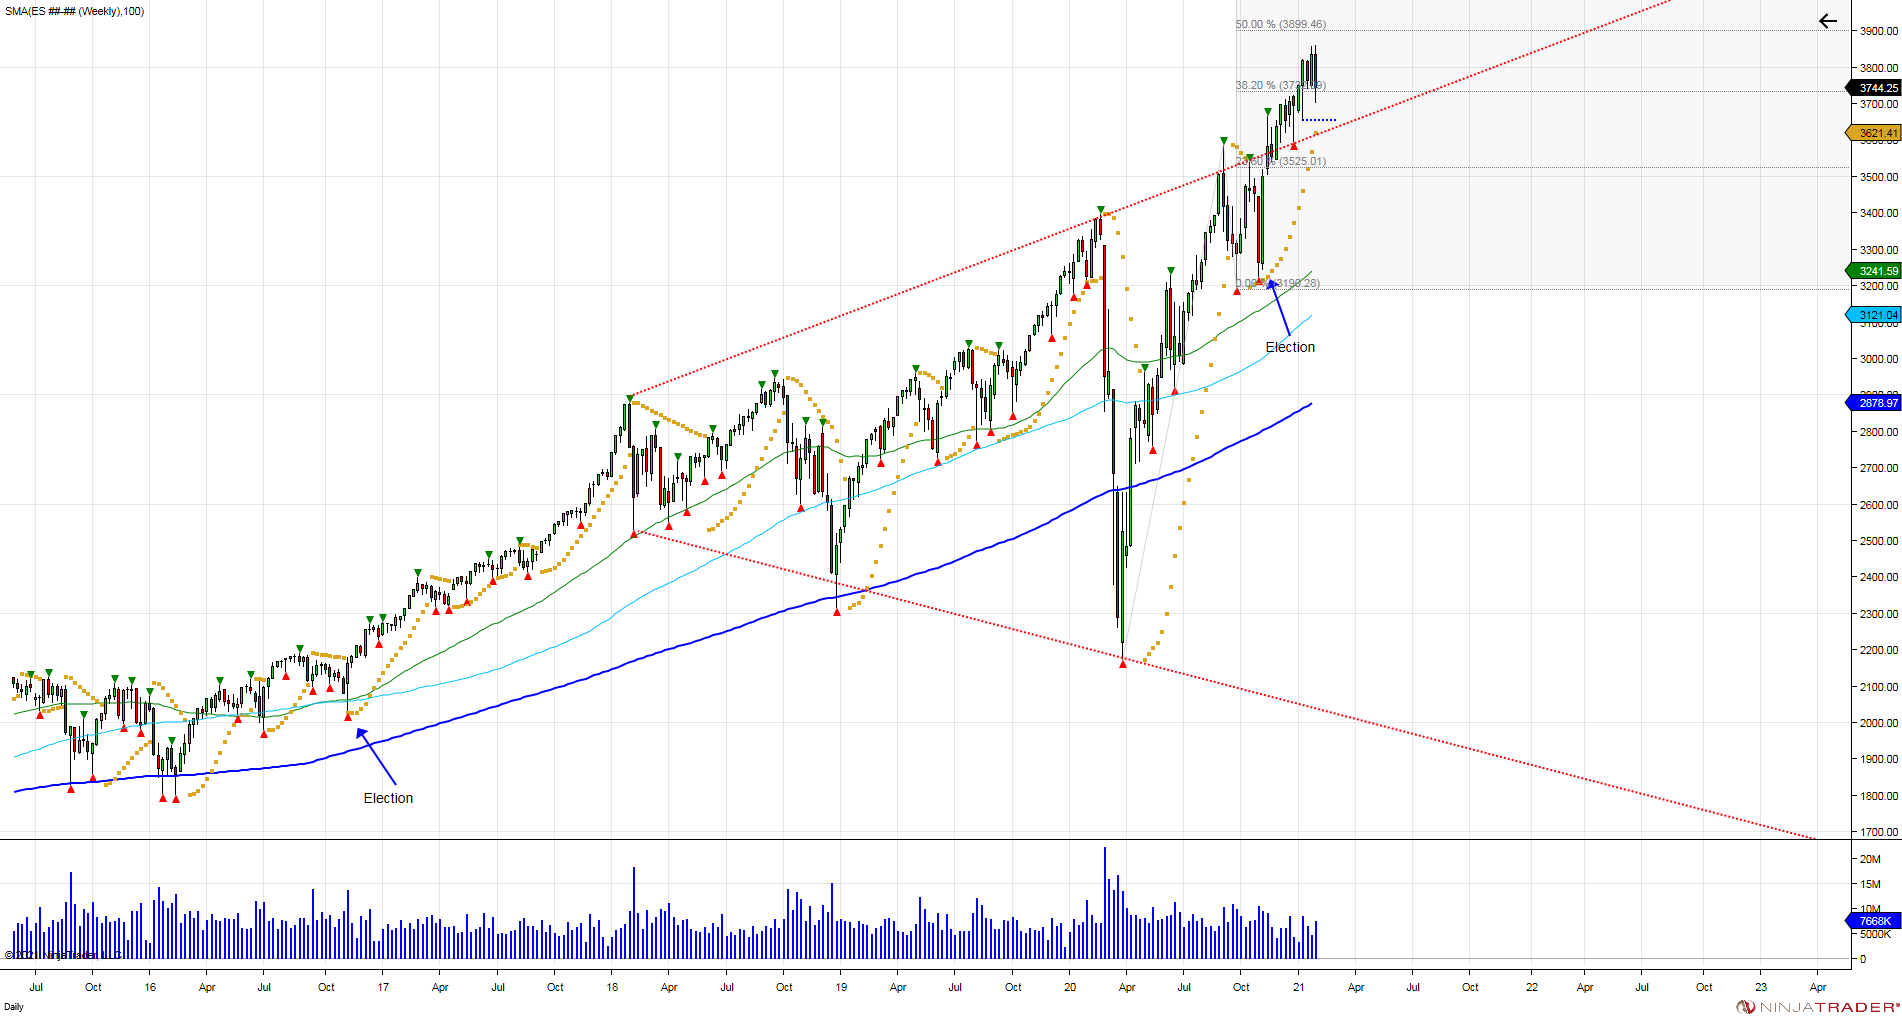
After correcting in the first half of 2020, the market bounced back into the 2nd half of the year.  The start of the second half of the year started with the market breaking higher, establishing a bullish 6 month bias that held 3300 and expanded higher into the end of the year.  The resolution of the election was followed with vaccine news on the 9th of November, which triggered a squeeze through 3600. Since this news, buyers were forced to chase as the market grinded higher into the close of 2020 with little pullback to allow buyers an opportunity to defend the election breakout.  

This year, started with a continuation of last year's rally.  The market began the year with the first trading day dipping down to 3652 before turning higher to consolidate at the highs as the 2 week opening range in January was defined.  The 2 week opening range is what creates the 6 month volatility windows.  After completing the opening range, the rally continued with the market breaking through its upper vol window, holding above for half of the opening range (5days), which establishes a bullish bias.  By establishing a bullish bias, buyers, or one can say late buyers are lured in, and are now forced to defend pullbacks to prevent a reversal from taking place.  The market could not wait a day longer as just as it held above the upper vol window for 5 days to establish a bullish bias, the next day on January 27th the market fell below the window of 3806, leaving longs on the hook above and falling down into the reversal window of 3708.  The test of the reversal window forced buyers to step up to prevent a reversal, seeing a defensive bounce into retesting the upper vol window at 3800 on the 28th of January.  Buyers must overcome this window to recover trapped buyers above to allow opportunity in expanding the market higher.  However, failure to do so, leaves buyers caught above.  As we test the reversal window, 5 daily closes below are needed to reverse the 6 month bull bias, which would mean buyers on the year are caught on the wrong side, and can potentially be used to fuel and expand the market lower.  Should this take place, key support is seen down to 3380 to retest the election low of 3319 that was never tested.  This would allow buyers an opportunity to defend the breakout and into a healthy correction. 


Below is the chart from the first half of 2020.  notice the similar ramp in November-December leading up to the new year.  The new year beginning with a break of the upper vol window that lured in buyers, only to trap buyers and use them to expand the market lower.  Just as shorts were trapped in August of 2019 that were used to fuel the market higher as they failed to expand lower. 


ES Daily 2020 06 11 9 48 46 PM


As individual stock names that are highly shorted are being targeted for squeezes, this is the same thing that happens on the daily, weekly, and monthly basis in the stock market.  The way the market moves is by catching positions on the wrong side, and when they can't retain control and expand the market in their direction, as market moves away from them, they're forced to cover positions, which adds fuel in the opposite direction.  If your a day trader, you see this everyday with the way algos trigger stops, lure in shorts/longs and move the opposite way.  Just as it does so in the bigger picture as shown above.  

Currently, it is buyers that have been forced into the market this month that are on the hook. Buyers must defend pullbacks to maintain control.  One can make excuses for why or how the market moves, however at the end of the day, it's about supply/demand.  If there is more supply caught above then demand, you have overhead resistance and weight on the market where that supply is forced to liquidate, moving the market in the opposite direction.  As always, time will tell and the X factor is the velocity of a move.  


ES Weekly 2021 05 9 55 28 PM

Tags:
Continue reading
3962 Hits