Chicagostock Trading

Chicagostock Trading

Day Trading into Swing

ES 06-12 (60 Min)  6_6_2012_1.jpg 

On Tuesday there was a buy recommendation of 1271 with targets of 1278, 1285, and 1308.  The first 2 targets were completed intraday which allowed to take money and risk off the table by then moving stops to breakeven at 1271 for the last runner target of 1308 to be ran.  The third target or runners are always the gravy or cherry on top of everything as these give profits larger then the first two targets combined. Sometimes they work out, sometimes they don't. However to take out the greed, thought of "should I hold on, should I get out", taking money off the table along the way eliminates this and leaves a position that can continue to gain should the market continue to move in that direction.  On Wednesday the market ran up to 1299 and this was good enough to take off that 3rd target for a gain of 28 handles, totalling 44.5 handles.  Sure enough the market ran to 1308, however no complaints. 
 

Continue reading
3779 Hits

Treasury Charts

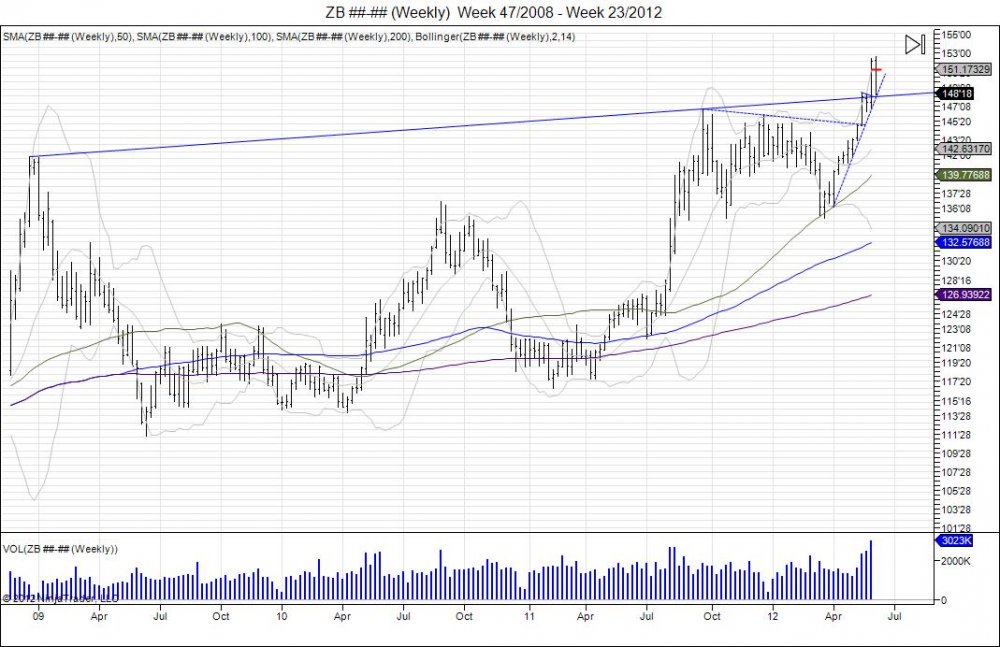
 ZB________Weekly___Week_47_2008___Week_23_2012.jpg

 Following the squeeze above its weekly resistance dating back from the 2009 highs, the market rallied to 15219 before reversing back to this trendline the market squeezed above.  Failure to hold this level turns this move higher into a failed breakout. Resistance comes in up to 15106 where sellers can look to defend these most recent highs with support at 14818-14622, 14508, 13804-13505.

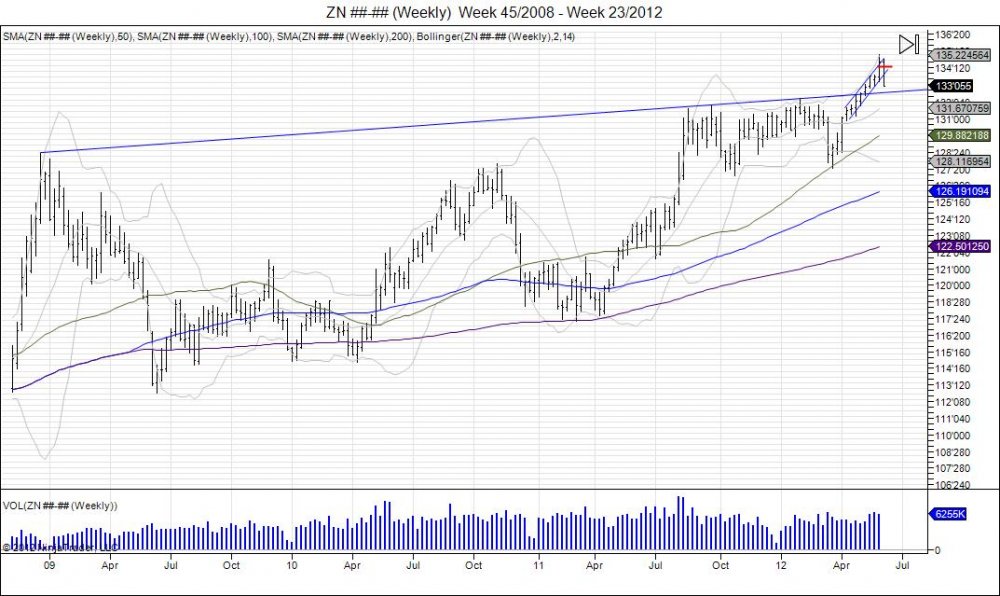
ZN________Weekly___Week_45_2008___Week_23_2012.jpg

 The 10 year has reversed off its highs of 135085 and taken out the lows from this high at 133155.  In turn this has broken the rising channel the market has seen from early April.  A weekly close below 133155 is bearish and turns the level to resistance which gives potential for this latest squeeze to 135085 to become a failed breakout.  Support is seen at this resistance trendline from highs dating back in 2008 within 13217-13106, followed by next major support at 129095-127230 from where this market pivoted higher in March. 

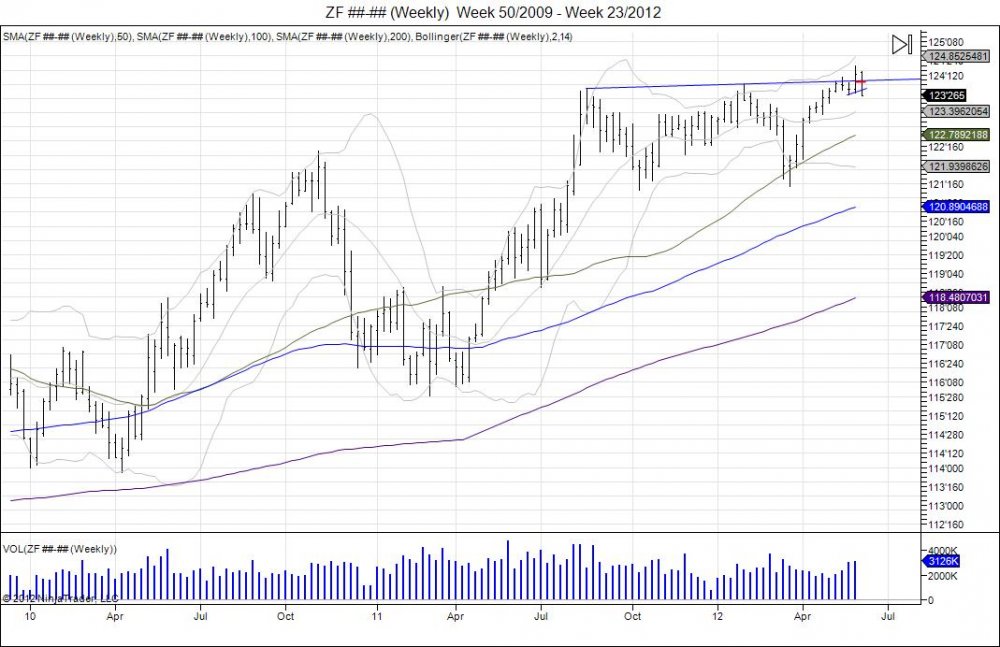
ZF________Weekly___Week_50_2009___Week_23_2012.jpg

Same scenario in the 5 year, a break through resistance from the August 2011-February 2012 highs and a reversal lower to take out the weekly lows off this breakout.  A close below this weekly low of 123285 is bearish and should be used as resistance for sellers looking to defend this breakout.  This turns this breakout into a failed one, with next major support at 123195-123102 followed by 122080-121135 from the March pivot.


Continue reading
2958 Hits

Gold 61.8% and +$126

GC________240_Min___6_1_2012.jpg

 After gold tested its May lows of 1526.7 on the 30th, the market put in lows of 1532.1, holding those lows and reversing.  This showed signs of life and defense of these lows and the market most recently pulled into retest this 1532.1 level with support at 1548.  Today May 1st this was tested with a 1545.5 low and the market held to reverse and squeeze higher.  This move has caught sellers off guard and is retracing to test its major resistance of 1627-1672 of where the market failed in May.  This will be an area sellers must look to defend as a move past 1672 reclaims the ball for gold bulls.  

GC________Daily___11_7_2011___6_1_2012.jpg

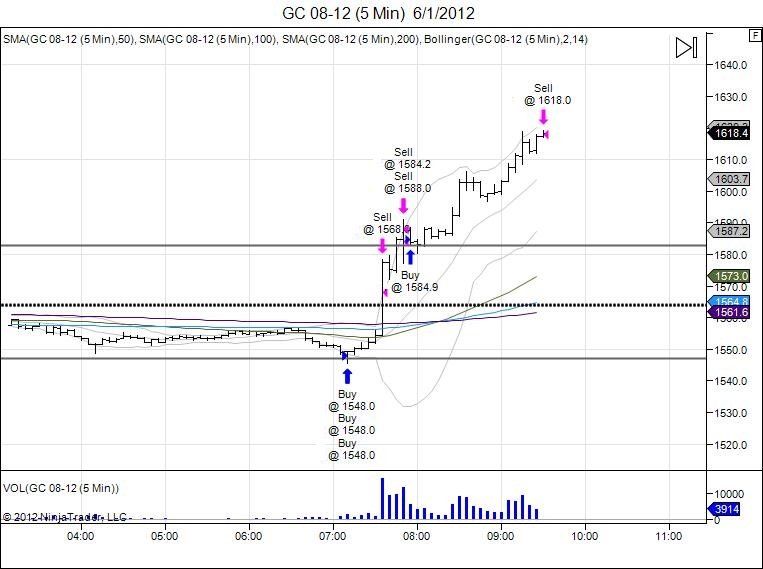
GC_08_12__5_Min___6_1_2012.jpg

Buyers of 1548 level all out on this move for +126 in a day as squeeze has retraced 61.8% of breakdown.

Tags:
Continue reading
3524 Hits

Weekly 30 Year Bonds

ZB________Weekly___Week_46_2008___Week_21_2012.jpg 

Tags:
Continue reading
2121 Hits

Ultimate SP500 Chart 480

ES________480_Min___5_20_2012.jpg 

Tags:
Continue reading
2367 Hits