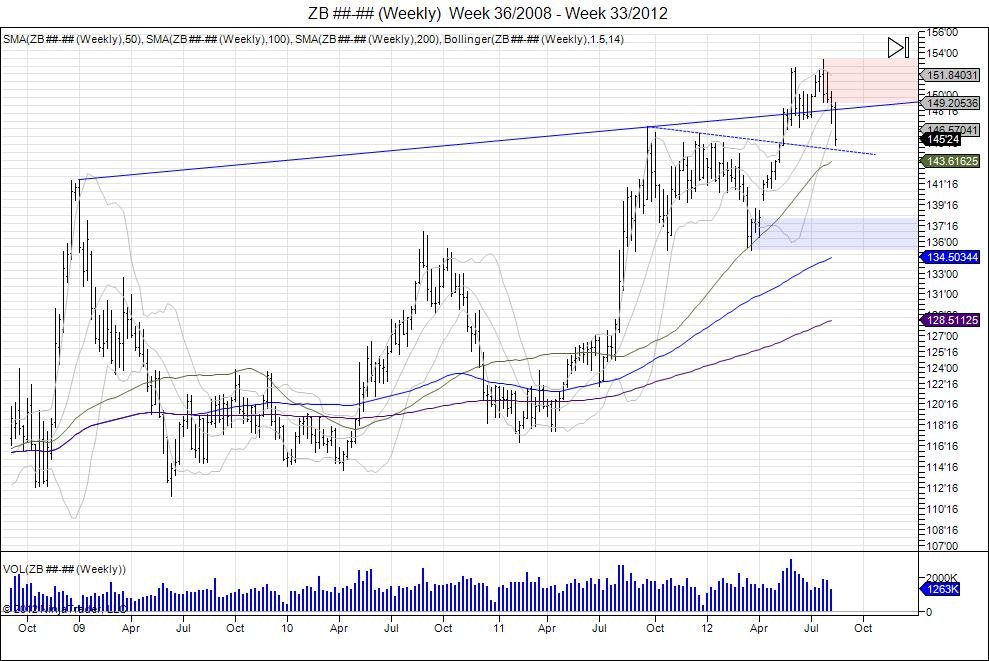
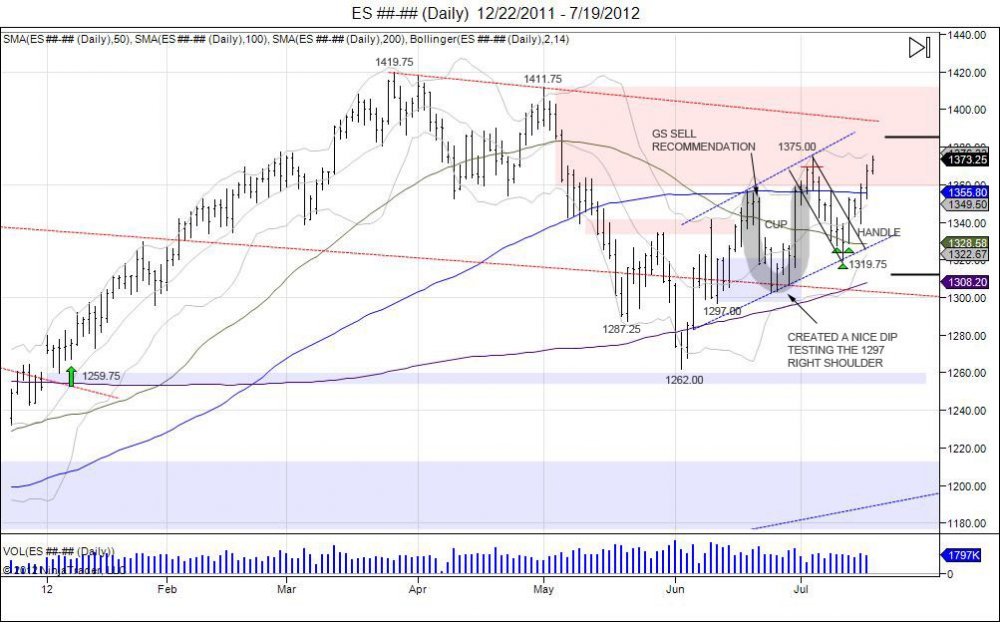
As seen in the weekly chart above, the 30 year bond has fallen back beneath its long term resistance from the January 09 to the September 11 highs. The market attempted to hold above however overbought conditions with the new high in July at 15311, the bond did it's best to squeeze as many sellers as possible. Since this high, the market has rolled back beneath its resistance trendline, failing to hold prices above 14900. The move has brought the market back down to where it broke out May of this year, just as the SP500 clipped the May highs of 1411.75. Stabalization can be seen here, however rallies up to 14900 offer sellers an area to defend with stops above 15311 to look for these recent lows to be retargeted, followed by a test of the year lows at 13505.
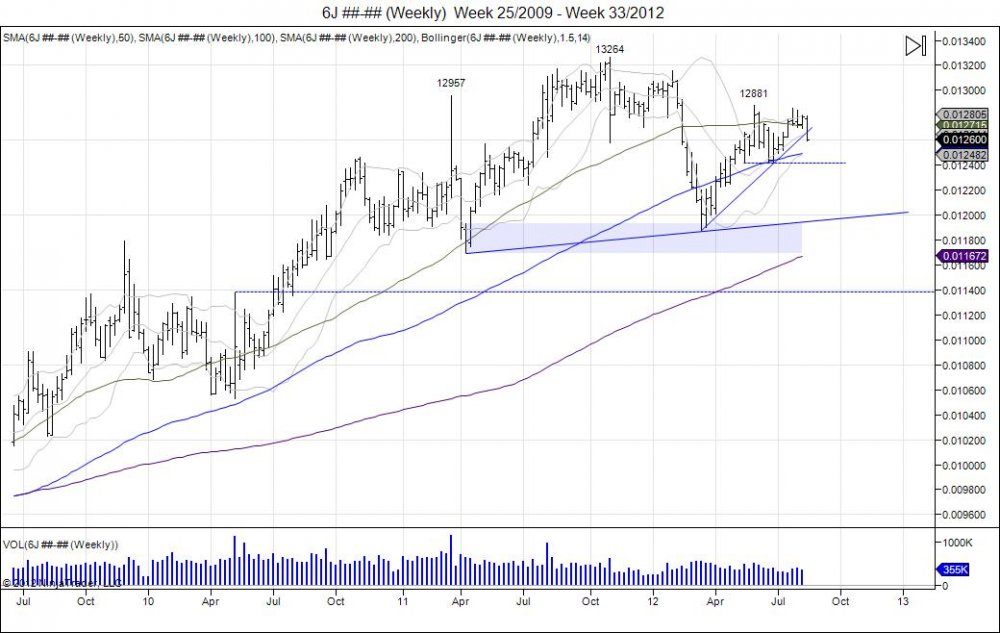
Since the Japanese Yen completed its downside target of 11900 in March of this year, the market grinded back higher, squeezing late sellers, leading to a retest of the year highs and late last year highs. Over the past several months as the Yen rallied up to 12881, the market stalled and has begun to roll over. Aggressive sellers have already taken advantage of this move by fading the highs and covering most positions. However looking at the weekly picture, this retest of last years highs appears to be a potential right shoulder of a larger head/shoulder formation. There is a double bottom at 12416 where a breach of can confirm this right shoulder and see sellers attempt to drive the market down to retest the neckline of 11900 that the market bounced from earlier this year. At that time it was not ready to take out its support of 119-117, thus the short squeeze into retesting the highs. This is the target on the downside with a break below targeting 11375 which retraces the market back to where it broke out during the flash crash of 2010.
