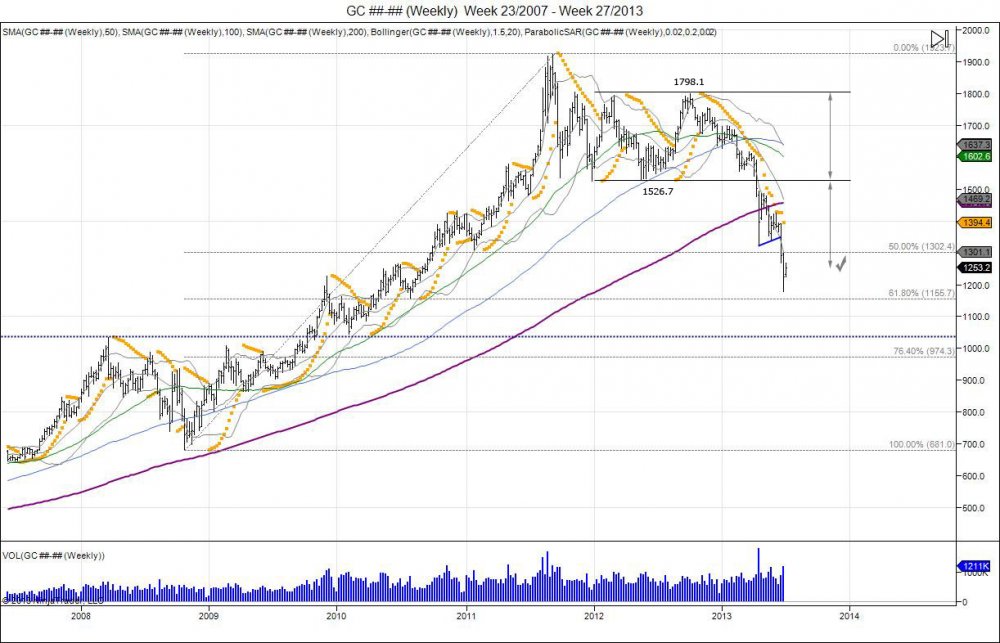
Back in December of 2012 on the 12th, the FOMC released their statement that “… the Committee decided to keep the target range for the federal funds rate at 0 to 1/4 percent and currently anticipates that this exceptionally low range for the federal funds rate will be appropriate at least as long as the unemployment rate remains above 6-1/2 percent…”. This was the first time since having rates at 0% the committee attached an unemployment rate “target”. Since this statement, gold made a high of 1725 on that day, and never looked back. It has been straight down since then. But this was not the beginning of selling in gold. This was just a catalyst for long term holders to take profits. As we pointed out back in December “What’s With Gold? FOMC Spooks Market, Double Top Eyes 1250.” Again this was not the beginning of selling. Gold had a target of just above 1900 when it created a “diamond” pattern in August of 2011. This was a continuation of the parabolic stage the market went in after the debt deal passed earlier that month. Sure enough gold squeezed through 1900 into 1923.7 and reversed down into lows of 1535. This was a major shakedown in the market place and left a lot of late buyers holding the back at parabolic prices above 1700. Throughout 2012, the year was one major consolidation period. After an early high of 1792.7 in March, the market pulled down to put in lows of 1526.7 in May. Not ready to breakdown, the market squeezed shorts and rallied back to take out the March high and print new highs for the year at 1798.1. These new highs for the year once again failed to push past 1800 and the failure turned into a double top attempt. Since this 1798 high, gold has been in profit taking and selling. When the FOMC released their statement in December, this just gave excuse to continue the profit taking and move lower. To start 2013, gold attempted to rally, only to put in highs of 1697.8 and roll over. The reversal in January of 2013 to break the year low of 1626, continued the selling pressure, targeting the 2012 low of 1526.7. With the 2012 low of 1526.7 being taken out in April, this confirmed the 2012 highs against 1800 as a double top. By taking the range of 1526.7-1798.1 or 271.4, this gave a downside target of 1255.3.
Most recently, we have seen gold complete this downside target of expanding the 2012 range down to 1255.3. Of course the market did not stop there and went into further selling as longs panicked and stops continued to be shaken. This led the market to fall below 1200 into lows of 1179.4, almost retracing 61.8% at 1155 of the 681 to 1923 move. The breakdown below 1200 after completing 1255 put the market into extremely oversold levels. The bear in gold is not new, this bear has been around since that 2012 double top, and the trend down since that high has been a $618 decline in prices from 1798.1-1179.4. Short term gold is oversold, thus the bounce being attempted. Gold below 1250 gives investors who patiently waited for prices to turn lower an opportunity to come in and pick up some physical and or invest long term at a 50% discount. Gold remains in major downside pressure until it can close above 1300. Doing so can give way to squeeze late shorts and attempt to retrace the market back to the 2012 low of where the market failed at 1526. This old support should then act as new major resistance, however gives an upside target for buyers sub 1250 to target. Bottom line: As we were bearish gold in 2012, we are now cautiously bullish and like putting some powder to work. Failure to hold 1150 sees next major support at 1126-1045. Regardless, gold was trading 1900 just a few years ago, at 1250, this is a steal. Yes we can move lower, but it will only allow more opportunity to buy at lower prices, and NOT at parabolic prices.
“Buy weakness, sell strength’
RISK DISCLOSURE: PAST PERFORMANCE IS NOT INDICATIVE OF FUTURE RESULTS. THE RISK OF LOSS IN TRADING FUTURES AND OPTIONS IS SUBSTANTIAL AND SUCH INVESTING IS NOT SUITABLE FOR ALL INVESTORS. AN INVESTOR COULD LOSE MORE THAN THE INITIAL INVESTMENT.

