Chicagostock Trading

Chicagostock Trading

Accurately Predicting Gold Trends Using Technical Analysis

GC5_8_9.jpg

(click chart to enlarge)

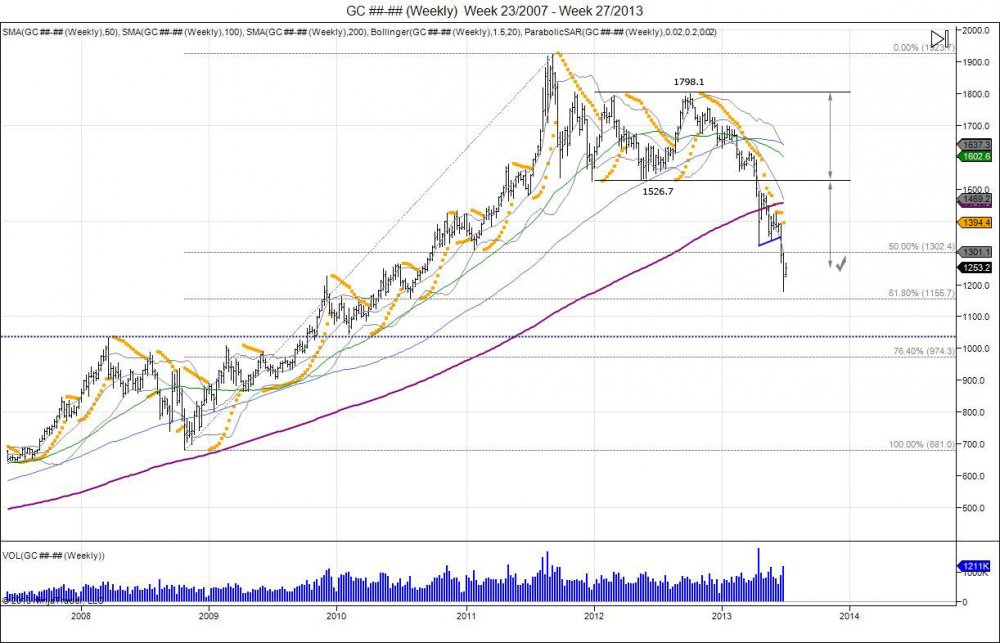
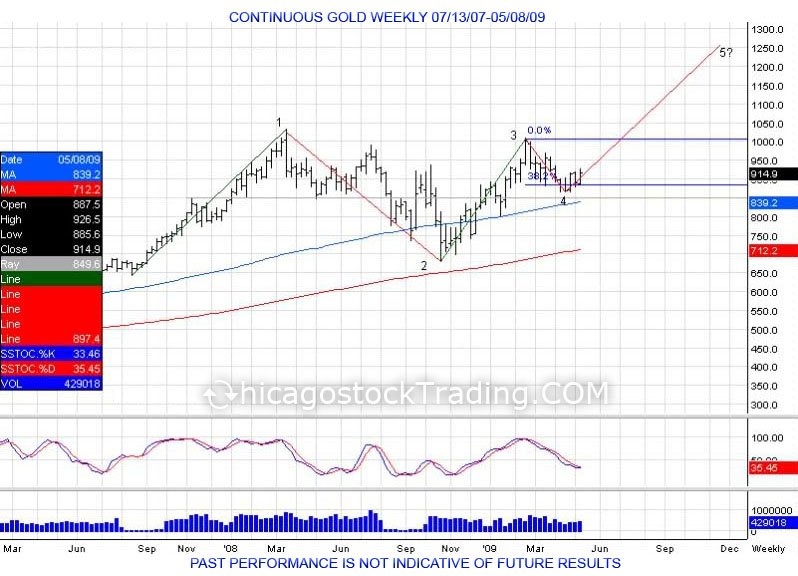
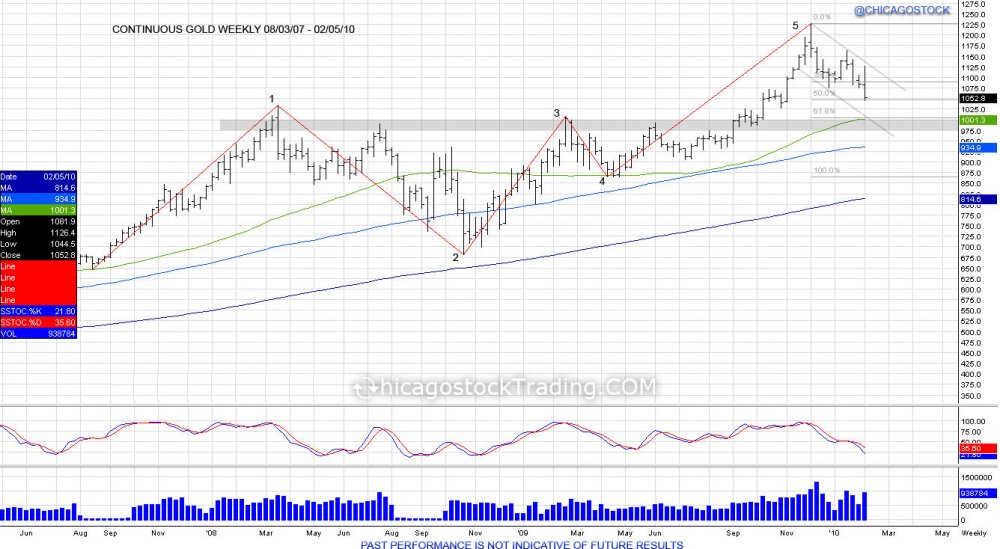
Gold in 2008 was the first time the market breached the $1000 mark, hitting highs of 1033.9 in March just as the Federal Reserve Bank of New York provided an emergency loan to Bear Stearns to keep the company solvent from it's bets in subprime mortgages.  This was followed by a correction and liquidation in the fall just as the equity markets began to crash in September.  The panic and liquidation selling led gold to fall into lows of 681 in October before retreating back to retest the $1000 mark in February of 2009.  This created an Elliot Wave pattern that saw the first wave 651-1033, second wave being the corrective wave from 1033-681, third wave being the move back up from 681-1007, fourth wave which was a very small 38.2% correction of the 3rd wave, setting up for the fifth wave to try and continue higher.


GCTRADE1-2.jpg

(click chart to enlarge)

The fifth wave completed with gold moving from 865-1227.5 just as the Federal Reserve bank lowered their federal funds target rate to 0% in January of 2009.  This gave gold the fuel to move back through $1000 and continue this 5th buying wave to take out the old $1033.9 highs.  Showing gold's strength and proving naysayers who did not see gold breaching over $1000 again wrong.  As the 5th wave completed with highs of 1227.5, this led to profit taking and a small correction as gold corrected 50% of the 865-1227.5 move as well as coming back to retest the old 1033.9 highs with the gold making a low of 1044.5 in February of 2010. 


Continue reading
4978 Hits

What to do with Gold.

GC________Weekly___Week_23_2007___Week_27_2013.jpg

Back in December of 2012 on the 12th, the FOMC released their statement that “… the Committee decided to keep the target range for the federal funds rate at 0 to 1/4 percent and currently anticipates that this exceptionally low range for the federal funds rate will be appropriate at least as long as the unemployment rate remains above 6-1/2 percent…”.  This was the first time since having rates at 0% the committee attached an unemployment rate “target”.  Since this statement, gold made a high of 1725 on that day, and never looked back.  It has been straight down since then. But this was not the beginning of selling in gold.  This was just a catalyst for long term holders to take profits. As we pointed out back in December “What’s With Gold? FOMC Spooks Market, Double Top Eyes 1250.”   Again this was not the beginning of selling.  Gold had a target of just above 1900 when it created a “diamond” pattern in August of 2011.  This was a continuation of the parabolic stage the market went in after the debt deal passed earlier that month.  Sure enough gold squeezed through 1900 into 1923.7 and reversed down into lows of 1535.  This was a major shakedown in the market place and left a lot of late buyers holding the back at parabolic prices above 1700.  Throughout 2012, the year was one major consolidation period.  After an early high of 1792.7 in March, the market pulled down to put in lows of 1526.7 in May. Not ready to breakdown, the market squeezed shorts and rallied back to take out the March high and print new highs for the year at 1798.1.  These new highs for the year once again failed to push past 1800 and the failure turned into a double top attempt.  Since this 1798 high, gold has been in profit taking and selling.  When the FOMC released their statement in December, this just gave excuse to continue the profit taking and move lower.  To start 2013, gold attempted to rally, only to put in highs of 1697.8 and roll over.  The reversal in January of 2013 to break the year low of 1626, continued the selling pressure, targeting the 2012 low of 1526.7.  With the 2012 low of 1526.7 being taken out in April, this confirmed the 2012 highs against 1800 as a double top.  By taking the range of 1526.7-1798.1 or 271.4, this gave a downside target of 1255.3. 


Most recently, we have seen gold complete this downside target of expanding the 2012 range down to 1255.3.  Of course the market did not stop there and went into further selling as longs panicked and stops continued to be shaken.  This led the market to fall below 1200 into lows of 1179.4, almost retracing 61.8% at 1155 of the 681 to 1923 move.  The breakdown below 1200 after completing 1255 put the market into extremely oversold levels.  The bear in gold is not new, this bear has been around since that 2012 double top, and the trend down since that high has been a $618 decline in prices from 1798.1-1179.4.  Short term gold is oversold, thus the bounce being attempted.  Gold below 1250 gives investors who patiently waited for prices to turn lower an opportunity to come in and pick up some physical and or invest long term at a 50% discount.  Gold remains in major downside pressure until it can close above 1300.  Doing so can give way to squeeze late shorts and attempt to retrace the market back to the 2012 low of where the market failed at 1526.  This old support should then act as new major resistance, however gives an upside target for buyers sub 1250 to target.  Bottom line: As we were bearish gold in 2012, we are now cautiously bullish and like putting some powder to work.  Failure to hold 1150 sees next major support at 1126-1045. Regardless, gold was trading 1900 just a few years ago, at 1250, this is a steal. Yes we can move lower, but it will only allow more opportunity to buy at lower prices, and NOT at parabolic prices.


“Buy weakness, sell strength’


Tags:
Continue reading
4134 Hits

SP500 FOMC Headfake = 157075, 153075.

ES________Daily___9_28_2012___6_20_2013.jpg

The SP500 fell down into a major trend line on Thursday based off support from the year lows.  This comes after the market originally broke out in May above 1593 to start the “5th wave” of the year from 1530.75-1685.75.  The highs at 1685.75 completed a 100% fib extension and since touching this level, sell programs from longs have been taking profits into rallies.  We saw the market fall down below 1600 in June twice. Both seeing a sharp reversal as the market squeezed shorts selling lows.  The last reversal on the 13th was much more violent.  It led the market to take out its 164850 high from June 10th by .50 as the market put in highs of 164900.  This turned into a failed breakout as sellers who stopped selling awaiting the FOMC statement, returned following the release.  They resumed taking profits in the market as the Fed continues to outline its strategy for exiting.  Why wait until the last minute when they are already hinting they want to slow down purchases? This is the case, especially after running up from 1438 this year and into 1685, 17%.  The resumption of profit taking post FOMC caught many off guard as it created that head fake above 1630, leaving shorts on the sidelines and buyers forced to exit the failed breakout. This is what has led to the fast chase into 1577 seen Thursday, just one week following the major reversal off 159175 and into 163350.  Going forward, this breakdown has caught many off guard and many are still not short the market.  This means the downside pressure continues to not allow shorts in and continue to press against next major support levels.  As the market retraces into this old 1593-157075 support range that led to the breakout in May, sell stops are seen below this range under 157075, being the lows late April that developed the support to breakout higher.  Breach of these stops takes the market to test its 100day moving average on the daily chart with next major sell stops being under 153075 as the pivot low in April that led to the 5th wave higher.  Once this low is taken out, then the market confirms the 5th wave is completed and that the move above 1593 is a potential for a failure.  This is the level (1530) one can look for support and to defend the market for a retest back to the 1593-1600 level to see if the market can regain above the level or turn support into resistance to start an abc corrective pattern following the 5 Elliot waves of the first half of the year.  New upside resistance now comes in within 1600-1610, followed by 1620, 1630, and finally 1640.  Move above 1649 is needed to derail the downside momentum and look for a retest of the highs.  Once 153075 fails, we are looking for a bounce into 1600 to create a right shoulder for a head/shoulder topping pattern. This 1530-1685 is a 155 point range which gives room to the downside at 1375.  However first thing is to fill the gap that started 2013 at 1420, followed by the 1375 support level. Thereafter, the market still has a gap from 2012 at 125250 that has yet to be filled. 


ES________Weekly___Week_32_2007___Week_25_2013.jpg


Tags:
Continue reading
1924 Hits

SP500 Johnny 5 Update

Who is Johnny 5?

Latest wave in SP500 1530.75-1685.75:

(click chart to enlarge)ES________480_Min___5_28_2013.jpg

SP500 8 hour chart above showing year to date trade.

First 6 months of 2013 = 5 waves:

Wave 1: 1438.25-1530.00 +91.75 6.4%

Wave 2: 1530.00-1481.75 -48.25 3.1%

Wave 3: 1481.75-1593.00 +111.25 7.5%  AVG VOLUME 9,436,701 

Wave 4: 1593.00-1530.75 -62.25 3.9%

Wave 5: 1530.75- *1685.75* +155 10.1% AVG VOLUME 9,344,753


Since blowing through 1593, the chase trade by buyers and short squeeze pushed the market to complete its 62.25 range (1593-1530.75) up to 1656.  This did not stop with the SP500 pushing through this, 1666, and into the top level of 1685.50 to extend the range 100%.  As shorts capitulated through 1673 into 1685, bulls used the bid to take profits into.  This led to a 3% decline down to 1632.75, shaking out the first 1646 level of sell stops.  The move was fast after the bear capitulation as sellers had to now chase.  With market falling into 1630s, bears chasing lows have been grinded out as market has used these bears to run stops above 1655 and into testing the 1670 level being where the SP failed off the high. The move has given more patient bears there chance to get in, now its up to see if they are stronger then this bull.  The bull has support at 1654 and sell stops below 1644.  Sell side gains ground with break of 1644 to retarget the 1632.75 low to confirm move above 1655 was failure.  Buy side needs to hold 1655 to continue pressure to retest 1672.75 from today's failed high.

Below is an excerpt of the 5th wave description in "Wikipedia"

"Wave 5: Wave five is the final leg in the direction of the dominant trend. The news is almost universally positive and everyone is bullish. Unfortunately, this is when many average investors finally buy in, right before the top. Volume is often lower in wave five than in wave three, and many momentum indicators start to show divergences (prices reach a new high but the indicators do not reach a new peak). At the end of a major bull market, bears may very well be ridiculed" (Source: Wikipedia - Elliot Wave Principle)

Ofcourse, this looks exactly like text book, wave 5 everyone is bullish, average investors forced to chase above 1593, and volume thus far has been lower then the 3rd wave. The 5th wave momentum continues until the pivot low of 1530.75 is taken out to confirm move above 1593 was a failure.

Same chart above, zoomed into last wave 1530.75-1685.75 (click chart to enlarge):

ES________480_Min___5_28_2013a.jpg

Continue reading
5090 Hits

Euro and the 200day


6E________Daily___5_24_2012___5_28_2013.jpg

The Euro has closed below its 200day moving average 9 days now since breaking below in May.  This comes after an initial attempt to break the average in April was followed by a reversal off new year lows of 12751 that closed the market above the 200day.  This turned the break of this average premature and caught shorts below trapped as the market ran into 13200 to run stops from March.  Since then, the Euro topped on the 1st trading day of May at 13248, as the 200day moving average slowly caught up to make a tight range.  With the failure to hold the pivot low of 12959 from April 24th, the Euro broke its 200day moving average, and this time around the market is getting comfortable under this level by slowly turning the average which is strong support, into new resistance.  This was seen last week as the market spiked up to 130, touching the bottom of the 200day, however failing.  This consolidation pattern has created a bear flag as a tug of war is taking place by turning the 200day average into resistance, and working to gather strength to break the April lows.  With this, the 50 day moving average has also began to cross the 200day average, also known as a "death cross".  Breach of April lows confirms the bear in the Euro which should continue to find its 200day average weigh down to attempt a retrace into 124 which is where the market broke out last year.  12906-13000 offers new area of resistance for this momentum, followed by 13075-13200.


6E________Weekly___Week_33_2011___Week_22_2013.jpg

The weekly Euro chart shows a different picture. With last week's attempt at the 200day on the daily chart with highs of 130, shows the market held below its prior weekly high and closed below the prior weekly open, to establish an "inside" week.  This has led to continued weakness as this week has began, in attempt for sellers to target last week's low of 12822.  Closing below this low on the weekly confirms downside to target the rising trend line for stops and eventually the November lows at 12665.

Continue reading
3573 Hits