YEN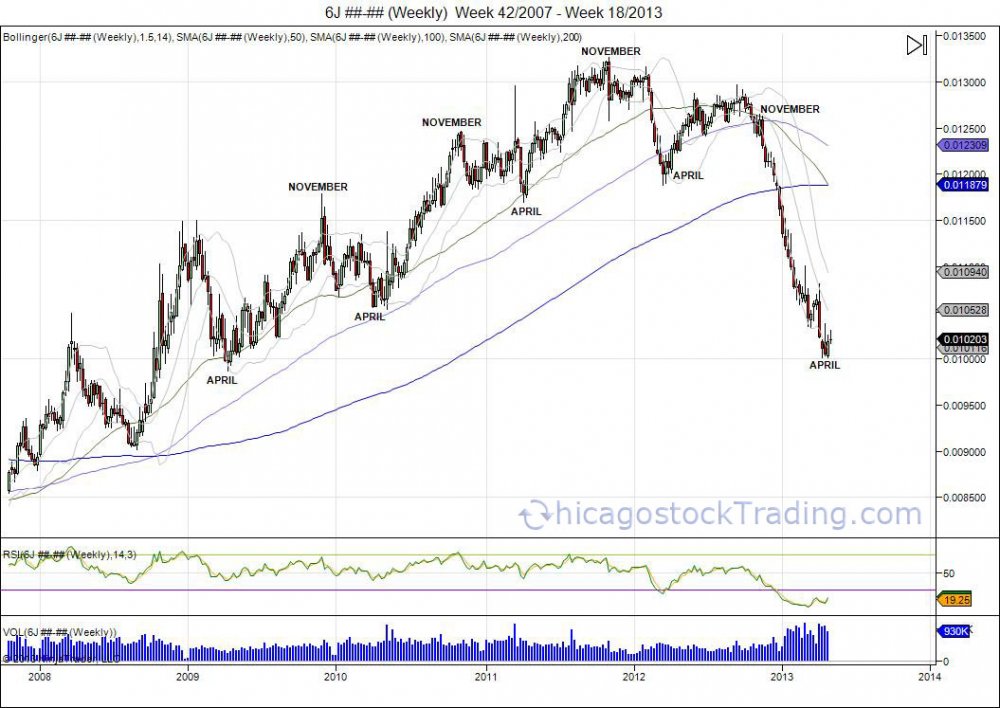
DOW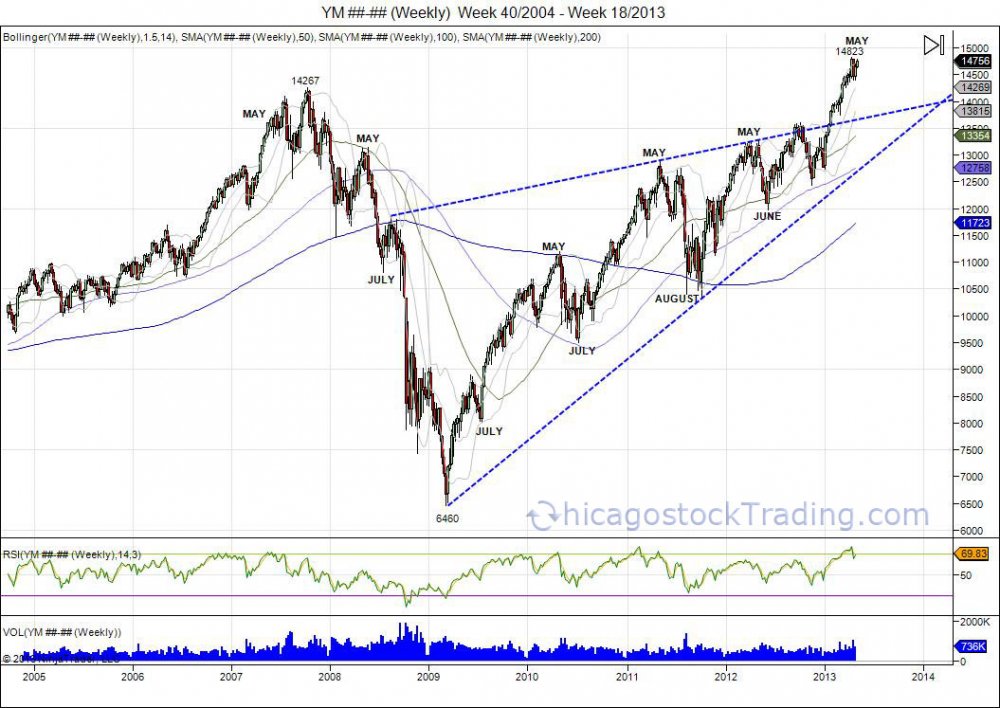
2864 Hits

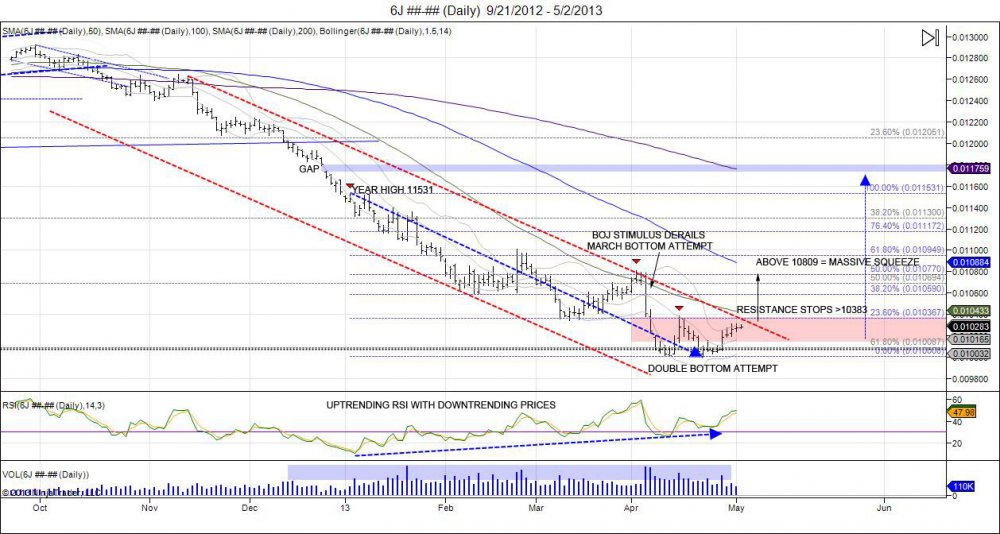
Yen is trying to round out a bottom. After retesting lows and not breaking, the Yen is back to retesting where it failed from April 15th with highs of 10383. This has led to a pause in the market as it consolidates builds support to continue the pressure against this level. Support is seen down to 10150 ever since the market squeezed the level and turned on the short squeeze. Squeezing above 10383 confirms double bottom and gives room to target 10883 from where the market failed early April as the Bank of Japan came out with stimulus, derailing the March bottom attempt. By coming back to this level the yen will have rounded out a bottom from 108-100-108, leaving shorts who sold the BOJ stimulus wrong. This will turn the level into support as the market will also retrace 50% of the year highs 11531-10008. Recovery above 108 will attract buyers to press the gas against shorts to target year highs of 11531 and fill gap up to 118 from November.
During the past 4 years the Yen has had a tendency to bottom during the Spring months.
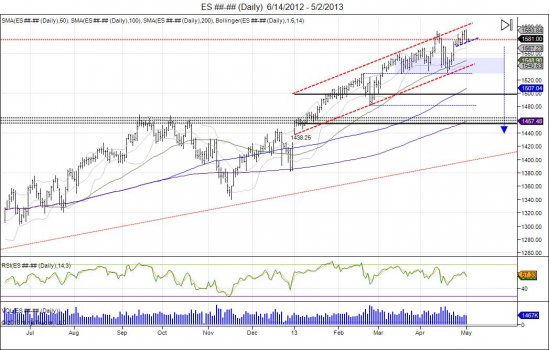
Equities were squeezed to new highs on the last day of trading in April as equity shorts threw in the towel. This led the Emini SP500 to take out the previous high of 1593 and put in new highs of 159550. Nasdaq completed the squeeze of taking out last year's highs of 287175. To start May, equities reversed sharply off the highs to close below Tuesday's lows. These lows now act as major resistance and what buyers need to overcome to retest highs. On the ES daily chart, the breakdown setup an outside bar bearish reversal, by opening above previous day making a higher high and closing below previous day's lows. The breakdown was fast and sharp as shorts had already thrown in the towel the day before, so they were left behind, having to come back and offer the market down as they chased back in. This gives way for the SP500 to test support down to the mid 1550s of where the market broke out after putting in a 153075 low in April as sellers failed to break the Cyprus 152950 low. Shorts have already been cleaned after failing this breakdown and ralling to take out the highs and squeezing them out. Coming into this range of support allows buyers opportunity to defend and continue the upside momentum. Failure to hold and breach of 153075 confirms a double top with room to target the year lows. Once the SP500 takes out the year lows, prices above 1440 will not be visited for a long time. A Yen short squeeze will put pressure to make this break take place.
On Wall Street, the old saying is the markets like to climb the wall of worry, and they have surely done so this year moving higher in the face of all negativity along with two attempted breakdowns in February and April. These are what we call "cracks". We like to say the market climbs higher on glass stairs. Reason being is ever since the 08 crash and 09 bottom at 665.75, the market has been VERY fragile and on life support through the Fed. As we have seen, the glass stairs have been broken several times since the ride from the 09 lows and each started with cracks first before falling through violently, flash crash and debt downgrade in 2011. The recent February and April corrections were the first cracks in this latest climb of glass stairs.
The Ultimate Short Squeeze 665-1441 & Accurately Predicting Every Correction Using Technical Analysis
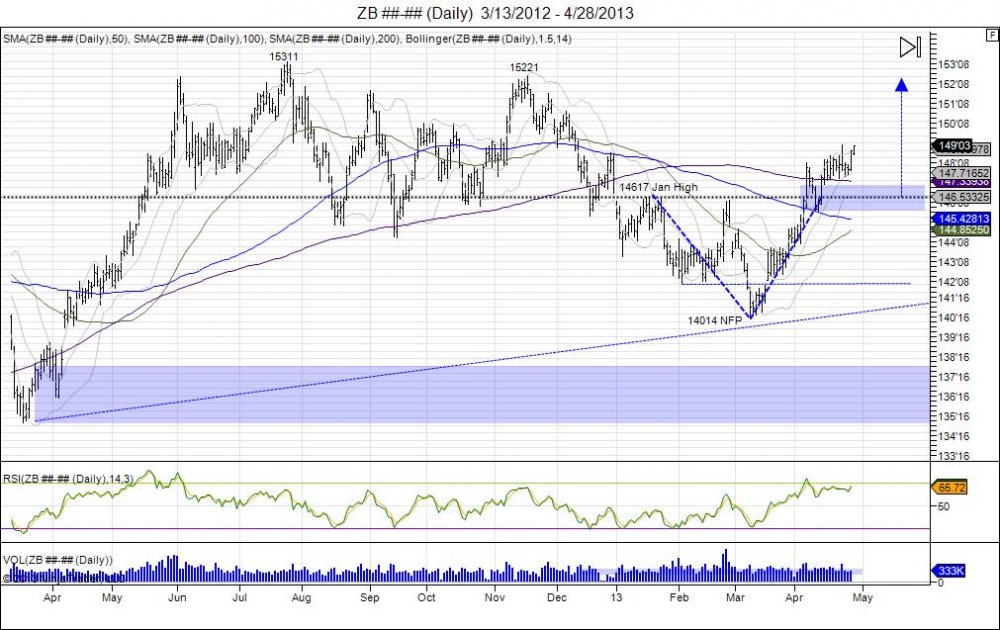
The 30 year bond has consolidated above 14617 in an effort to hold above the year highs after seeing a massive short squeeze that reversed the market from the year lows of 14014. Squeeze was fueled by shorts as the market broke below the February lows on the March NFP release to put in these lows, the market saw a recovery the following Friday going into the "Cyprus bailout". Cyprus news led to gap above 14200 turning level into a failed breakdown as market continued to force shorts to cover until the year high was taken out. The move caught many off guard and in turn cleared out shorts in the market. By holding above 14617 the market now tries to build a base of support to attract buyers that neglected bonds for stocks earlier in the year. The market sees major resistance against 14923. Taking the range of 14617-14014, gives way to push toward 15221 high from November. Just as the Yen tries to target its November gap.
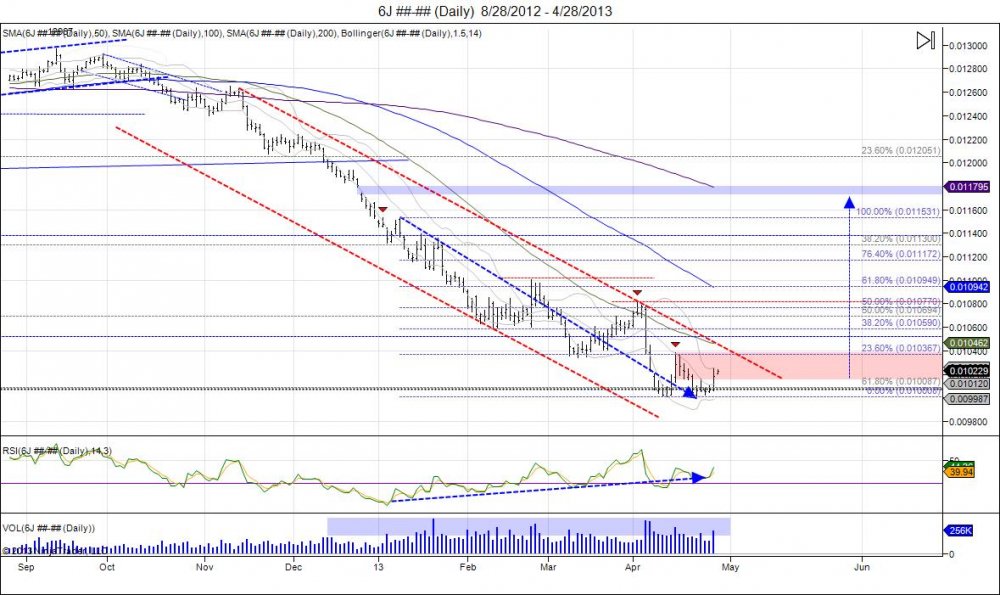
Yen and SP500 show almost exact contrast comparison. As Yen tries to double bottom in April, SP500 is trying to double top. The Yen made lows of 10008 and 10013 before squeezing through 10158 last week. This level has turned into a new area of support should the double bottom be good. Holding above 10150 gives room to force shorts to cover to give room to take out April 15th's 10383 high with next major level of stops above 10809 from April 2nd highs. Above 10809 confirms double bottom against 100 to give way for a massive short squeeze to target the year highs at 11531 and give room to fill last November's gap at 11790. During the past 4 years the Yen has had a tendency to bottom during the Spring months.
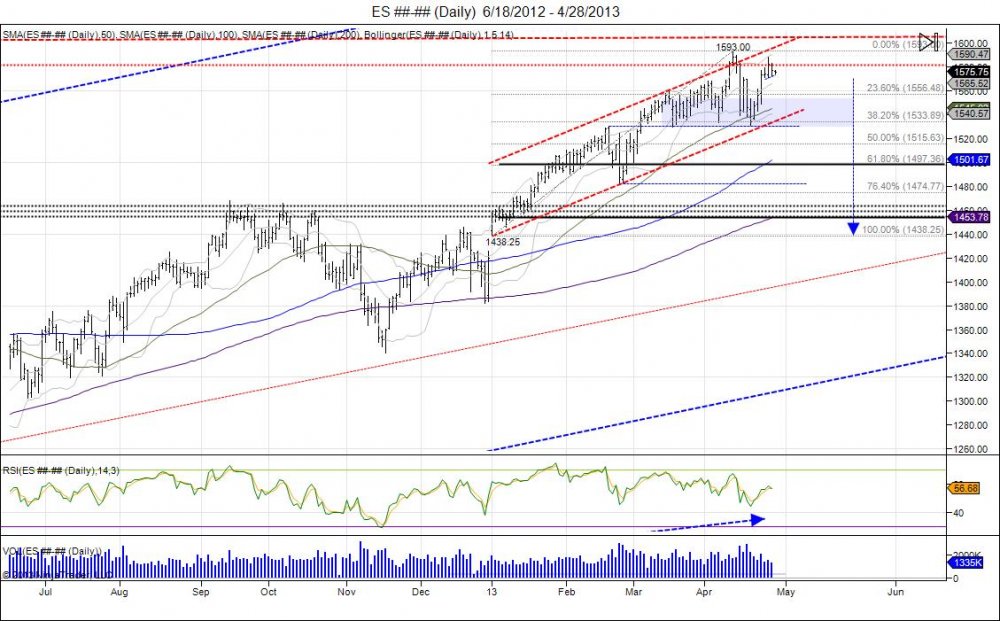
In contrast the SP500 has a small double top as market most recent reversed from 153075 to retest 1593 by making a high of 158825. As the market hits it's head against this resistance it has managed to hold above 1570 to create a very tight trading range. Move past 1588 is needed to retarget 1593 for stops. Break of 1570 gives way to test support at 1555 based from the 153075 pivot low. Taking out this low would confirm the double top to give way to cross the "line in the sand" from the Cyprus lows of 152950 which have held like a rock. This is line in the sand, just as 108 is the line in the sand in the Yen and 14617 was in bonds. In contrast to the Yen with the gap at 11790, the SP500 has a gap down to 142575.
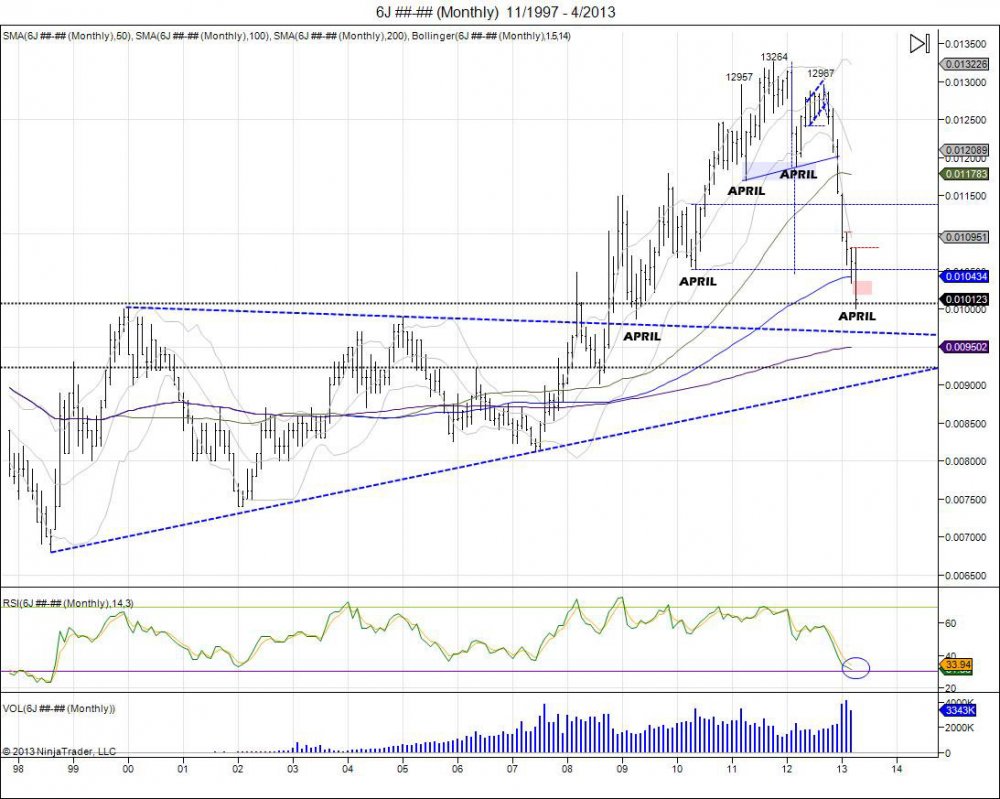
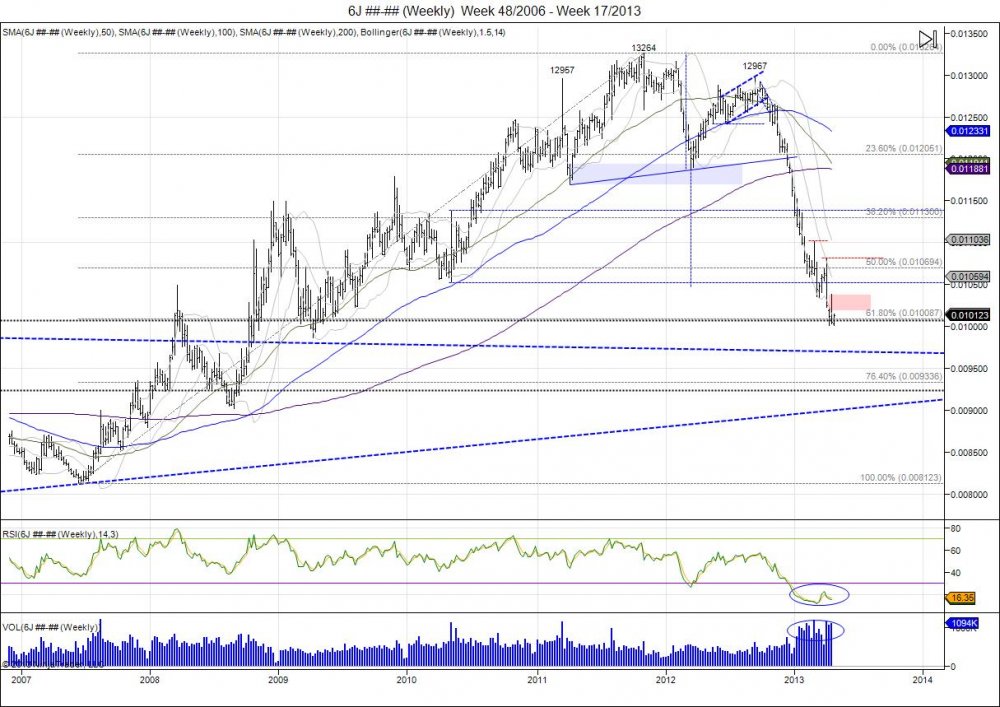
The Yen's failure to take out 13264 in 2012 and build of a right shoulder at 12967 that led to the neckline of 11879 to be broken, has now surpassed it's head/shoulder target of 10494 as the market broke below the May 08 lows during the "flash crash". The break below this has seen the Yen's breakdown extend into a 61.8% retracement of the 2007-2011 move from .008123-.013264. This has cretaed a period of consolidation as the market now fights to hold this .0100 level. As we see on the weekly chart, RSI extremely oversold and volume extremely higher.
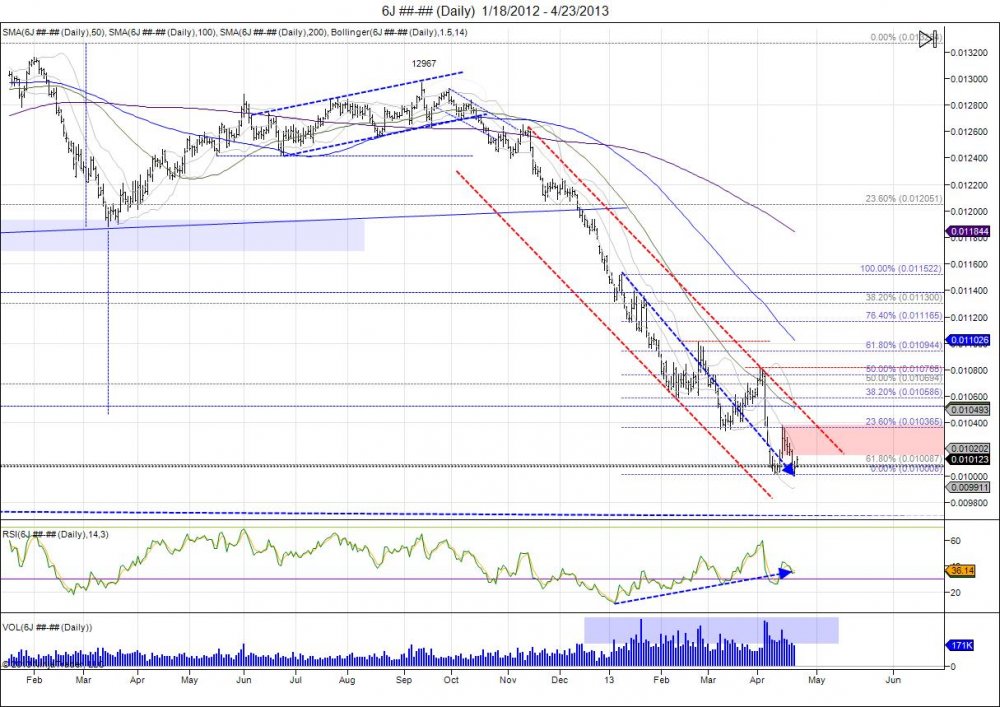
Looking at the daily chart, since the beginning of the year with the Yen breaking down, the RSI conversely has moved higher. All this on extremely high volume. This divergence gives way for the idea a bottom may be taking place and a massive short squeeze can be coming. So we will look at the numbers. First we remain in a major downward channel since the right shoulder was made up at .012967. As the Yen failed to hold onto March's lows at .010340, this led to a drop into the 100 level with lows of .010008. The market bounced off this level right into retesting the March lows which have turned into resistance. This has led to another retest of the .010008 lows as the market fell into .010013 this week. Pressure is being placed to retest these lows and see if the market can flush below to attract new sellers and shake out new buyers of these levels. Major resistance is now within the .010150 up to the .010383 April high that failed at the March lows. Squeeze through this is needed to spark the short suqeeze and give way to test upside retracement levels based on the year high of .011522 with a 50% retracement coming in at .010765 level. Should a short squeeze trigger into the 50% level, at this point a move through the year highs would give way to fill the gap from last year at .011804 from December 24th. Failure to hold onto the .0100 level gives way to pressure against .009867 from April of 2009 with next major support coming in at .009231. Since that low of .009867 in April of 2009, every major low has been made in April or within a month apart. The question will be if the .0100 level is held before a squeeze or a flush followed by a reversal.
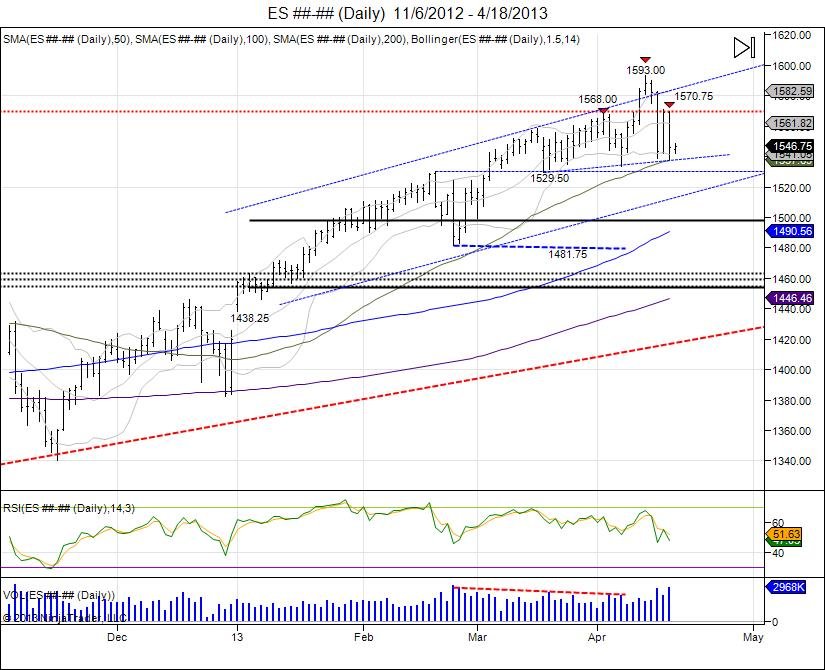
The market fought gruesomely in squeezing out shorts as sellers were attracted following the Cyprus breakdown. This led to a major tug of war, making higher lows and higher highs until 1568 printed and the market reversed into the April NFP report to shake out the series of higher lows test 152950 and hold. Once again luring in shorts thinking the 1568 was the top, only to see a massive short suqeeze taking the market through the old 1568 high to stop early shorts and print new highs of 1593 as the all time highs of 158675 were taken out.
Since taking out all time highs, the market fell back to retest where it broke out above at 1568. Old resistance failed to hold as new support as the market fell below 1568 which saw next level of support tested at 1555 from the April 5th NFP highs. The market attempted to stabalize this level, however with the Boston tragedy, selling pressure drove through this down to retest the NFP low of 153325 as the market held at 153875. This hold led to a bounce back on Tuesday, resetting the market as it came back to the 1568 level to allow sellers a bounce to defend and buyers another oppurtunity against the highs. Buy side failed to materialize and hold 1568 which in turn has seen sellers take control to reverse the market back below Monday's 153875 low. In turn the bounce to retest 1593 has turned into a right shoulder of a head/shoulder topping pattern. The neckline was broken on Wednesday as the market took out Monday's lows of 153875, giving 1568 shorts their first target. At this point buyers are forced to defend last week's lows of 154300. Closing below this for the week triggers sell signals going into next to continue the move lower. Closing below the daily neckline of 153875 gives room to expand the range of 54.25 (159300-153875) down to 1484.5 which would be a retest of the February lows at 148175. The Cyprus low remains the line in the sand which was a retest of the old February highs, falling below gives room to target February's lows with next major support within 1465-1450.
Risk Disclosure: Futures, foreign currency, and options trading contains substantial risk and is not for every investor. An investor could potentially lose all or more than the initial investment. Risk capital is money that can be lost without jeopardizing one's financial security or lifestyle. Only risk capital should be used for trading and only those with sufficient risk capital should consider trading. Past performance is not necessarily indicative of future results. Video content hosted by a third party.
Live Trade Room Example: This presentation is for educational purposes only and the opinions expressed are those of the presenter only. All trades presented should be considered hypothetical and should not be expected to be replicated in a live trading account.
Hypothetical Performance Disclosure Example: Hypothetical performance results have many inherent limitations, some of which are described below. no representation is being made that any account will or is likely to achieve profits or losses similar to those shown; in fact, there are frequently sharp differences between hypothetical performance results and the actual results subsequently achieved by any particular trading program. One of the limitations of hypothetical performance results is that they are generally prepared with the benefit of hindsight. In addition, hypothetical trading does not involve financial risk, and no hypothetical trading record can completely account for the impact of financial risk of actual trading. for example, the ability to withstand losses or to adhere to a particular trading program in spite of trading losses are material points that can also adversely affect actual trading results. There are numerous other factors related to the markets in general or to the implementation of any specific trading program which cannot be fully accounted for in the preparation of hypothetical performance results and all of which can adversely affect trading results.
© 2022 Chicagostock Trading. All Rights Reserved.