Chicagostock Trading

Chicagostock Trading

Trading Pivots


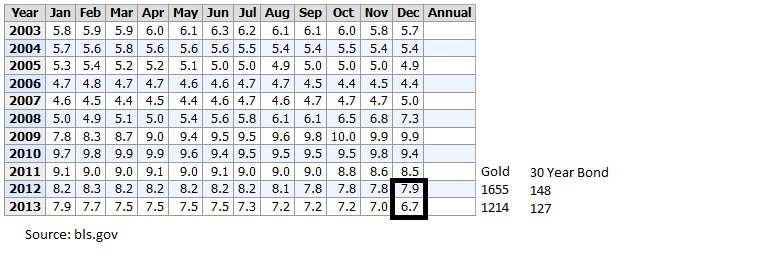
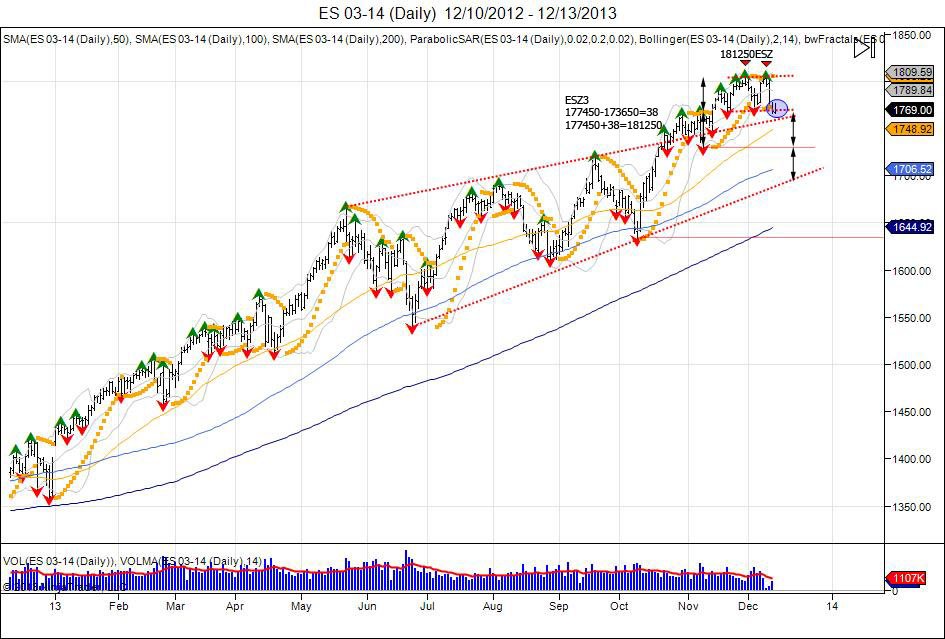
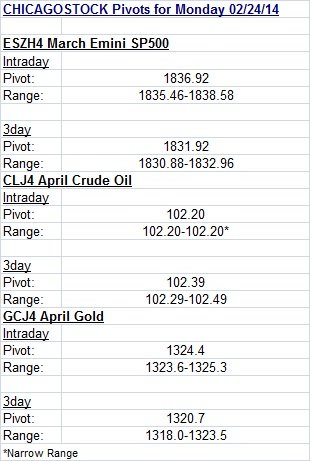
Pivots are used to determine areas of reference for support/resistance.  Pivots are calculated by adding the high, low, and close of the determined time period, and subtracting by 3.  This gives a "mean" of the market from that past data. Pivots themselves are not always enough. By adding ranges to the pivot (above and below), this gives an area of cushion around the pivot.  The tighter the range, the more indecisive the previous data was, giving room for expansion of volatility.  In the above examples, the intraday pivots are derived from the previous day's session.  The three day pivots are derived from the last 3 trading sessions.

Continue reading
4102 Hits

Bonds, Gold, and the Fed

1-8-12b_1.jpg


Just a little over a year ago, in December of 2012, the Fed for the first time during its low interest rate policy, attatched a 6.5% unemployment rate to its fed funds rate.  As highlighted in December of 2012, this spooked the gold market, which at that time was trading 1655 with a range of 1526-1798 in 2013.  Bonds on the other hand closed the month of December at 148.  Since this new FOMC policy, both gold and the 30 year bond market front ran the unemployment rate target, seeing gold break its 2012 range of 1526-1798 to expand lower, making lows of 1179 in 2013, and lows of 12723 in the 30 year in January.  On January 10th, 2014, the BLS reported an unemployment rate of 6.7%, down 1.2% from Dec of 2012, and only .2% from the Fed's 6.5% threshold.  So with gold and bonds moving ahead of this target, and now the target coming into play, it only makes sense to see gold and bonds recover and turn the other way.


1-8-12b_1.jpg


30 Year bonds put in a failed breakdown early January as the lows from 2013 of 12801 were taken out down to 12723, and failed to hold.  This has thus far led to a reversal and short squeeze, seeing the market recover above 13100.  Overall trend remains down as seen in longer term weekly chart with major resistance for this trend coming within 13320-13524. Breach of this range will change trend and momentum in the 30 year, confirming the weekly double botom and giving room to retest the March 2013 lows at 14014.

1-8-12b_1.jpg

Gold's 2012 range of 1526-1798 (272), was expanded (272) lower into 1254.  This did not stop as panic selling came in and gold saw a flush down to 1179 before quickly recovering up to 1434. For the next few week's, gold's downside pressure from its new found downtrend below 1526, forced the market to retest the 1179 lows. Tax selling also put pressure into the end of year 2013 as investors sold gold to lock in losses and balance some of their stock gains.  In January, just as the bond market made a new low, gold also made a new low down to 1181.4, however managed to hold the 2013 low of 1179.4 by $2.  This has thus far led to a small bounce, retesting resistance from the prior high of 1267.5 made in December.  Today gold ran into these highs but has fallen short in taking them out by .5.  A move through the December 1267.5 high confirms a short term double bottom and gives room to retest next major resistance up to 1380s based off the 1434 high in mid 2013 before falling back below 1200.  This 1380-1434 level will be huge for the change in momentum and trend. As a break above this confirms a double bottom and gives way to retrace back up to and retest the 1526 level from where the market failed. 

Just as in December of 2012 with gold at 1655 and 90% of community being bullish after 90% was bearish sub 1000, this did prove correct and we did see a correction down to 1179. So at 1179, down $744 off the highs and unemp rate reaching 6.5%, is this the time to be short gold? Opposite as majority of community is back to being bearish metals, this is the time to start looking back into gold, and picking up physicals.  A flush below 1179 can still be seen, but should provide opportunity for longs as a reversal after the flush would be expected.

Continue reading
3952 Hits

Copper VS SP500 UPDATE / Equity Tops

1-8-12b_1.jpg


The spread between copper and the SP500 is now down to 5410 after hitting highs of 5679 in November.  This high marked a 25+% move higher in the SP500 and a 13-% move down in copper for the year of 2013.  Copper, known to be bell weather of economy as it shows industrial demand, tends to be a leader for the equity markets.  The fact that it was down this year as the SP500 diverged higher shows the move in equities was fueled only by QE as opposed to underlying macro.  Going forward, a breach of the August low in this spread confirms a failed break out with reversal attempt to cover/buy copper and sell the SP500.


 1-8-12b_1.jpg

After breaking through the daily pennant created after the May correction that was followed by higher lows and higher highs, the SP500 traded in a tight range of 173650-177450.  This range of (38) was expanded higher as market broke above and turned 177450 into support, completing its target of 181250 to the tee with highs of 181250.  This was followed by a pullback to retest the 177450 level that held at 177775, followed by another retest of highs.  The retest was seen on the December release of the November NFP # that fueled the market to retest highs.  This retest fell short at 181150, seeing a rejection to take out the 177775 low, confirming a short term double top.  Market is now ont he edge fighting to hold above 1760 as this 1774 level becomes new resistance with the double top trapping longs and putting pressure lower.  Continued weakness below 1774 gives way to target the bottom of  old range at 173650 for stops.  Failure to hold 17360 can see the 1774--1736 range expanded down to 1698, into the bottom of the daily pennant and a test of the 100 day moving average which has not ben touched since October.


Continue reading
913 Hits

SP500 & VIX

1-8-12b_1.jpg

The SP500 completed its 181250 melt up target after breaking out of its 177450-173650 trading range.  This range of 38 handles was expanded to the upside, giving the 181250 target after the SP broke through the top of the channel at 177450, followed by turning the level into support on November 20th.  Since touching 181250, the SP started the month of December on a softer note.  These highs were retested, only to fall short at 1809 before reversing to take out last week's lows.  Melt up continues with support at 1794-177450 holding.  New resistance based off most recent highs comes in at 1802 with buy stops above 181250 to give way into next fib extension at 1818.29.  Breach below 177450 confirms a short term top to give way and target the bottom of the range at 173650 to shake out the long side.  Breach of 173650 gives way to then expand 38 handles the opposite way, giving room down to 169850.  As of current, the SP500 is up 392.5 for the year, or 27.6%, with 9 months in 2013 as green months, and only 2 months of corrections.  Last month of the year, we will find out if Santa Claus looks to book some profits.


1-8-12b_1.jpg


Volatility index giving some warning signs.  After taking out a long term support trend line from the March lows, falling down to 11.99 last month, this quickly turned into a head fake as volatility squeezed back to 13.94.  This first attempt to squeeze 14 resistance failed as volatility retreated to retest the 11.99 lows, finding support which has led volatility to now break out of 4 week highs, confirming the 11.99 low as a failure. New support now seen down to 1330, followed by 1290. Weekly close above 1436 gives way to expand 1436-1199 (237) up to 1674. For the year of 2013, the VIX has a trading range of 11.05-21.91 and 18.00 to be flat for the year.

Continue reading
932 Hits

DAILY EQUITY CHARTS FOR NOV 18 2013

(click chart to maximize)

1-8-12b_1.jpg

Continue reading
2524 Hits