Chicagostock Trading

Chicagostock Trading

Gold $98 Locked & Free Ride for Another $366

 GC________Weekly___Week_32_2008___Week_9_2013.jpg

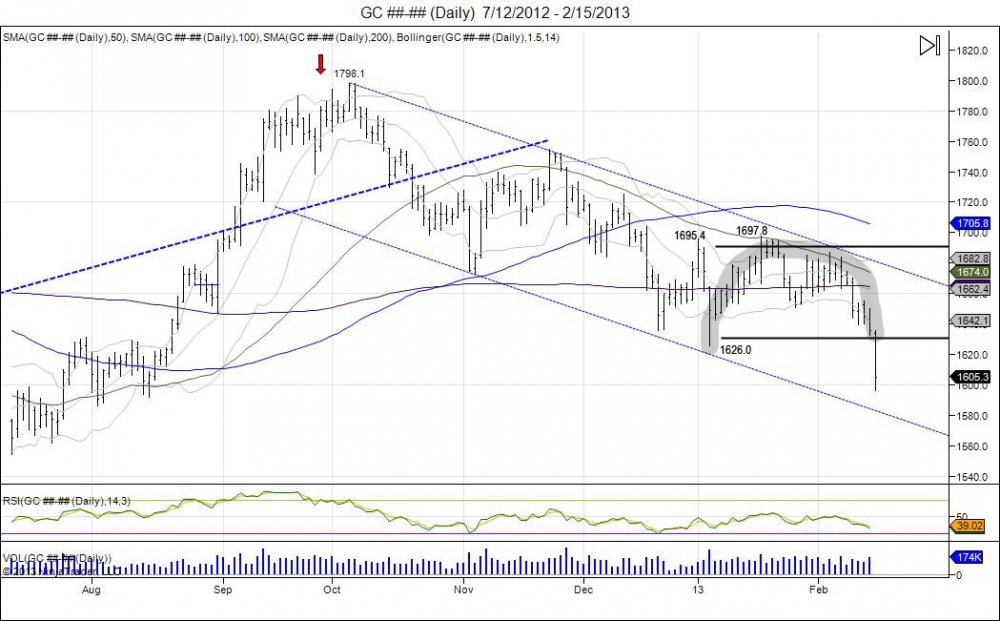
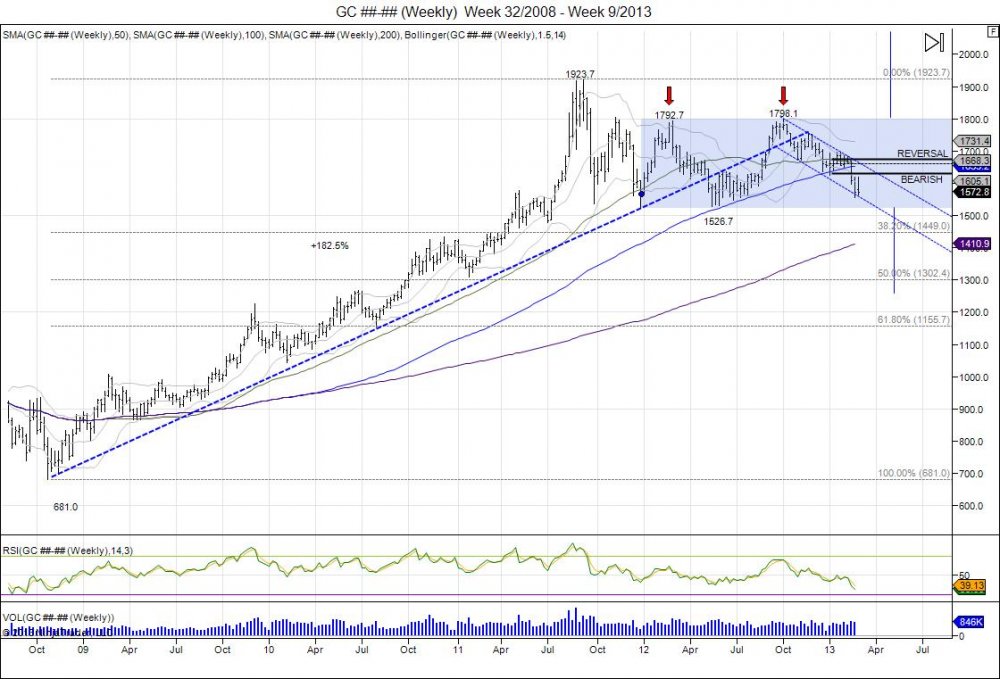
Gold's double top from 2012's year of consolidation following the 182% gain from 681-1923.7 has seen the market channel lower since that high of 1798.1.  This year began with a early breakdown followed by a bounce up to 1697.8 where the market failed to push through, leading the market to breach the year lows of 1626 in contrast to the US dollar reversed to take out its year highs.  Going forward, the market is now testing its last level of support based off its 1526.7 lows made in 2012.  This week has been a major failure as the market rallied to take out last week's highs of 1618.8, only to fail and turn back lower to where the week opened at 1579.7.  The downside chase continues and the 2012 lows are being targeted by bears.  A breach of thsi 1526.7 low confirms the 2012 double top and gives room to expand that $271.4 range which gives a downside target of 1255.3.  This would retrace the makret 50% of its 681-1923.7 move and offer long term investors a big area to buy.  Move back above 1676 reverses the bearish bias to give room to retest year highs.

Continue reading
3432 Hits

Reversals of the Year

 dx3_1.jpg

Continue reading
3452 Hits

How We Played This SP correction and Setting Runners for Homeruns

 ES2_26.jpg


With the SP500 squeezing the December 2007 high of 1527 and running into 1530, the rug was pulled underneath as bids lifted and sellers came in to take profits.  This led the market to correct down to 1495.00, testing its 1498 support level it broke out of in January.  This setup an aggressive attempt to sell any retracements retesting the 1530 level.  On Monday, the retracement was seen.  Our signal was offered at 1515 and using the 1530 highs as the exit.  The market came close up to 1524.50 before reversing lower to complete target 1 at 1498, locking in 1 times the risk for 17 handles.  Target 2 was 2 times risk at 1481, however with the market falling so quickly the same day, we were happy to lock in 1483 for another 32 handles to total 49 locked in. What is left is "running" positions where only profits are risked.  The runners should double the 49 handles locked in to turn the trade into a home run.  These don't always happen, but this is how we like to position trades for big moves, by scaling out to reduce exposure and leaving only runners to go after big targets.  Target on these runners are currently 1420. This is not to say the market will go straight there, however this would be a breach of MAJOR support within 1455-1465 and would fill last year's gap down to 1423.  Doing so, will pay 95 handles just on the runner positions.

Continue reading
2977 Hits

Major USD Reversal No One is Talking About


US DOLLAR:

DX2_25.jpg

The US dollar is one of the most important, yet least discussed chart of the year.  Noticing the dollar's break below 79600 late January, early February, only to establish a bearish bias and lure in shorts before turning around higher. The market has held above its reversal window, thus reversing the bearish bias which has led the market to take out its year highs of 8100 set early January.  This U turn is having a major effect and pressure on commodity markets as the USD failed to break lower and is trading on new highs for the year. Take note of the gold chart how it is completely opposite of the dollar chart and is an upside down "U" from the beginning of the year.


ES________Daily___3_14_2012___2_25_2013.jpg


Click charts to maximize

Continue reading
2717 Hits

Gold Breaks Year Lows, Whats Next?

 GC________Daily___7_12_2012___2_15_2013.jpg

Gold broke its year low of 1626 today after it bounced off the level early January only to take out the early year high of 1695.4 by a few points at 1697.8.  The market failed holding above the year highs in mid January and fell lower to retest the lows later in the month and beginning of February.  After 2 weeks of consolidation above 1650 exhuasting daytraders selling, the market finally broke below 1651 on the 11th of February.  This killed the attempt to build an inverted head/shoulder bottom and regained the bearish momentum as the market held below 1650 to keep buyers above trapped. Trapping these buyers led to the move today in breaking the year lows to run stops and fall down to 1596.7, 101.1 off the year highs.  This has the market now testing major support off last year's lows of 1526.7.  As seen on the daily chart, the market has created a upside down U turn. Meaning gold started at 1626, moved to 1697 and now back below 1626.  Going forward, a 5 day hold below 1630 establishes a bearish bias for the first half of the year and gives room to continue the move lower.

Continue reading
3368 Hits