Chicagostock Trading

Chicagostock Trading

Nasdaq Market Update

 NQ________1440_Min___11_8_2012.jpg


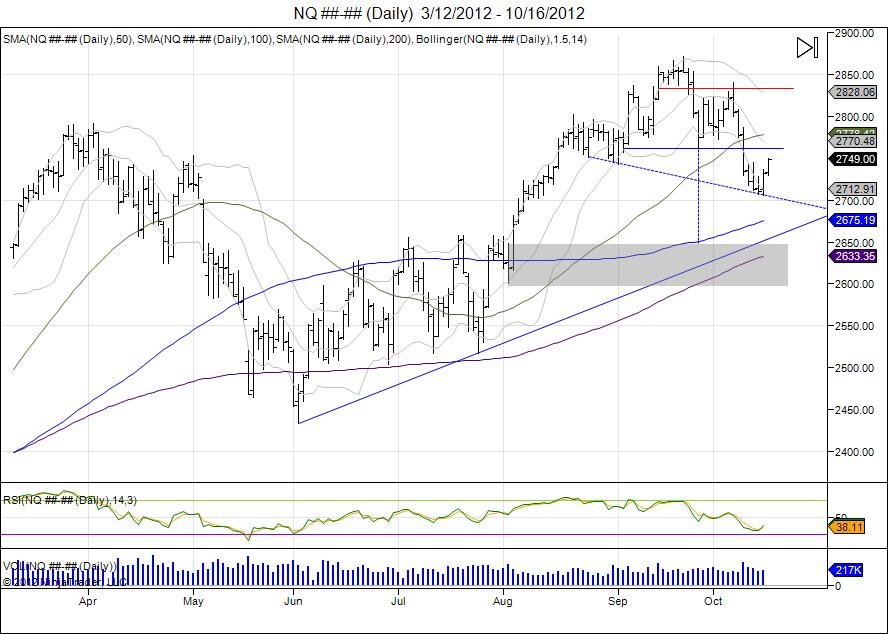
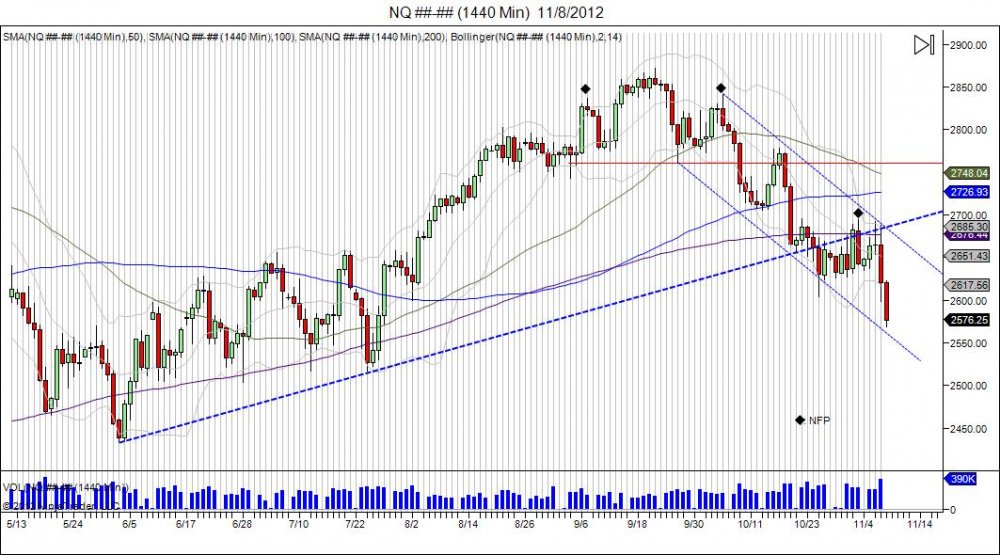
Non Farm Payroll Dates:
09/07/12 - Highs 2836.25
10/05/12 - Highs 2840.75
11/02/12 - Highs 2694.00

The daily Nasdaq chart above shows the importance of the last 3 Non farm payroll dates.  The September NFP number marked the left shoulder that was created with highs of 2836.25.  A small pullback was seen off that high down to 2777.75. The market early sellers by taking out this NFP high and ran into 2871.75.  The move into this level failed as a flat top was made and the market fell to take out the previous low of 2777.75 that led into that high.  The breakdown shook longs as the market was digesting the latest QE news.  Not quite ready to break down, another squeeze was seen to retest the 2871.75 highs where the market hit 2840.75 on the October NFP number.  The test of the highs created a right shoulder for a head/shoulder topping pattern as the market broke lower to take out the neckline of 2762.25.  From this level the market moved to expand and complete this head/shoulder pattern by falling into the 2650-2600 range.  Since falling into this the market went into consolidation in attempt to hold this support as the move was digested.  This led to highs of 2694.00 on Novembers NFP number just before the election.  As the election passed, this high was tested and failed, and the downside momentum and chase has continued int he market. This chase is taking place as buyers who missed the August rally higher are coming in to buy the dips only to see the market fail to give an uptick and press down which uses these buyers to sell into as well as squeeze out.  

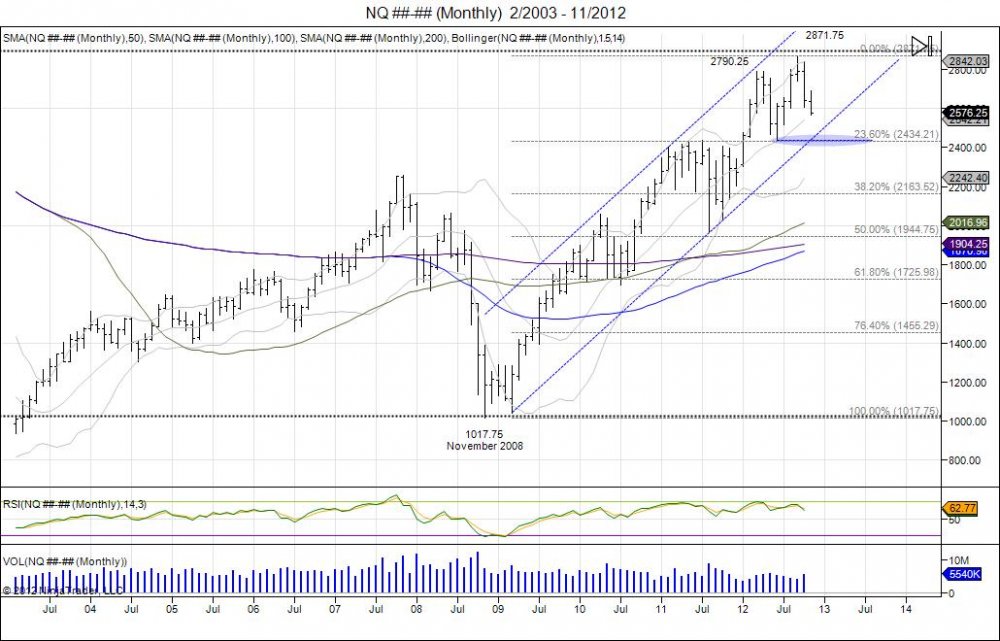
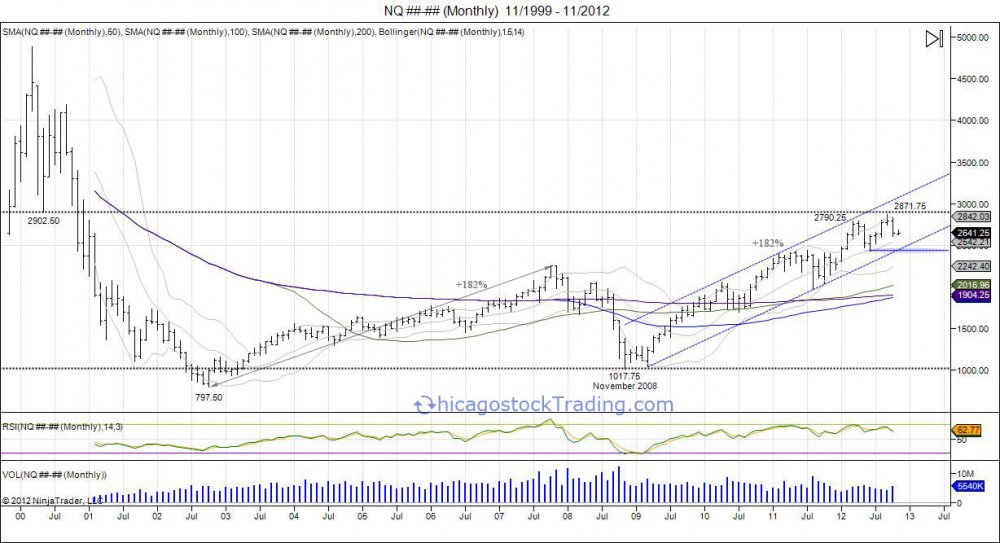
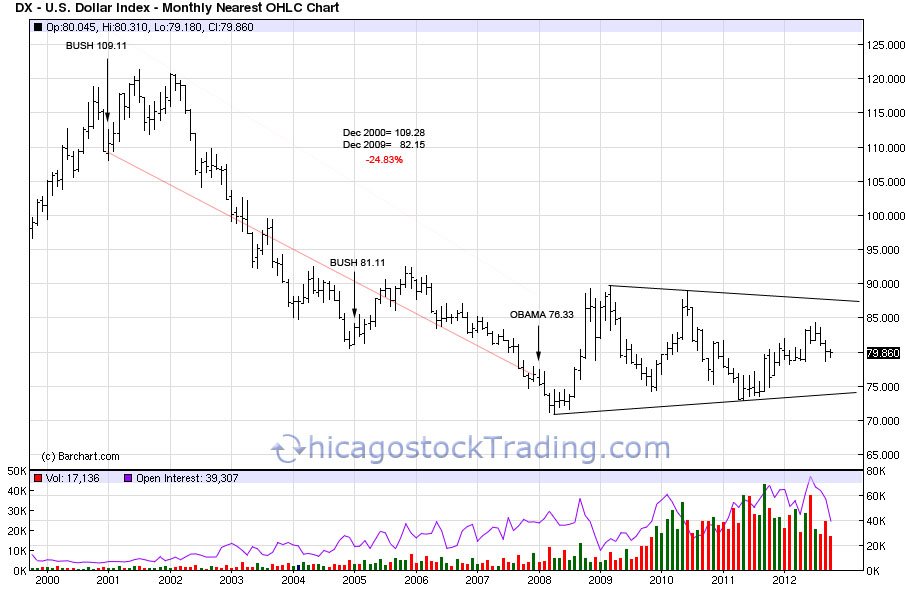
Looking at the monthly chart below we see this correcting 10% thus far of the 1017.75-2871.75 rally over the past 4 years.  This correction since the failed highs in September and reversal in October has the market now testing the breakout range in June within 2433.75-2628.25.  This is major support for the upside momentum. A target of these lows squeezes shorts and attempts a head/shoulder top formation based off the reversal off the highs and down through these lows. This gives an area of major support as it retraces the market 23.6% and an area to see short covering as well as buyers step in to attempt a retest of the September range. Failure to push the September range sees a right shoulder build followed by a target of the 23.6% neckline again. Breach of the neckline then gives room to expand this range which gives room to the 50% retracement level down to the July 2011 lows of 1972.25.  This is all premature, and what we are seeing now is the chase trade that is targeting the 2433.75 lows from June of 2012.  Breach of these lows confirms weakness in the market and an area for buyers to step in as well as sellers to await a retest of the September range.


Click charts to maximizeNQ________Monthly___2_2003___11_2012.jpg


Nasdaq's 2012 Daily Head/Shoulder Creation

Tags:
Continue reading
4224 Hits

Nasdaq Thanks Current Administration for a 182% Gain

 NQ________Monthly___11_1999___11_2012.jpg


Since the last election in November of 2008, the Nasdaq has risen 182% off the lows of 1017.75 to highs of 2871.75 set just last September.  This 182% increase in 4 years, matches exactly the same amount it rose from 797.50 to 2256.25 within the time period of 2002-2007.  The market corrected after this gain from 2002-2007, falling back to retesting the lows set in 2002.  The test came during the time of the last election in 2008 as the market fell to 1017.75 following the crash of 2008 and found support based off the 2002 lows.  Since this last election and lows, a slow short squeeze and grind higher has taken place, through the 2007 highs and retracing back to where the Nasdaq failed in the dot com era at the 2900 level.  The market fell short of the 2900 level by about 30 points before reversing in October down to 2604.50.  An attempt to test the September high of 2871.75 was seen during the October Non-farm payroll numbers as the Nasdaq rallied to 2840.75 and reversed lower as it failed to move past the September highs. This in turn built a daily head/shoulder corrective pattern that targeted the 2650 level. This small corrective pattern completed in October down as the market fell into its support range of 2650-2600 based off where it broke out to the highs in August.  Going forward, the small corrective pattern is over, however on a longer term picture as we look at the monthly chart, we see this small corrective pattern as a road block going forward.  Based off the longer time frame the September range of 2736-2871.75 now offers a new area of major resistance for the market to work through to regain the upside momentum. Until then, rallies up to this level offer an area for longs to take profits, protect longs, and or short the market.  There is a chance the market fails to test the level as the market is in a downside chase having caught buyers off guard by the reversal and not giving an opportunity to gain on their most recent purchases. Continued pain and chase sees the market falling down to take out the 2433.75 low made in June, to squeeze out these buyers who have been trying to participate in this decline over the last month.  By targeting the June lows, the market squeezes out these buyers and gives opportunity to establish a neckline for a short squeeze to retest the 2736-2871.75 level. This retest of the failure in September gives opportunity for buyers to show their strength by squeezing through and for sellers a level to defend to build a right shoulder for a larger head/shoulders topping pattern based on the monthly chart.  There have been many programs established over the past years to keep the squeeze in equities afloat, the most recent one was the biggest with the Fed coming out with Quantitative Easing without an end date.  This announcement came at the highs and gave the final push in the market up to 2871.75. Thus far it has failed to hold up. Here we are one day before the next election is voted on and the market is in a corrective phase. Regardless of the outcome of the election, we must take caution of October’s reversal as the market is now in sell the rally mode, until a move past the September high is seen.  For buyers and sellers, it is wise to sit on hands as this month of November offers more data to be used. Buyers should await a move down to the June lows to defend, and sellers a test of 2736 to defend.  Ultimately, should the market build this head/shoulder top on the monthly chart, this gives a projection down to the 1900 level to coincide with the August 2011 levels and the 50, 100, and 200day moving averages. During the last 4 years, the stock market (Nasdaq) is up 182%, US government debt per American under 18 is up 53%, the national debt up 52.6% and unemployment has risen from 6.8% to 7.9%.  Looking at these numbers, it appears the past 4 years favored wall street over main street. 


Continue reading
3482 Hits

SP500, Nasdaq, Midcap Daily Charts

 ES________Daily___3_12_2012___10_16_2012.jpg


NQ________Daily___3_12_2012___10_16_2012.jpg


EMD________Daily___3_15_2012___10_16_2012.jpg

Continue reading
3461 Hits

SP500's Double Top, Nasdaq's Head/Shoulder

 ES________Daily___12_22_2011___10_12_2012.jpg


With the SP500 completing its 1441 target coined earlier this early, along with the double bottom made in summer that also targeted this, highs of 1468 were made in September as the short squeeze above the level took the market into this next level of resistance.  The market saw a small pullback off the highs and found support off a small trendline based off the August 2nd pivot lows and through the September 4th lows.  Not quite ready to break down, the market grinded higher to retest the highs made in September.  With the non farm payroll numbers released on October 5th, the market squeezed through 1460, stopping out weak shorts, yet falling short of the 1468 high by 2 handles at 1466 and quickly seeing a rejection during the day.  This rejection continued this week as the market saw this as a failure and a potential to double top.  With the breakdown seen this week that led the market to take out the trendline from the August2-Sep4 lows, this confirmed the double top and now targeted the 1424 pivot lows made on September 26th prior to double topping.  As the market is now working itself through this area of support, next major support comes in at 1410 based off the 1394.50 pivot low made on September 4th, and ultimately sees next major support at 1385 being where the market broke out early August to establish the bullish bias for the second half of the year. This fills the market back to where it broke out during the summer as many coined as a "light volume" rally, and most missed the move higher.  This gives the ultimate level for the market to base out for the year and see if buyers step up at these levels to support the market after squeezing out all these late buyers who have come into the market chasing above 1420.  The 50day moving avearge is being tested here. For this week the bear mission is to close the market below last week's open of 1432.75 to establish a bearish engulfment on the weekly chart to project more weakness going into next week.  Doing so sees first level of resistance at 1427.75, followed by 1451.25 being the lows off the failed 1466 high and the range buyers must work through to regain momentum. 


ES________Weekly___Week_20_2007___Week_41_2012.jpg


Continue reading
5398 Hits

-24.8% USD = +223% GOLD

 GC________Monthly___9_1998___10_2012.jpg


DX10_11.jpg


Continue reading
1133 Hits