Chicagostock Trading

Chicagostock Trading

Nasdaq + Euro

 NQ________Daily___3_16_2012___10_5_2012.jpg

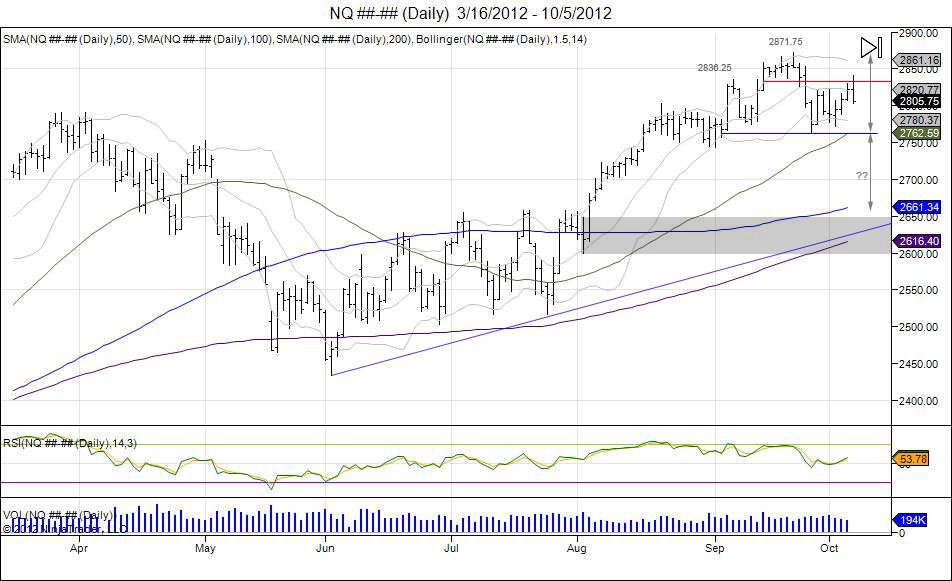
Last month, the Nasdaq future made a higher high of 2871.75, just before reversing to take out the 2775.25 lows made just before that high. The market made lows of 2762.25 on September 26th. Not ready to break the September lows, the market grinded higher off this late September low into retesting where the market failed from the highs. This retest was touched today on the NFP number with highs of 2840.75. This put the market right into the hands of sellers to defend the failed September high, and looking for a right shoulder to build on this failure.  Thus far the market is trading on its lows and giving these sellers oppurtunity to take a portion off as this is being reversed the same day.  Going forward, buyers must work through this 2840-2872 resistance to squeeze out this head/shoulder pattern attempt and stop sellers.  Sellers must look for a move down to the neckline now of 2762.25 to confirm this pattern and allow for another level to take a layer of shorts off.  Continuation of the pattern is seen should the market continue to see sellers below the neckline which gives a downside target of 2652.75, retracing the market to where it broke out early August. 


Continue reading
12012 Hits

SP500 Chart Analysis

 ES________60_Min___9_26_2012.jpg

click chart to maximize


The SP500 completed its 1441 target and squeezed into its next major resistance being 1468, tapping it on the button as buyer exageration and short squeeze above 1441 led the market into this next level. Thus far, the market saw consolidation off 1468 in attempt to build a base down to 1443, however buyers ran out of gas as the market reversed Tuesday as they attempted to test the upper 1450s and fell to take out this 1443.50 level.  This has the market now testing an important support range within 1437-1421 as lows of 1424 were made today, fighting to hold the 1421.50 low made September 11th, being the pivot low prior to the run into 1468.  Below this level comes 1410-1394.50 being the pivot low made on the 4th as the market made a failed breakdown and ran from this into the 1468 level. This level could be the target for this move to squeeze out dip buyers and back and fill into this level.  Should this take place, 1385 comes in as next major support on the downside that we must look for the market to test and attempt to hold to offer oppurtunity to reload. There are many eager buyers who want to come in as the market retraces its FOMC move higher, moving down into where this leg up began at 1394, would certainly hurt these buyers. 


Continue reading
3505 Hits

Oil and Transports TRADING TOGETHER?

CL________Weekly___Week_4_2011___Week_39_2012.jpg

IYT__Weekly___Week_4_2011___Week_39_2012.jpg

Here is a question... Shouldn't falling oil prices be a positive for the transportation sector?  Looking at the weekly crude oil chart above along with the weekly transportation index fund chart, what do we notice? Both oil and the transports traded exactly the same the past 2 weeks as highlighted in blue.  Crude oil made a high of 100.42, failing to break out and seeing a quick reversal the following week to take out the lows made the prior week.  The transportation index made a high of 9349 and also saw a quick reversal the next week to take out the lows made the prior week. In theory, a weaker oil market should be supportive to the transportation index and the weakness in this sector should not have been as strong. Only we are now living in a QE world and these assets are trading as risk on and risk off.  The weakness and similarities should be noted, as this may be giving a bigger picture of what is going on in the economy, and why the Fed continued with quantitative easing. Going forward, the range from the week these markets made these highs is new resistance needed to breach to move higher.


Continue reading
2352 Hits

Troubled Transports

 IYT__Daily___6_1_2011___9_24_2012.jpg

The Dow Jones Transportation Average Index Fund (IYT) has now cracked 2 month lows and on the verge of testing the year lows set early June at 86.09.  As the equity markets grinded higher in August to complete the Emini SP target of 1420, many investors along with other "personalities" looked to the transports for confirmation of the equity strength. Unfortunately for these 'buyers', the confirmation in transports never came.  The transportation index fund made a high of 93.42 in August just as the Emini SP500 made new highs for the year.  As equities digested this new high and consolidated down to 1395 where a base was built, the transports corrected sharply off their August highs and fell into the summer lows.  This index turned to chase equities as the SP500 base of 1395 was supported to see a squeeze into the 1441 level, the transportation index began to play catch up.  As 1468 highs were made in the SP, the transport fund took out its August highs by 7 cents.  This attempt to breakout failed to hold these prices and breakout of this pennant that has coiled all year.  Once again with the small correction taking place in equities down to 1443.50, IYT fell sharply to take out the pivot low of 88.17 made in September just before it chased the SP higher.  With the break below 88.17, this confirms weakness in this index and the double top made in August-September as the pennant has now been broken to the downside.  Those that were looking for transports for confirmation, not only missed the move up in equities, but should be completely puzzled now of the weakness taking place here.  Going forward, IYT is looking weak. The pennant created all year has seen a break to the downside following the double top at the 9340 level. Rallies up to 90 offer oppurtunity to defend this breakdown and sell with stops above 9350.  This range will need to be taken out for buyers to regain control over this sector. Downside support levels = 83.00, 82.60, 80.84, 80.00.


Continue reading
2941 Hits

30 Year Bond Flags off 'X' Level

 ZB________Daily___2_9_2011___9_20_2012.jpg

In our last blog posting we noted how the 30 year bond fell into its "X" markets the spot level as the market fell into 14415 to take out the August lows and test major support based off this neckline along with the trendline deriving from the April 2011 low to the March 2012 lows.  Thus far, we have seen the market fight back off this level as shorts cover and buyers have come in to defend. This in turn has the market "flagging".  Flagging is a term used after a market makes an initial move into important support/resistance levels and takes a breather. In this case, the initial move was down from 15129 as the market failed to breach 15311, in turn putting in a right shoulder. The initial move fell to take out the neckline support of 14503 (august lows), placing the market against major support. Flagging is taking place now as the market is fighting off this level in attempt to test upside levels of where the market broke down from.  Today, the market ran it's open from the FOMC day on 9/13 at 14719 and has backed away.  The back and forth should continue, with next major upside resistance coming in at 14810 for sellers to defend. A breach above 15129 is needed to trap and squeeze shorts to void out this head/shoulder topping attempt and target the 15311 highs. Until then the market is in a bearish mode and sellers should look to retest the neckline.  Breaching the level gives room to expand this range from 15311-14503 being a range of 8'8 to the downside. Subtracting 8'8 from the neckline of 14503 gives a downside target of 136'28 to complete the pattern and place the market against the 2012 reversal level that led into these highs which tests the next major support level.

Continue reading
1164 Hits