Chicagostock Trading

Chicagostock Trading

Friday the 13th for Stock Bears

 ES________10_Min___7_13_2012.jpg


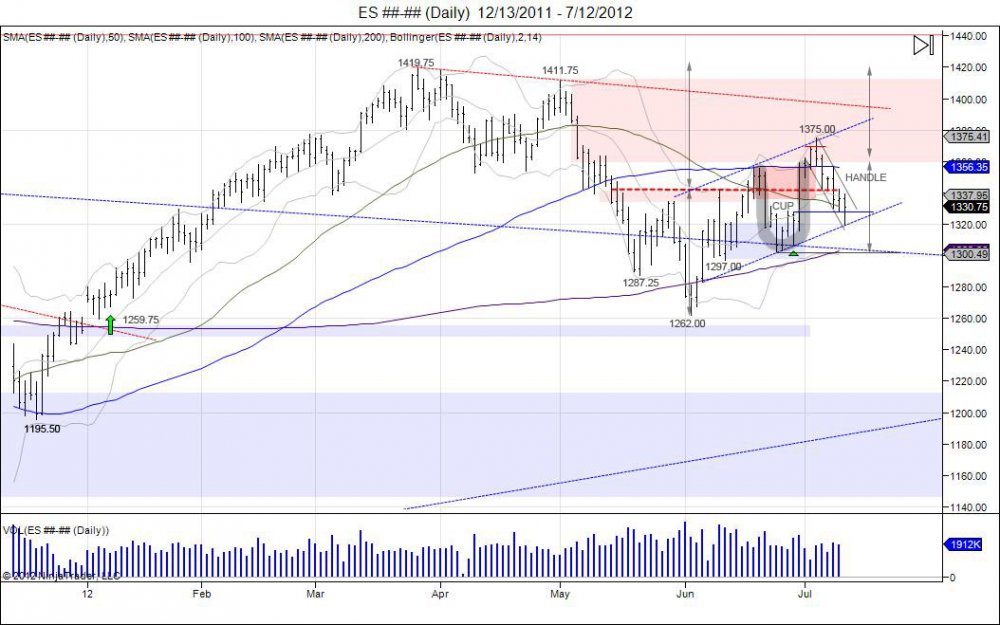
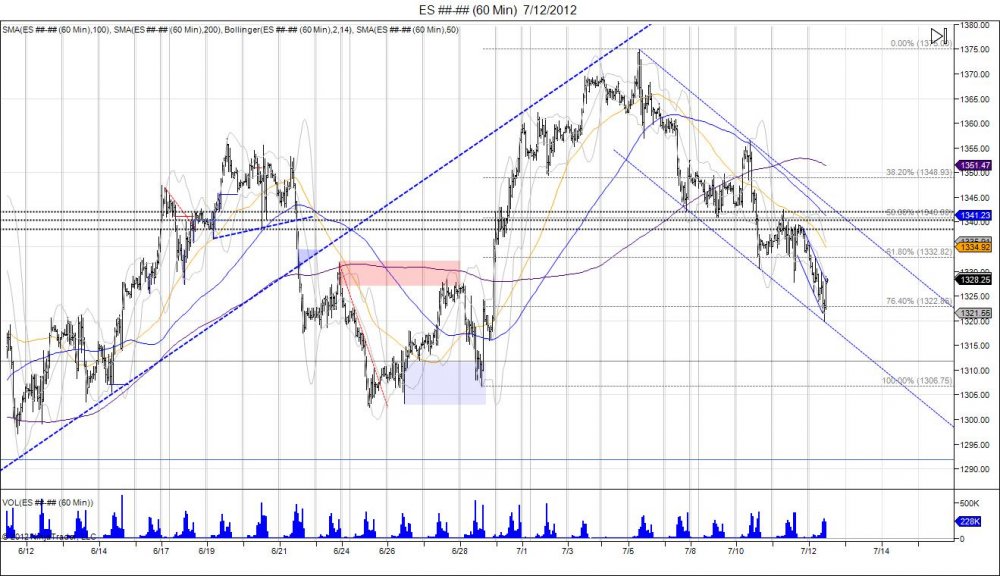
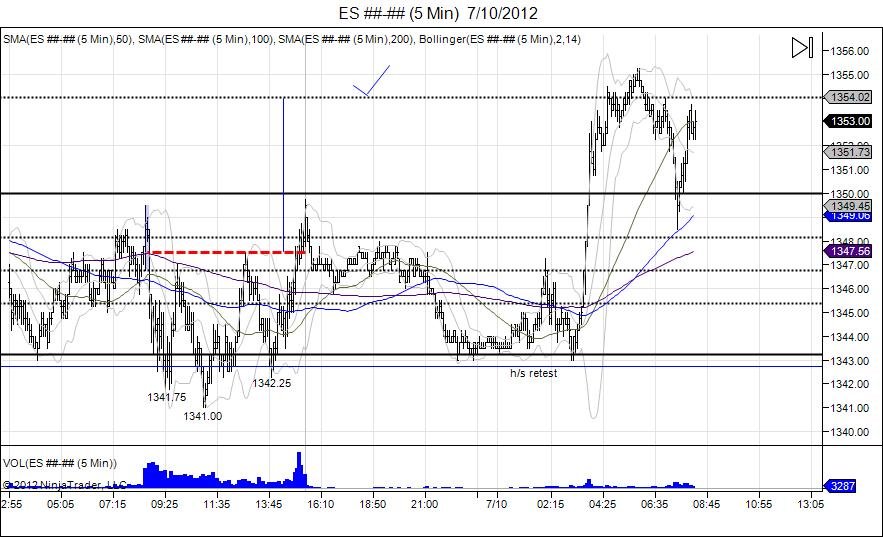
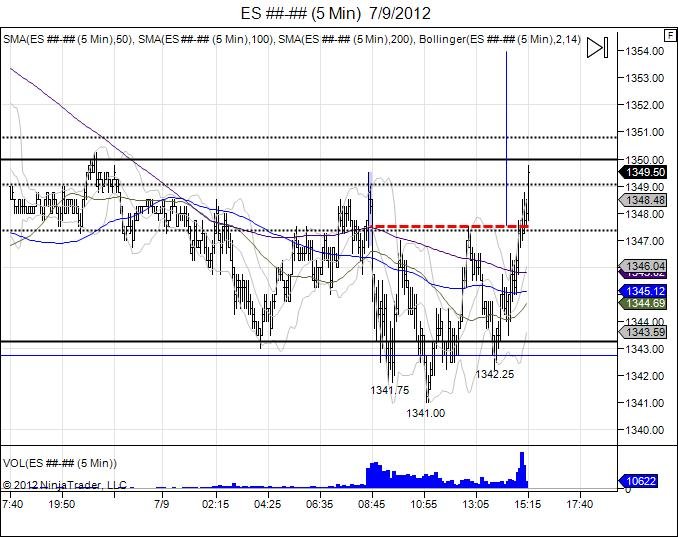
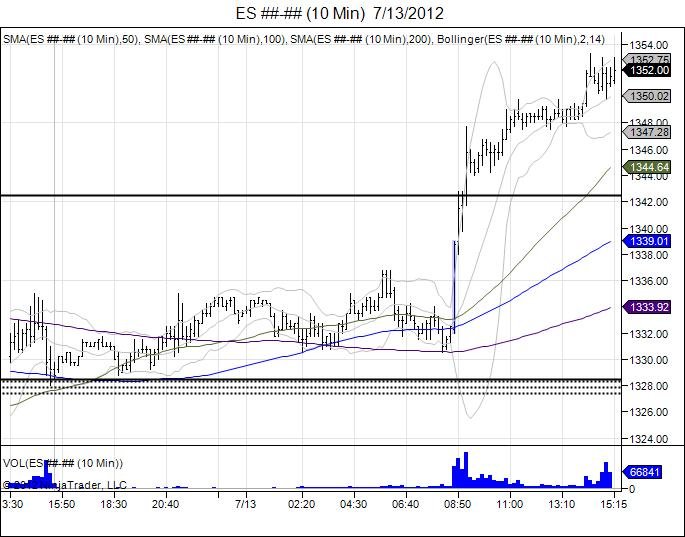
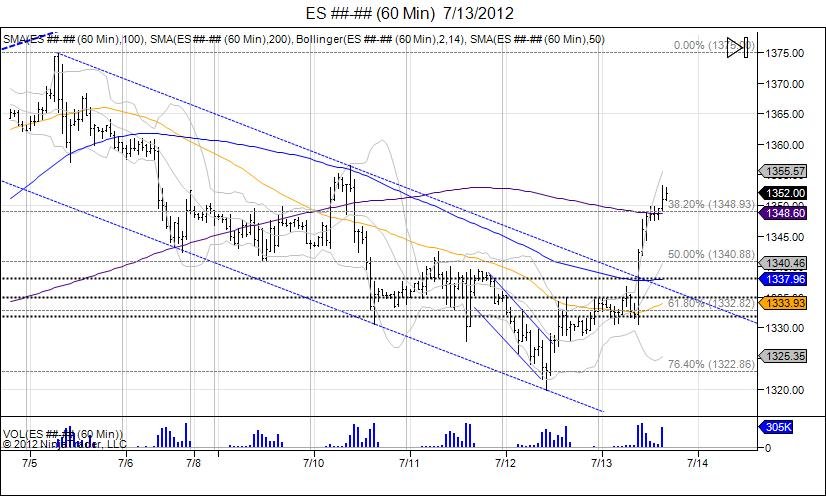
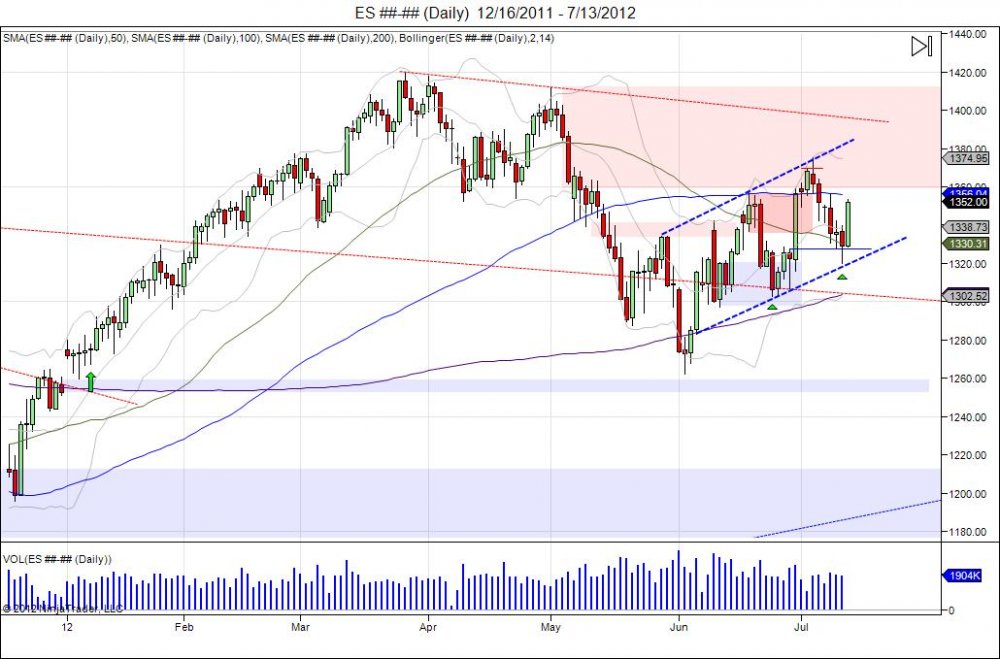
It was surely Friday the 13th for stock bears as the market moved through Thursday's highs which led to shorts being forced out as the market retraced back to where it failed earlier in the week at 1352.00-1356.50.  The market closed the week a tick higher at 1352.00 from last week's close of 1351.75. The move was a win for bulls as the market was down pressing against the late June lows on Thursday.  The market reversed on Thursday and was able to close above 1328, giving bulls their platform to continue higher. This was seen today with 1328.75 lows and a run into highs of 1353.25. The move in itself has given aggressive bulls who defended the pullback oppurtunity to take some money off the table and reduce exposure as the street now is back to bullish.  With the short squeeze sparking this rally, going forward it will be up to buyers to come in at these levels to carry this momentum and retest the major resistance of 1357-1375 level from early July where the market failed.  Bears are now looking at this squeeze as a simple retracement into those failed highs to build a -right shoulder, thus making the range of 135-1375 that much more important. Moving through this range sees next major resistance coming into play at 1390, followed by targeting the year highs of 1420.  Downside support is now 1340 and a break below Thursday's lows of 1319.75, derails this move and puts pressure to retest the 1302.50 lows from late June, followed by the 1297 right shoulder created June 12th.  

ES________60_Min___7_13_2012.jpg


ES________Daily___12_16_2011___7_13_2012.jpg

Click chart to enlarge

Tags:
Continue reading
2843 Hits

Will Bullish SP500 Patterns Hold Up? All Point To Year Highs

 es7_12.jpg


This year started out with a gap above last year's close of 1352.50, leading the market into highs of 1419.75 on March of 2012, which was met with the last level of resistance before the 1441 May 2008 highs which is the reversal that led into 665.75.  The SP500 retraced to test its year lows of 1259.75, only to hold and put in a double bottom at 1262.00 on June 4th.  Since this low failed to take out the year lows, the market bounced early June to squeeze shorts and make a 1342 high.  The market backed off this high and retested the short squeeze by pulling into lows of 1297.00 and holding to create a right shoulder of an inverted head and shoulders pattern as the market was testing its head of 1262.  With the test of the lows holding and the market turning, more shorts were caught as the market rallied through 1342 for another squeeze in attempt to break above its 1342 neckline, only to hit highs of 1357 and stutter.  The market met resistance at its 100day moving average along with the levels from where it broke down May 11th.  Following this failure to hold above the neckline the market was sold along with news from Reuters that “Goldman Sachs recommends shorting US stocks” with a 1285 target.  This news led to weak hands selling dropping the market down to 1317 off its highs of 1353 that day. This retested of the right shoulder lows of 1297 as the market hit 1302.50 on Monday, June 25th.  The following day the market tested this low with a 1303.25 low, and held to reverse and squeeze shorts running into resistance at 1330.  The market backed off this resistance level and retested Tuesday’s reversal by finding support at the open 1306.75 and once again putting in a reversal on this Thursday.  This action created a rounded bottom as the market failed to break below 1297, causing a run higher on Friday to squeeze out shorts due to the failure to break lower, retracing the market into 1375.  This action created a U turn as the market came back above 1357 which was where it broke down and rounded out to come right back into this level. Also known as a CUP.


Since the reversal seen into 1375, the market has gone into consolidation in attempt to build a handle for the cup as downside support is tested.  This handle has retraced the market down to where it reversed at 1328 from June 28th.  This is much steeper then the bulls would like and has the market pressing against this old resistance, acting as new support being the level where the market reversed higher into 1375.  On Thursday, July 12th the market shook below this level into lows of 1319.75 which hit the bottom of its rising channel from the 1283-1302.50 lows as seen above.  The market bounced off this channel and closed above 1328.  Going forward this level remains support with small stops below 1319 followed by larger stops below the CUP lows of 1302.50. A break below this low voids out the cup/handle and puts pressure to test the June lows within 1282-1262.  A close above 1342 is needed to close above these most recent highs and attempt to break out of this handle pattern to retest the premature breakout of 1357-1375.   A break above this confirms the cup/handle pattern with a target of the year highs.  Following this the next major resistance comes in at 1390 off the failed 1411 high in May. This cup/handle formation is also within the larger inverted head/shoulder formation with the left shoulder lows of 1287.25, head of 1262.00, and right shoulder of 1297.00 with a neckline of 1342.00, also targeting the year highs at 1422.  To void out this head/shoulder formation the head of 1262 must be taken out which gives room to take out the year lows of 1259.75 and fill the gap from last year at 1252.50.  So long as this gap is open, the bull is alive as a double bottom has formed by an inverted head/shoulder against the year lows which keeps pressure against sellers as the market attempts to squeeze shorts higher.  The ultimate objective above the year high is squeezing the May 2008 high of 1441 being the high the market reversed from that led into the crash down to 665.75 as seen in the weekly chart. 


Continue reading
6514 Hits

Two SP500 Channels to Watch

 ES________60_Min___7_12_2012.jpg

Hourly ES channel off 1375 highs, seeing 76.4% retracement of 1306.75-1375.00 move.


ES________Daily___12_13_2011___7_12_2012.jpg

Daily rising channel from 1283 lows on 06/06.


Tags:
Continue reading
2305 Hits

07/09/12 SP500 Intraday Action

ES________5_Min___7_10_2012.jpg

Overnight July 10, the Emini SP500 pulled in to retest its inverted head/shoulders bottom, with a 1343.00 low. The market held the head/shoulders and squeezed higher to complete the h/s target of 1353 with highs of 1355.25.


_______________________ES________5_Min___7_9_2012.jpg


After failing to rally at the open, the market fell down to take out Friday's lows by .50 at 1341.75. A squeeze was seen following this, leading back into the opening range. First test of the opening range met more sellers and the market was seen moving back down into new lows at 1341.00.  Another hold and reversal at this level the market turns back to where it failed previously (1347) and puts in a high of 1347.50, once again meeting sellers at the opening range and not able to hold up.  Another push down was seen, retesting the lows by falling to 1342.25 as the test of 1341.00 was defended by buyers, in turn building a right shoulder for an inverted head/shoulders pattern.  This defense led to another squeeze higher, this time since the low was retested, the market found enough strength to squeeze through its neckline of 1347.50 and put in a new session high of 1349.75 before settling at 1349.50. Today was all about attracting sellers below 1343 and squeezing out longs as the market had 3 bounces off these levels. It was not an easy day being a bull eitheir as the bias for today was bearish, however in the end, the bull squeezed out a new session high. 


Continue reading
2785 Hits

Soybeans Target New Record Highs

 ZS________Weekly___Week_43_2007___Week_26_2012.jpg


Since Soybeans put in highs of 1456 in September of 2011, the market fell down to 1094.25 within a few months in December of 2011.  Since these lows, the market has rounded out a bottom and come back right to where it broke down at 1456.  The market breached this high in April of 2012, rallying up to 1509.00. Since this was a complete U turn and new 3 year high, the market went into consolidation off these highs in attempt to look for support.  This in turn created a "handle" for the "cup" formation that was formed from 1456-1094.25-1509.  This handle pulled down into lows of 1317.50 in June 2012 and pivoted off this low to break out of its downward channel within this handle. Since this breakout the market has ran through the 1509.00 high, making new highs of 1517.75.  This cup/handle formation has a target of 1817.75, which breaches the July 2008 high of 1663.00.  This target is derived by taking the range 1456-1094.25=361.75, adding to 1456=1817.75.  Pullbacks down into 1400 should be supported with stops below 1317.50.

Continue reading
2737 Hits