Chicagostock Trading

Chicagostock Trading

How We Played Crude


07/03/12 Update:CL_08_12__60_Min___7_3_2012.jpg 

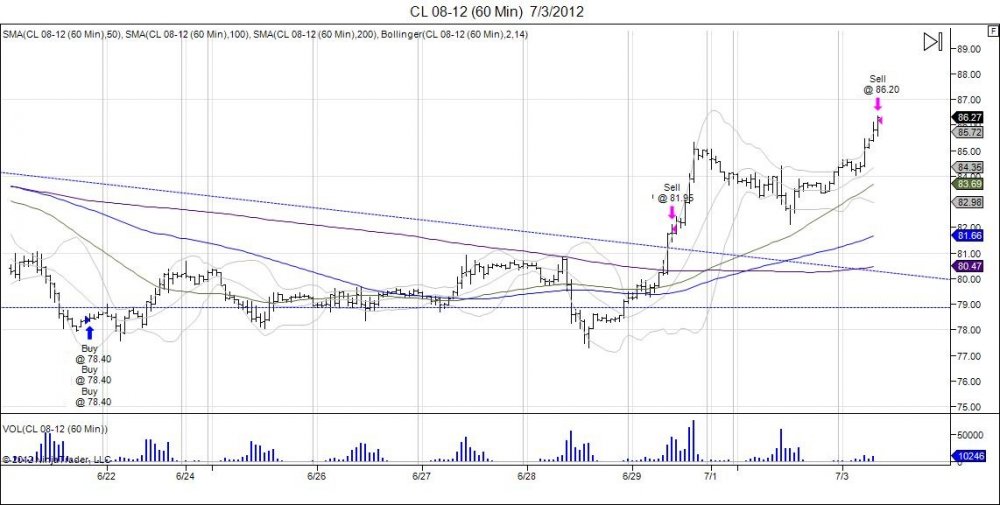
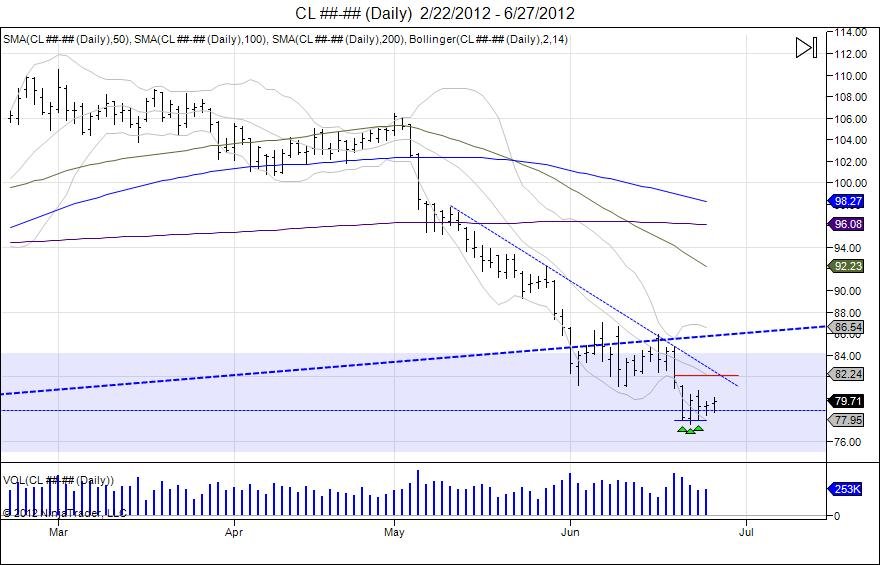
Crude reached its 2nd target of 8640, currently trading 8660s. 2/3 of trade is out.  Total locked $11.35. Next resistance 9020-9220, target on runner = 9750. This runner target will add $19.10 if completed.


_________________________________


CL_08_12__60_Min___6_29_2012.jpg

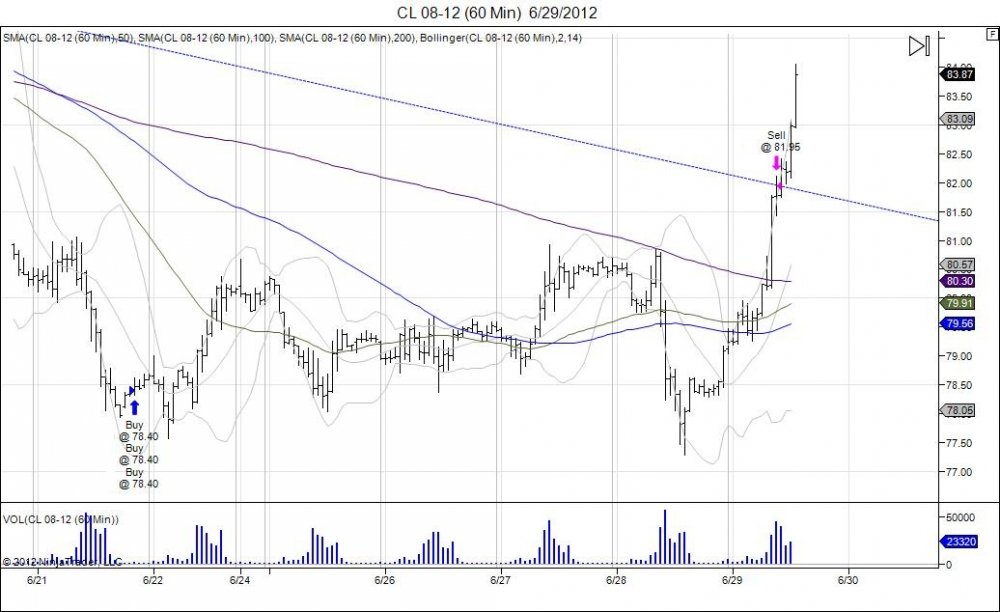
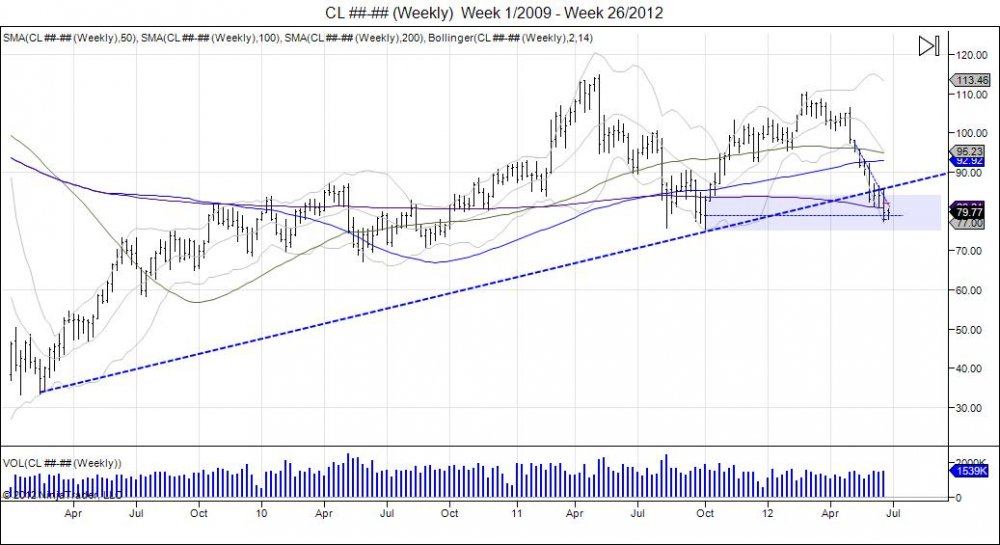
It was no easy task holding crude long this week. After attempting to breakout at 8092, the market failed on Thursday and a shakedown was seen squeezing out weak hands as the market fell into new lows for the week at 7728. Wiping paper gains. Sure enough this breakdown turned into a failed one as the market has reversed through Thursday's failed highs of 8084, completing the first upside target of 8240. Having taken some heat, we locked in target one at 8195 with no complaints. The market has confirmed the long side direction following Thursday's failed breakdown by this reversal, and we are seeing that today with the squeeze higher as shorts are forced to cover and longs who were squeezed out are forced to chase the market higher.  To continue higher, downside support is now seen down to 8090. Next upside targets come in at 8640 and 9750. 8474-8589 offers next major resistance, followed by 9750 which retraces the market to where it broke down the first week of May off highs of 106.43.

Continue reading
3530 Hits

SP500 Plays Out

 ES________Daily___12_23_2011___6_29_2012.jpg


Earlier this week we saw the market fall into retesting its right shoulder down to 1297 following last week's failed breakout above 1342. On Monday the market put in lows of 1302.50, retested on Tuesday at 1303.25, and with the hold, Tuesday brought forth a reversal that led to 1328.50, testing last Friday's resistance. This led to a pullback on Thursday, retesting Tuesday's reversal as the market fell into Tuesday's open of 1306.75 and turned this number into the exact low on Thursday. Once again Tuesday's levels were heavily defended and we are seeing the market do another reversal higher, trading back through 1342 and now retesting last week's failure of 1336.50-1357.00.  As noted on Tuesday in our market update- "We believe this pullback offers opportunity for buyers to step up and trade the long side, scaling out against upside resistance levels and adjusting stops accordingly."  This move gives oppurtunity for these brave buyers who stepped up this week defending the inverted right shoulder down to 1297, to take some profits against these resistance levels.  The market is yet to be fixed, however now must work through 1357 to continue the upside momentum and attempt to trade up to 1391, which retraces and retests where the market failed on May 1st. Ultimately the 1342-1262 inverted h/s targets 1422, giving room for new highs for the year, however we still have the May 2008 highs of 1441 to clip.  Going forward a breach below 1302.50-1297.00 is needed to negate this formation and give room to retest the 1262 lows.


Continue reading
1302 Hits

Euro Squeeze?

 06/29/12 Update:6E________Daily___2_27_2012___6_29_2012.jpg

Following Euro's fish for a bottom this week, the market finally breached its continuous June 12 low of 12443 down to 12417 and the market has climbed back to turn 12443 into today's lows as the market has run through Thursday's failed 12535 highs, squeezing shorts and hitting resistance from June 20th within 12646-12753.


______________________________________________________

6E________Daily___2_8_2012___6_27_2012.jpg

Since the Euro reversed off its 12288 lows from June 1st, the market ran up to resistance which was met from the May 21st levels at 12726.  The market failed to breach this level as sellers defended the range and went through a shakedown which led the market down to break its rising channel and fall into testing support from the June 12 lows.  This was the day the market pivoted into 12726.  The September contract lows from this date are 12455 and this week we saw the market clip this level and fall into 12451 before quickly recovering. On Wednesday this low was retested with a 12455 low that failed to break the week low of 12451.  Just as the Emini SP500 put in lows of 1302.50 on Monday and failed to take them out on Tuesday with a 1303.25 low which has been followed by a short squeeze higher into 1328, the Euro should also put pressure against shorts to cover as the market did not give oppurtunity to break the weekly low. On the continuous chart, the June 12 low comes in at 12443.  A close above 12542 is needed to squeeze out shorts and target the next major resistance being 12646 from where the market failed at 12753 on June 20th.  This is a major level of resistance as a test of this can build a right shoulder if sellers can hold the range, or see the market squeeze through to continue higher.  On the downside the 12443 lows are the neckline for this 2 week consoliation. A breach of this gives room to retest the month lows down to 12288.


Tags:
Continue reading
2894 Hits

Crude Oil Charts

 CL________Daily___2_22_2012___6_27_2012.jpg


CL________Weekly___Week_1_2009___Week_26_2012.jpg

Tags:
Continue reading
2739 Hits

SP500 Market Update

 ES________Daily___12_23_2011___6_26_2012_copyA.jpg

click chart to enlarge

On Tuesday the SP500 worked its way higher after a test of the week low 1302.50 held, catching shorts off guard which led to a short squeeze right into testing Friday's lows of 1318.25. This is where the market paused following last Thursday's break lower below the rising channel which was followed by a brief pause seen on Friday as the market held and traded higher causing shorts to cover into the weekend.  On Monday the move down was continued and sellers chased the market lower. Tuesday we saw once again a hold and a trade higher causing shorts to cover, only to lead right into where the market failed on Friday within 1318.25-1331.75.  This is a major range for buyers to squeeze through to show strength and attempt to retest where the market failed at 1336.50-1357.00 as the market tested its 100day moving average which kept a lid on prices and has the market now pressuring against retesting the 200day moving average along with the right shoulder of 1297 built on June 12.  Tuesday the market did show potential as sellers were unable to put in a new low for the week, causing a intraday U turn which built a handle and pushed into highs of 1318.  This push into 1318 is knocking on the door of resistance and is giving sellers their area to defend. Buyers have Tuesday's lows as their reference point to defend pullbacks and use this turn around to attempt to swim against these trends and squeeze through these resistance levels of 1318, 1327, 1336, 1390. Downside support is seen at 1310, break below 1297 gives room to retest the June lows with support at 1282. In the big picture, this is a retest of the inverted head/shoulders that was created mid May into mid June, offering buyers their levels to defend. Failure to do so and a break of the June lows sees room down to next major support at 1209.  We believe this pullback offers opportunity for buyers to step up and trade the long side, scaling out against upside resistance levels and adjusting stops accordingly. The inverted head/shoulders within 1342-1262 offers a 80 point range, if added to 1342, this targets 1422 which is a retest of the year highs at 1419.75.  Ultimately this will give room to run stops against the main May 2008 highs of 1441 which was the reversal that led into the lows of 665.75.  Failure to hold the 1297 level gives the room into retesting those 1262 lows where a break of this gives room to fill the gap from last year down to 1252.50 which puts the sellers into control. The 2nd half of the year begins in July, and how the market trades in the first two weeks will set the tone for the remainder of the year. 


Tags:
Continue reading
3938 Hits