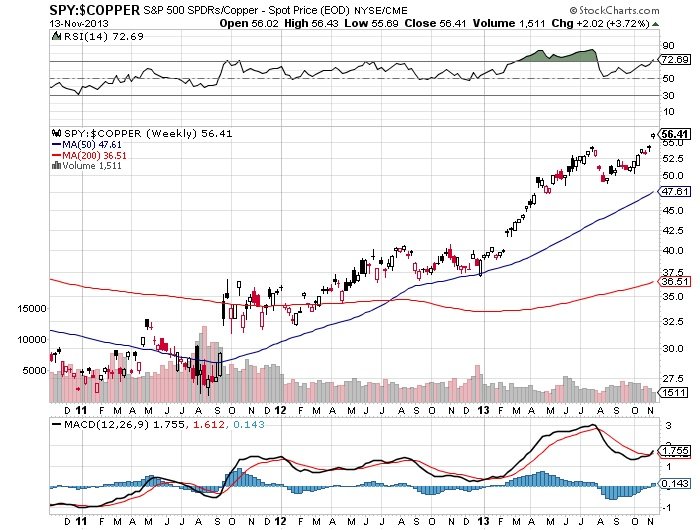
Copper VS SP500 spread breakout above 40 to start 2013 now up 45%.
For 2013, the SP500 is up 25.6% with copper down 13.7%.
3658 Hits

Copper VS SP500 spread breakout above 40 to start 2013 now up 45%.
For 2013, the SP500 is up 25.6% with copper down 13.7%.
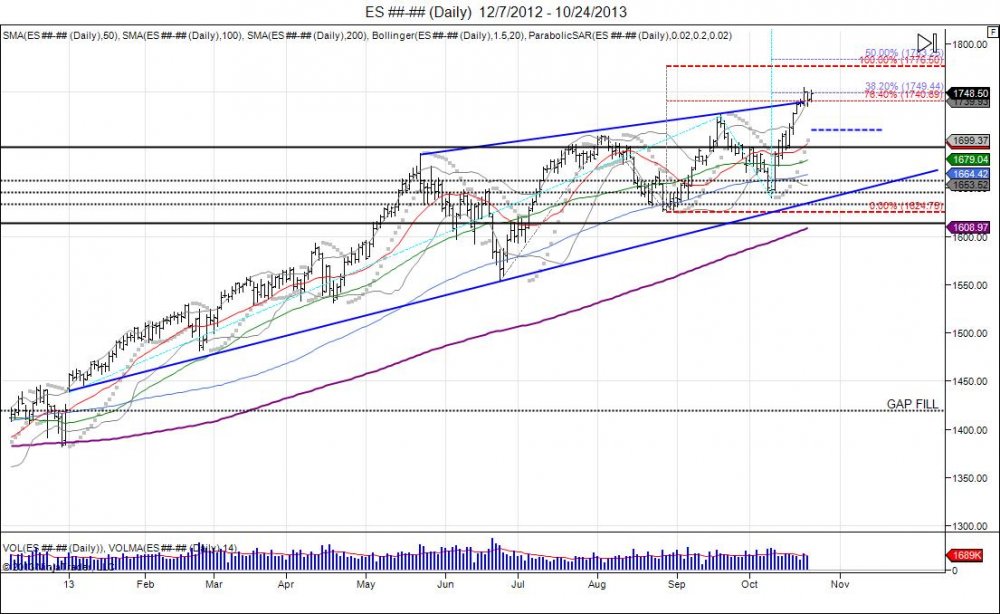
As seen above, the SP500 has enjoyed higher lows and higher highs ever since its biggest correction of the year. This correction attempt started in May, dropping the SP from 168575-155325, 7.9. Since then, we have been in this trend where higher lows have been made as pullbacks become shallower with buyers chasing the market up, and higher highs as shorts have been squeezed with the market taking out the previous highs. Anytime someone is forced to chase a market, it never ends well. The latest squeeze came as the market pivoted off 1640 and ran in the face of a government shutdown and the constant debt ceiling debate. With the September highs taken out, highs of 175450 were made this week on the NFP number release, pushing the market above its rising wedge, and testing fib extensions of 1740-1749. Wednesday attempted to see a pullback only to see the market saved as it held 1736 which has the market back to pressing the highs of the week. This is consolidation taking place as the market attempts to take a breather, yet continues the pressure against shorts and forces buyers to pay up. Push through the weekly high sees the next major resistance levels coming in at 1776 as a 100% fib extension, along with 1783 as a 50% fib extension based off the year low to the September high and October low. Falling below 1736 as a healthy market should, would give way to retest old resistance at 1710 and attempt to build new support. Without this happening, it forces buyers to continue to pay up, which gives way for them to chase these highs and next fib levels to be tested. The trend of higher lows and higher highs since the May correction has not only seen buyers desperate to buy every dip, but also brought major pain to short sellers in attempt to clear them out of the market before the carpet is pulled from underneath. The second half of the year remains in a "bullish bias" and any pullbacks down to 1620 would give buyers a major area to support this bias and keep the momentum. The question is if there will be any buyers left after the market has forced them in with this rising wedge. It will take a period of 7 closes below 1620 to reverse the bull bias and give way to target the June lows for the rug pull and move to fill the gap that began this year down to 1420s.
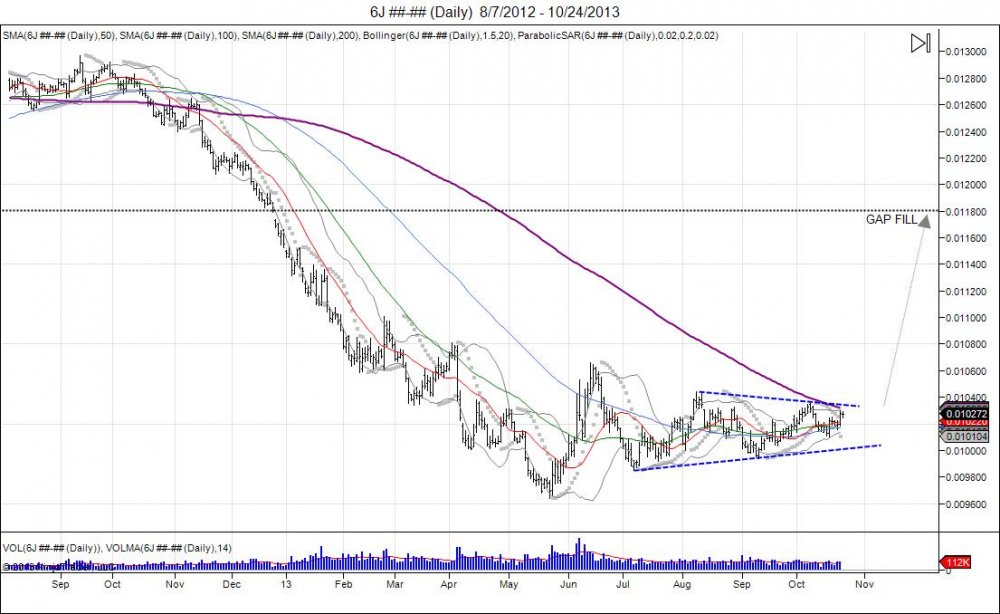
As the SP500 hit a top in May and pulled back, the Japanese Yen in contrast hit a low and squeezed 10 handles off the low. This was followed by a pullback to retest the lows, and ever since then, as equities have gone higher, the Yen has traded sideways and compressed as the 200day moving average on the daily chart has caught up. Since the Yen's original move was from 126 - 96, it is in a bear trend and this sideways action is consolidation of the trend and an attempt to reverse or see continuation of the trend. Currently, the Yen is retesting the October highs of 10357 that rejected the test of the August high. As this spring is compressed, a move above the October high gives way to reclaim 104 and force shorts to cover, giving way for a retest of the June highs at 10663. Reclaiming these highs gives confirmation of a reversal in this bear trend and sees room up to 118 to fill the gap created in November of 2012, just as the SP500 has it's gap of 1420 from December of 2012. Recall the Yen attempted to bottom out at 10340 in March, only to see the Bank of Japan come out with new stimulus that derailed the reversal attempt and slammed the market into new lows down to 9640 printed in May. The squeeze in June led to the BOJ announcement levels which was rejected. This is a major level as a recovery above this is a recovery in the Japanese Yen. Bottom line, for the week, need to see buyers sustain current bid to see new buyers step in next week and close above 104 to squeeze shorts. Failure to hold above 104 and break of 100 sees a retest of the May lows.
The SP500 is back at pressing last month's, keeping the rising wedge of higher lows and higher highs since the May correction. Putting the market back in the hands of sellers to defend just as a deal on the debt ceiling is made.
The last high at 172675 capitulated shorts above its previous high of 1705 as the Fed surprised the market with no taper and no Larry Summers. This was followed by a pullback which failed to see buyers materialize inside 1680s as the gap was filled post shorts being squeezed. Establishing a weekly bearish engulfment and eventually grinding down into lows of 1640 to test last and major support based off the 162475 August low. Sure enough this held to see the market develop a reversal that was fueled by talks of a deal taking place on the debt ceiling. Shooting the SP 60 points back to retesting major resistance within 1710-1715 from the failed high in September. Just as the SP tests this major resistance, Congress has struck a deal with less then 14 hours before the debt ceiling was to be breached. Many are looking for sell the news to take place, and the test of the September highs here is the true tell as to whether buyers can continue to support prices to push through sellers now coming into defend this resistance. For the market to reject this test of the September high, a quick reversal needs to be seen to fall back below 1690 to give way to test support at 1658 based off the 1640 lows. The longer buyers can support prices at these levels, the more pressure to squeeze out the September high and put in another higher high. Should this take place, we see next major resistance levels coming in at 1740 as a 76.4% fib extension, and ultimately 1776 as a 100% fib extension. Keeping in mind the May high at 1685 that led to the biggest correction of the year was also a 100% fib extension. This would be ironic to see the market reach for this number, the year of revolution/America's birth, just as Congress' approval ratings drop to all time lows and they continue to kick the can down the road with no real solutions on cutting spending or the debt.
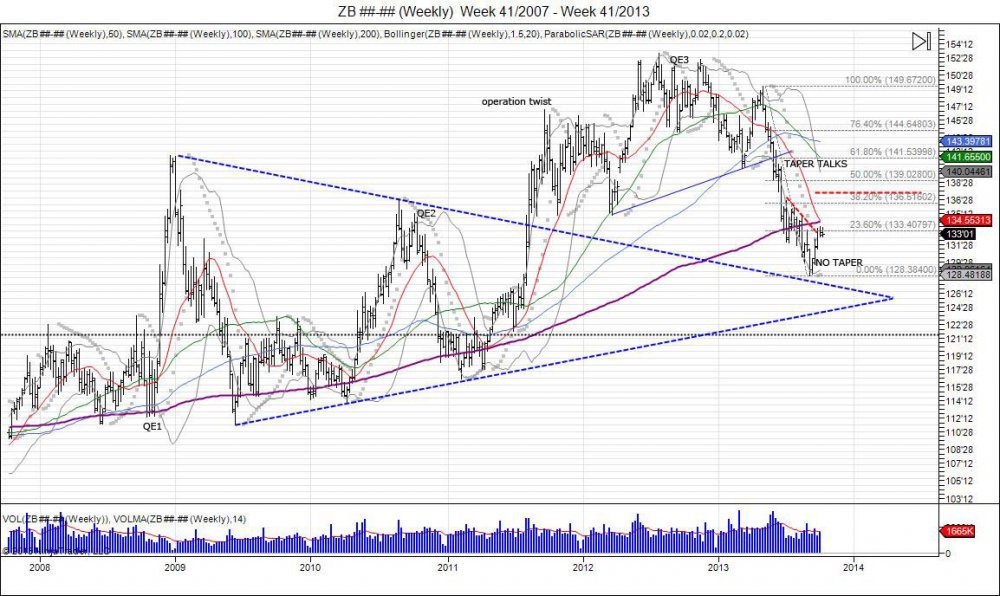
As seen in the above chart, every move regarding QE was front run by the bond market, with the exception of the 1st QE in 2008 that pumped bonds from 112 to 141. When QE2 was announced the market moved lower, from 135s to 116s. September 2011 "operation twist" was announced, with the market having front ran the news 30 points higher to 147. This eventually led to a period of consolidation as the market dropped to 136 before running up to new highs of 152 just in time for the announcement of QE3. Another pullback was seen, down to 140 as the news was sold. With talks and rumors of tapering QE in 2013, this accelerated the downfall into lows of 128, below its 200day weekly moving average. In September 2013 the Fed surprised the market by not tapering QE. This led bonds to unwind and squeeze shorts, reversing from 128-133, back to retesting major resistance at the 200day moving average. The reversal and squeeze of shorts gives new buyers an area to defend down using the lows below 128 as the exit. Objective would be to retrace 50% back to 13900. If the bond market did get oversold as it got ahead of itself expecting no tapering, then the retracement seems reasonable, maybe even to front run another meeting of no taper or even increase of purchases.
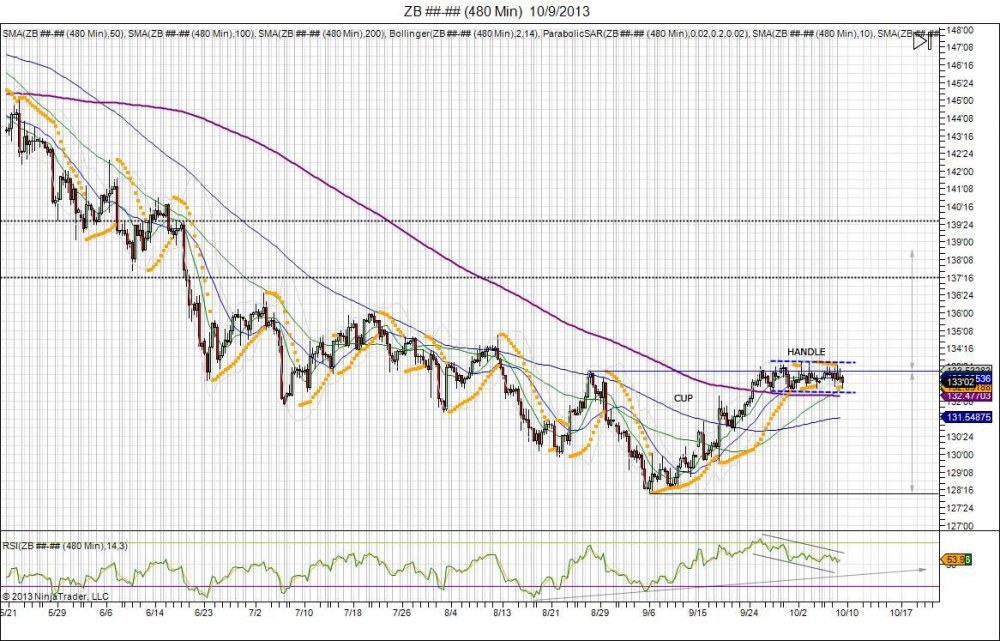
As seen in chart above the 30 year recovered its highs of 13316 from August 27th, rounding out a bottom. This reversal back through this high was done by the surprise of no taper and shorts being squeezed. Over the past 2 weeks the market traded sideways in attempt to consolidate the reversal and build a base for new buyers to step in. The longer the market holds above 133 the more of a base it builds and shorts it lures to force a squeeze. New buyers have to step in to build this base for a breakout to expand the 133-128 range. This expansion of 128-133 that shorts were squeezed from, gives room for new buyers to target 138-138, also a 50% retracement of the bond market from the May 2013 break down. First downside support seen at 13130 based off 12812 lows. Failure to hold lows shows a failure by buyers to step in with next major support at 12630, 12100.
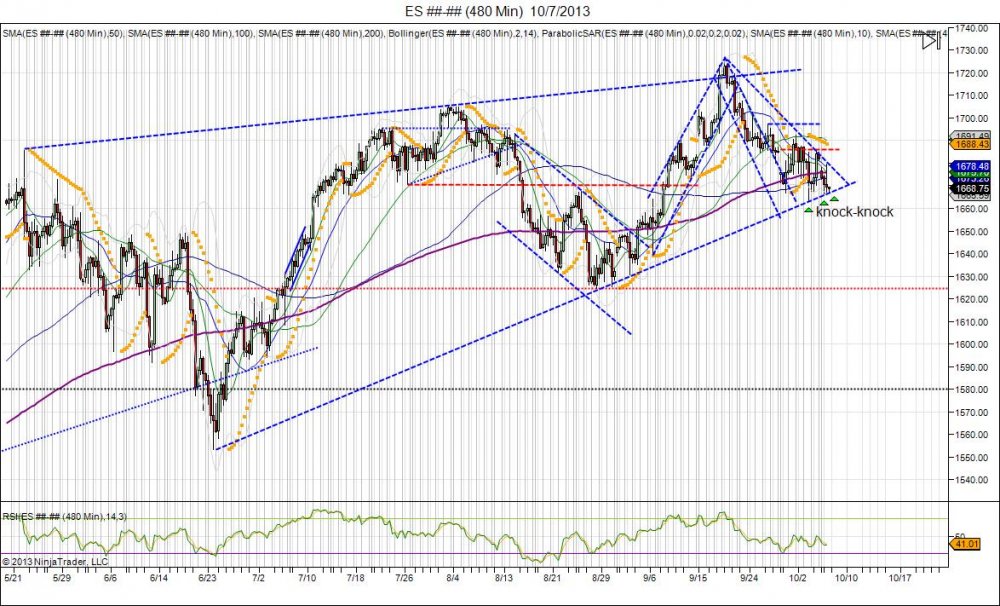
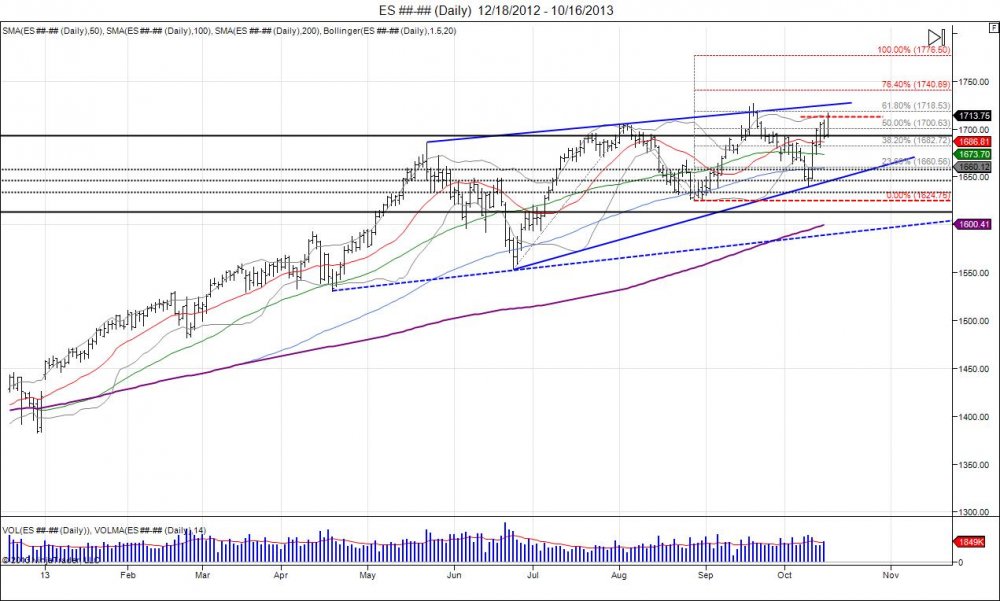
As seen in the above chart, since the biggest correction of the year - 1685-1553, the SP500 has made higher lows and higher highs. These higher lows have come as the pullbacks became more shallow with buyers desperate to get in the market. After putting in a flat top at 1705 in July and falling down to 162475, this was the second higher low after June's lows, and ultimately led to another higher high. The new highs were made as the Fed surprised the market with no taper and no Summers, capitulating shorts as the SP500 briefly took out the top of this pennant up to 172675. Since then, the SP failed to sustain the move, reversing to fall back to where it broke out into those highs at 1682. Coming back to this level gave new buyers an area to defend the pullback after seeing shorts squeezed up to 172675. Thus far, buyers have had a hard time turning the market back up. This has led the market to fall into its rising trend line from the June lows, giving another attempt at "higher lows". This time around, this trend line should not hold. Why? Because not only did we have a failure to sustain the move into 172675 to create a bearish weekly engulfment which have given bears an area to defend up to 1690s, but we also have bulls who are attempting to buy this dip in front of politicians attempting to come up with a deal on the government shutdown. Politics and markets never make a good combination. The bull buying the market now has to factor in this risk. Friday saw the market close on its highs as algos squeezed shorts and bulls hoped for a weekend deal on the government shutdown. When this did not happen, the SP opened 8 handles lower on Sunday, putting in the 2nd Sunday in a row where the market gapped lower. This has led the market to once again knock on its support trend line where bears are looking to breach the level and chase down to take out the June lows of 162475. Once this takes place, buyers from these levels will be shaken out and the market will confirm the move up to 172675 was a failed higher high. From here the projection can be seen for a retest at 1690 to develop a right shoulder for a head/shoulder topping pattern. For this to take place again, the market must confirm weakness by taking out the August lows and breaking this trend of higher lows and higher highs. For shorts to squeeze, 1692s must be taken out, which can then give way for a test of major resistance into 1710s. A strong bear in control will not allow this to take place. The market now has someone to blame when moving lower, and that will be the GOP, while "no taper" decision will look smart, when in fact, thus far it has marked the highs.
Risk Disclosure: Futures, foreign currency, and options trading contains substantial risk and is not for every investor. An investor could potentially lose all or more than the initial investment. Risk capital is money that can be lost without jeopardizing one's financial security or lifestyle. Only risk capital should be used for trading and only those with sufficient risk capital should consider trading. Past performance is not necessarily indicative of future results. Video content hosted by a third party.
Live Trade Room Example: This presentation is for educational purposes only and the opinions expressed are those of the presenter only. All trades presented should be considered hypothetical and should not be expected to be replicated in a live trading account.
Hypothetical Performance Disclosure Example: Hypothetical performance results have many inherent limitations, some of which are described below. no representation is being made that any account will or is likely to achieve profits or losses similar to those shown; in fact, there are frequently sharp differences between hypothetical performance results and the actual results subsequently achieved by any particular trading program. One of the limitations of hypothetical performance results is that they are generally prepared with the benefit of hindsight. In addition, hypothetical trading does not involve financial risk, and no hypothetical trading record can completely account for the impact of financial risk of actual trading. for example, the ability to withstand losses or to adhere to a particular trading program in spite of trading losses are material points that can also adversely affect actual trading results. There are numerous other factors related to the markets in general or to the implementation of any specific trading program which cannot be fully accounted for in the preparation of hypothetical performance results and all of which can adversely affect trading results.
© 2022 Chicagostock Trading. All Rights Reserved.