Who is Johnny 5?
Latest wave in SP500 1530.75-1685.75:
(click chart to enlarge)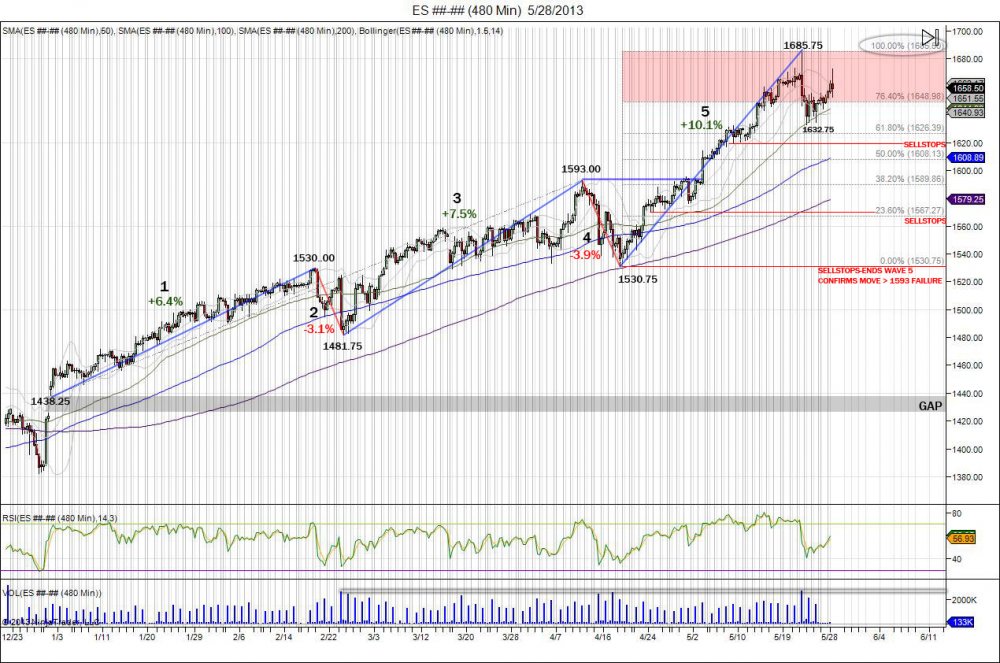
SP500 8 hour chart above showing year to date trade.
First 6 months of 2013 = 5 waves:
Wave 1: 1438.25-1530.00 +91.75 6.4%
Wave 2: 1530.00-1481.75 -48.25 3.1%
Wave 3: 1481.75-1593.00 +111.25 7.5% AVG VOLUME 9,436,701
Wave 4: 1593.00-1530.75 -62.25 3.9%
Wave 5: 1530.75- *1685.75* +155 10.1% AVG VOLUME 9,344,753
Since blowing through 1593, the chase trade by buyers and short squeeze pushed the market to complete its 62.25 range (1593-1530.75) up to 1656. This did not stop with the SP500 pushing through this, 1666, and into the top level of 1685.50 to extend the range 100%. As shorts capitulated through 1673 into 1685, bulls used the bid to take profits into. This led to a 3% decline down to 1632.75, shaking out the first 1646 level of sell stops. The move was fast after the bear capitulation as sellers had to now chase. With market falling into 1630s, bears chasing lows have been grinded out as market has used these bears to run stops above 1655 and into testing the 1670 level being where the SP failed off the high. The move has given more patient bears there chance to get in, now its up to see if they are stronger then this bull. The bull has support at 1654 and sell stops below 1644. Sell side gains ground with break of 1644 to retarget the 1632.75 low to confirm move above 1655 was failure. Buy side needs to hold 1655 to continue pressure to retest 1672.75 from today's failed high.
Below is an excerpt of the 5th wave description in "Wikipedia"
"Wave 5: Wave five is the final leg in the direction of the dominant trend. The news is almost universally positive and everyone is bullish. Unfortunately, this is when many average investors finally buy in, right before the top. Volume is often lower in wave five than in wave three, and many momentum indicators start to show divergences (prices reach a new high but the indicators do not reach a new peak). At the end of a major bull market, bears may very well be ridiculed" (Source: Wikipedia - Elliot Wave Principle)
Ofcourse, this looks exactly like text book, wave 5 everyone is bullish, average investors forced to chase above 1593, and volume thus far has been lower then the 3rd wave. The 5th wave momentum continues until the pivot low of 1530.75 is taken out to confirm move above 1593 was a failure.
Same chart above, zoomed into last wave 1530.75-1685.75 (click chart to enlarge):
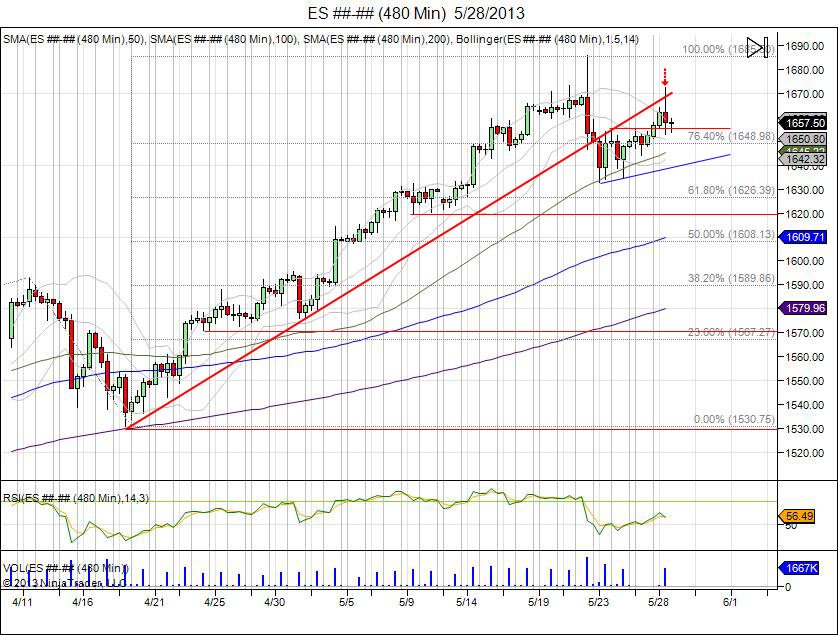
(click chart to enlarge)
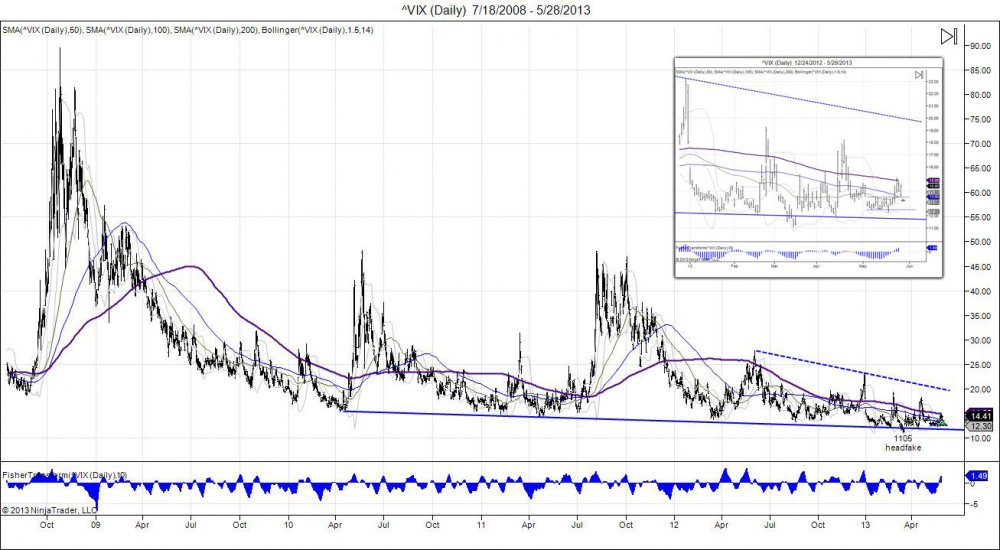
Keep an eye on the fear index - VIX. After consolidating the 13 support level for 3 weeks, the market broke out last week above the range of 1353. This was tested today as volatility came to retest this level and see if breakout is any good. Going forward, 1353-1300 gives the index support with a break of the past 3 week lows of 1226 as failure, followed by 1105 in March which was the "headfake" below the longer term support line. Holding above 1353s gives the volatility index room to expand up to 18-20.
Subscribe for precise entry/stop/target levels.
RISK DISCLOSURE: PAST PERFORMANCE IS NOT INDICATIVE OF FUTURE RESULTS. THE RISK OF LOSS IN TRADING FUTURES AND OPTIONS IS SUBSTANTIAL AND SUCH INVESTING IS NOT SUITABLE FOR ALL INVESTORS. AN INVESTOR COULD LOSE MORE THAN THE INITIAL INVESTMENT.

