Chicagostock Trading

Chicagostock Trading

DONE BEFORE THE OPEN

1-8-12b_1.jpg


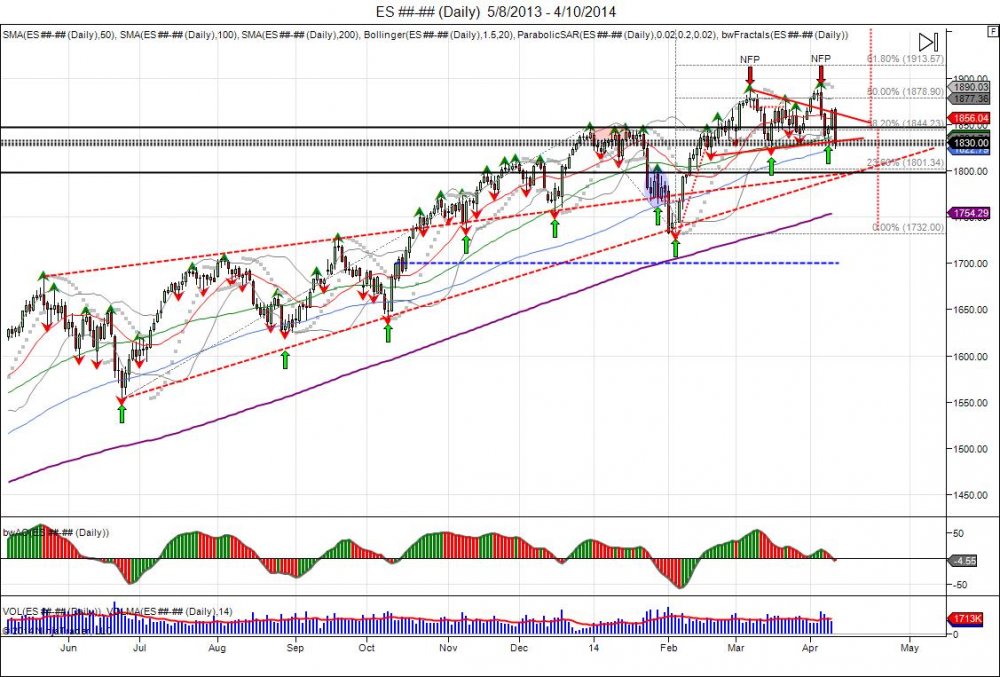
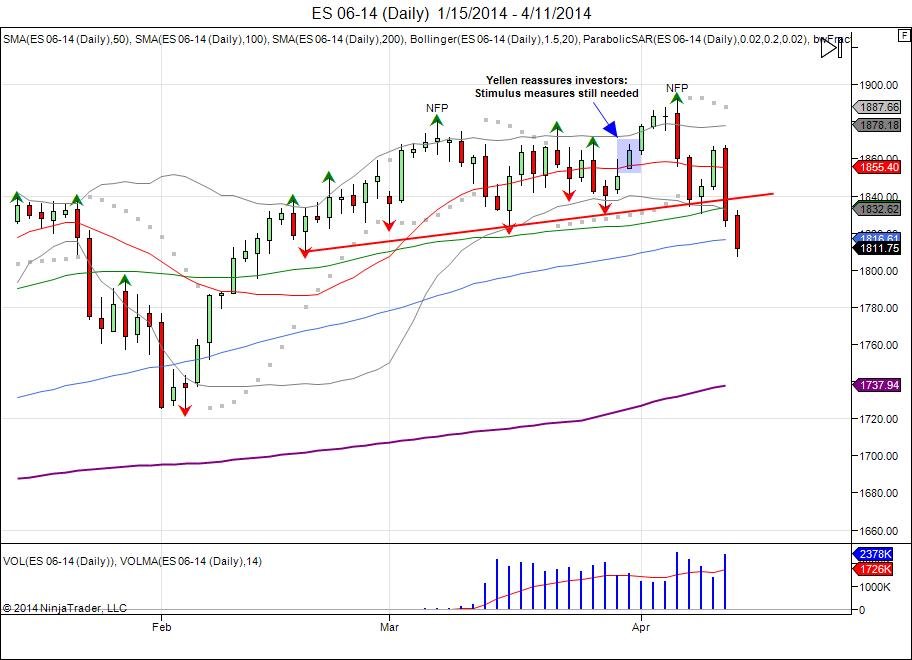
Coming into this week, tax day and a shortened holiday week was tricky. We had FRB chair pump the markets end of March into new highs reassuring investors of continued stimulus, only to see the NFP numbers double top the market and the rally get sold into.  The selling picked up with the March lows taken out, confirming a short term double top as it shook out longs and left buyers from the "stimulus" talk trapped.  This led to a breakdown on Friday with lows of 180725 going into the weekend.


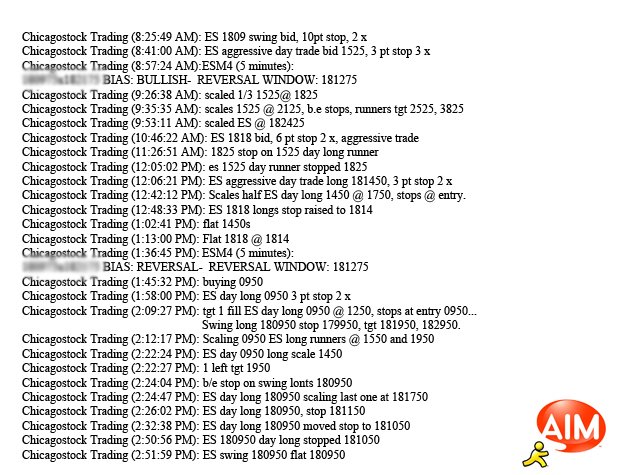
On Friday our systems triggered many buy signals which gave opportunity to collect up to 32 handles from base hits during the day, however the market remained weak on Friday. Settling near the lows, this put pressure for a flush to take place going into Sunday. This was seen Sunday night with new lows down to 180325 before reversing higher. This triggered new buy signals at 180650 with a 5 handle stop for aggressive buyers.  Going into the cash open, the market had retraced up to 182375 allowing to lock in majority of profits and allow runners to work for a day on cruise control. The cash open was followed by profit taking seeing the market fall into lows of 181550 to allow intraday buyers an area to defend, which they did and pushed the market up to highs of 182800 to test the upper vol window. Profit taking led the market to run out of gas and see a shake down into the afternoon, falling down to 180825 to retest the overnight lows before seeing a squeeze up to settle at 182450.  Flushing intraday buyers, luring in shorts sub 1815 and squeezing 10 higher.


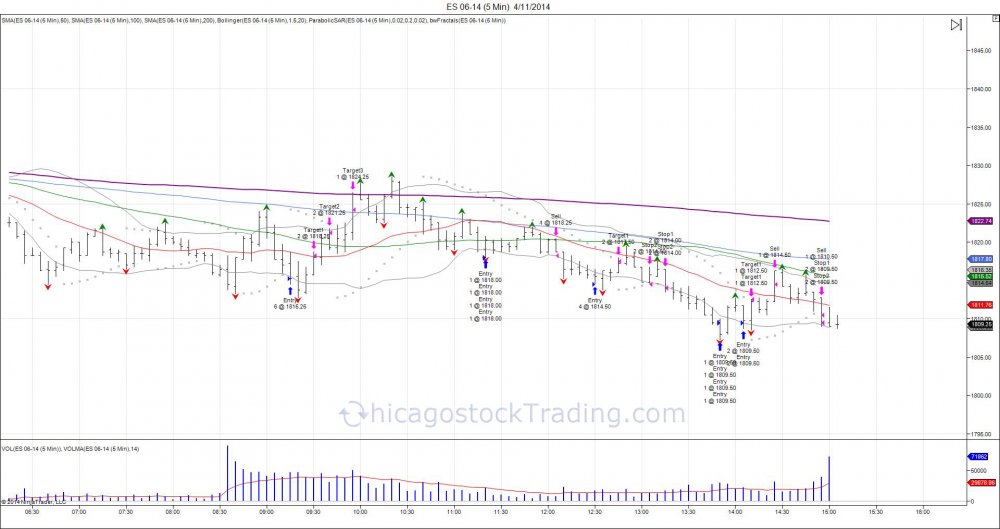
Monday 04/14/14 reversal off lows:

1-8-12b_1.jpg

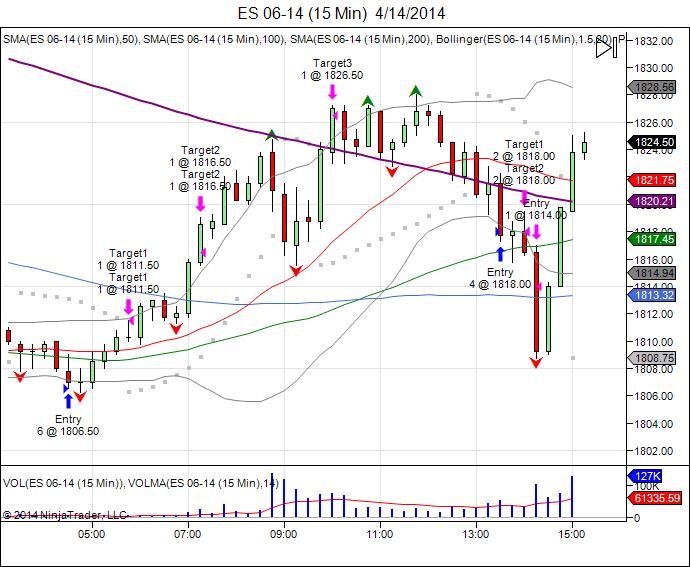
CST aggressive long signal @ 180650.

Target 1 181150, Target 2 181650 completed prior to the open to lock in 15 handles with runners. Target 3 was scaled at 182650 to lock in 20 handles and leave 1 contract on with a 1814 stop. Afternoon attempted to buy 4 more at 1818 only to see the market dance at the level too long, in turn scratching the position at 1818. Flush kicked out the overnight 180650 runner at 181400. On 6 contracts, 57.5 handles locked in. If one only bought 3 contracts @ 250 risk each total risk of 750, would have allowed to take tgt 1 181150, 2 181650, and 3 at 182650 to lock in 35 handles.

Tags:
Continue reading
2467 Hits

DAY TRADING TODAY'S DOWN TAPE

1-8-12b_1.jpg


Buying the SP500 today with the market breaching the March 182350 lows to open at 1816 was not an easy task, nor was it impossible. The market provided opportunities intraday for longs to defend. The cash opened at 1816, followed by a squeeze through 1821 to establish a bullish intraday bias which was followed by a shakedown to the reversal window at 181275, offering buyers an opportunity to defend.  This new low and test of reversal window failed to continue lower, seeing a squeeze back through session highs and up to 182850 to test major resistance off the overnight highs of 1832. Failing to get through, the market retraced lower to retest the 181275 session lows which was followed by a small bounce up to 181950. This bounce failed to push through resistance and regain above 1822, seeing sellers take control (read post: Running out of buyers?) and take out the session lows to fall into 180725, squeezing out session longs and luring in late sellers below 181275.  This new low was followed by a bounce up to 181650, once again failing to push through resistance before falling back to 180950 into the close and settling at 181175.


With the market settling 15.50 handles from Thursday's close, actively day trading the SP still allowed to collect 32 handles on all LONG trades.  It is always more aggressive to go against the tape, however if risk is defined and reward opportunity is healthy, a day trader can trade any tape long or short.

Below is the AIM feed sent out to Chicagostock members.

1-8-12b_1.jpg

Tags:
Continue reading
964 Hits

DAY TRADING SP500'S DOUBLE TOP

Both peak highs in 2014 were made on NFP days and only 1 month apart. 

Below are videos on Chicagostock's day trading signals


Trading March 7th Non Farm Payroll Number:


Trading April 4th Non Farm Payroll Number:

Continue reading
3031 Hits

RUNNING OUT OF BUYERS?

1-8-12b_1.jpg

Since reversing off the year lows of 1732 and through December's high to squeeze shorts, the SP coiled in a sideways range in attempt to find new buyers following that V shaped short squeeze.  The first peak high was made at 188750 in March on Non Farm Payroll numbers.  This was followed by a reversal down to 182350 mid March, before climbing back up to 1877 as the pullback was bought and the 6 month pivots turned into support.  Breakout attempt was seen early April, having to take the FRB chair to say stimulus is still needed to in order to trigger new buying to run the market into new highs setting up a jump ball on the NFP numbers that were released early April. New all time high were made by 5 points up to 189250, again on Non Farm Payroll numbers and was followed by profit taking and sellers pressing the market post NFP release. Both peak highs being made going into the jobs numbers that were both followed by immediate profit taking. The last high is more troublesome as new highs were made only to fail to continue higher, seeing a reversal back down to press and retest the March lows of 182350.  First test of this led to a bounce this week on the FOMC release the 6.5% unemployment target for the fed funds rate would be removed.  The initial reaction was an embracement by the market, seeing a bounce up to 1867 before running out of gas and reversing back down to close below the recent low of 183075 prior to that FOMC release.  Once again the market brushing off stimulus promises and a pull of the 6.5% unemployment rate that suggests rates can remain low longer. 

Going forward, pressure is being put now against the prior low of 182350 made in March to shake out longs and confirm a short term double top.  A weekly close below 1850 is bearish and creates a new range of resistance within 1850-189250.  Looking at the action made in 2014, with the early sell followed by the V shaped recovery that was fueled by shorts being squeezed, the market traded above those prior highs for 2 months in attempt to build a base and attract new buyers following the short squeeze. Failure to build the base and hold above the 2013 highs, suggests enough new buyers are not coming in to sustain the V reversal to expand higher.  If new buyers are not coming in, then the bus may be too full and this gives room to expand lower to target the year lows and confirm a failed breakout with major support at 1700 based off the October low.  Failure to hold the 2014 low of 1732, breaks the series of higher lows the market has enjoyed since the last major low of 1553 in 2013 when investors feared tapering before being squeezed up 300 points.  By taking out the last major low at 1732, this breaks the upward momentum, and gives room to move down into testing levels from 2013 and attempting a gap fill down to 1420.  Support off the year lows is seen down to 1750 for buyers to defend.

VIDEO: Watch Chicagostock's day trading signals on both peak highs.

Continue reading
4196 Hits

CAPITULATION LEVELS

Nasdaq futures are staging the ultimate retest as the market is now 500 points from testing major resistance of where the market failed during the dot com bubble. By taking the low of the last major correction at 281775 (May 2013), using the January high of 362525, and the last recent low of 3412 made February of this year as the market’s attempted to breakdown only to fail, this gives upside fib extension levels of where the market can lead to. Thus far we have seen the market extend 38.2% at 3724, being where and what the market is working on now. Continuation of holding above the early 2014 high of 3635, this gives room to continue the squeeze higher as shorts capitulate. A 50% fib extension is met at 3821, followed by 3858 to complete the range expansion from 3635-3412 up to 3858. MAJOR resistance is met within 3900-4230 as the top level of the fib extension, being a 100% extension of the failed breakdown this year from last year’s move up. The first test of this range, should be sold with both hands forward, as this is the first test of the dot com bubble.


Continue reading
3626 Hits