Click chart below to maximize.
more...
8732 Hits

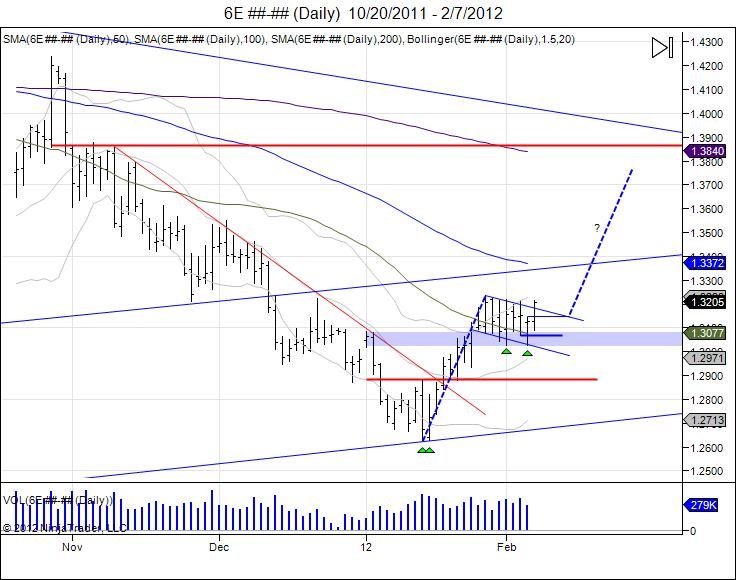
Since the Euro's double bottom in January, with lows of 12627 on the 13th and 12628 on the 17th, the market trapped shorts who were looking for the breakdown and used as fuel to squeeze above 12884 being the highs from January 13. This squeeze led to reversing the downside momentum and short covering as the market rallied through the year highs of 13085 and up to its next major resistance being 13237 from December 13 where this down leg started. After hitting this resistance of 13237 and 6 handle move off the lows, the Euro went into consolidation period, building a flag for the move from 126-132. This flag built right above the year highs of 13020-13085, being the new level of support as the year highs was conquered.
more...
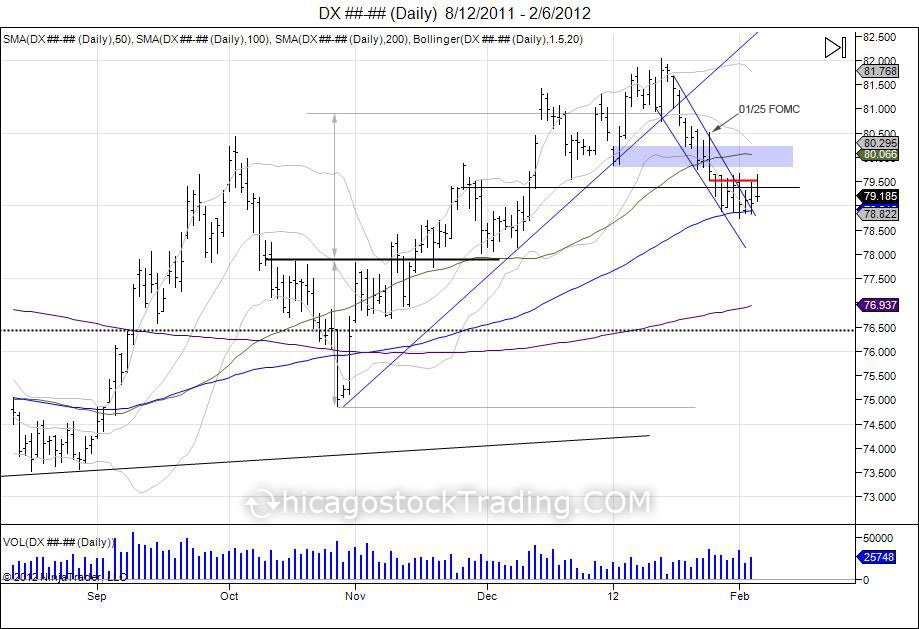
Since the US dollar put in its “Island Bottom” in October of 2010 with the failed breakdown of 74860, the market reversed to create an inverted head and shoulders with a neckline of 77855, targeting 8100. After breaking through its neckline in November, this 77855 level turned into support and the short squeeze was on as the market squeezed into completing its inverted h/s at 8100. Consolidation was seen at these highs with a tug of war taking place. The market began 2012 on Jan 3rd with lows of 79830 and highs of 80225. Following this first day of trading, the market ran into new highs, touching off at 82045 on January 13, 2012. This 8200 level turned into the last hoorah for the short squeeze, trying to get as many shorts out as possible, as the market began to roll over and broke its uptrend line from the October lows on January 18th. Following this break of the uptrend, the market began trading in a newly formed channel pointing down as it targeted the year lows at 79830. These lows for the year were eventually taken out on January 23rd, leading up to the January 25th FOMC statement by the Fed chairman Ben Bernanke. On the 25th as the Fed released their FOMC statement, the US dollar had attempted to rally, however failed. Putting in highs of 80505, only to reverse into lows of 79515. Since this FOMC and break of the year lows, this level has now turned into major resistance for the past 2 weeks at 79515. The year lows that was support at 79830 has also turned into major support as the market reversed its early momentum in the year. At this point the market has reached its 100day moving average on the daily chart and has been in consolidation mode in a fight to hold this support as upside resistance is being tested. Pressure remains to the downside now with the Jan 3rd range of 79830-80225, followed by the FOMC high at 80505 as major resistance. A push past these levels would be needed to get buyers back into control, however only leading to retest the next major resistance coming in at the year highs at 8200 where a failure would create a right shoulder. The question is will the market rally up to test this high and give sellers an opportunity to get out or continue this chase to the downside. Buyers who did not get out in time from last year’s rally are now seeing the pressure turn against them. Below the 100day moving average on the daily, next major support comes in at 77855 being the old neckline from November, followed by the October head at 74860 and year lows of 72860.
more...
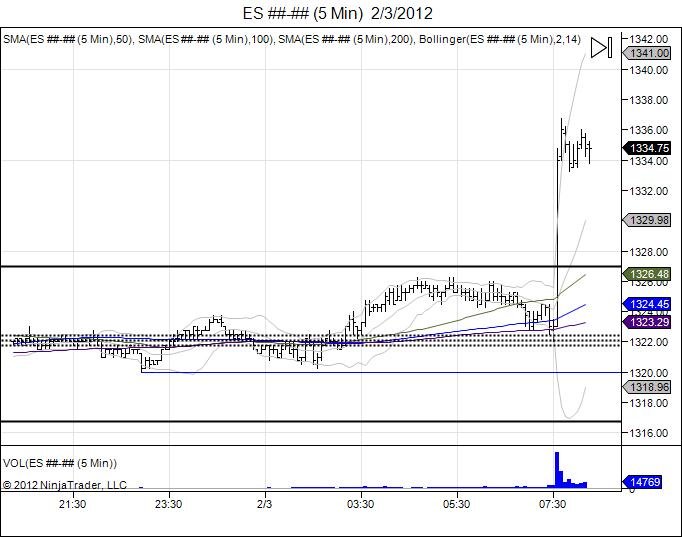
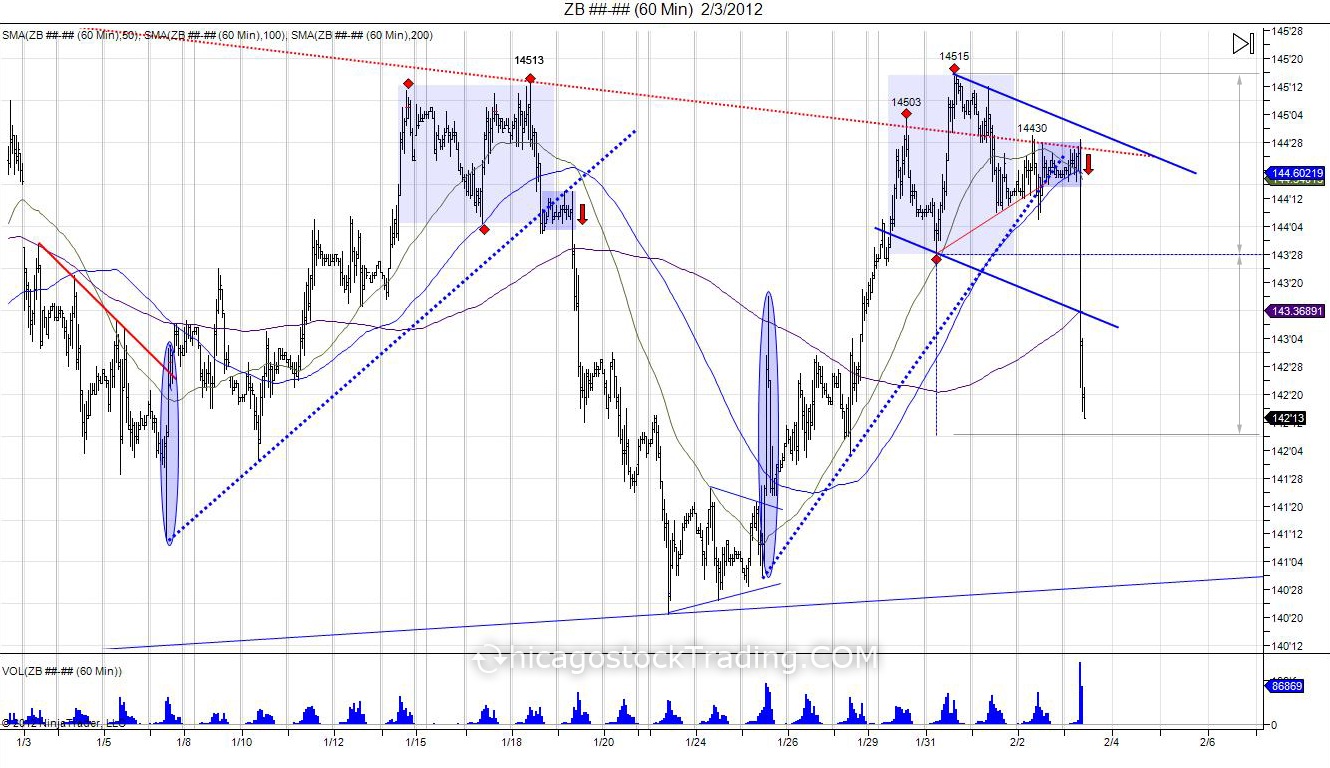
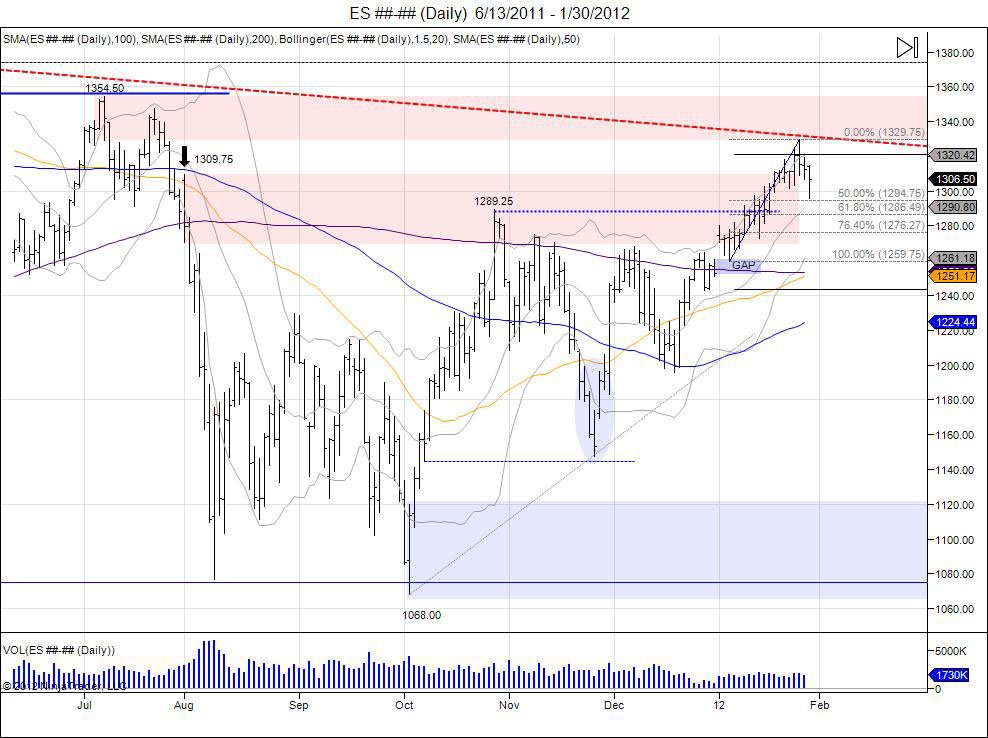
Non Farm payroll numbers released this morning showing an increase of 243k jobs and unemployment rate of 8.3%. This let the market to rip through 1330 into highs of 1336.75. Rewarding overnight buyers:
more...
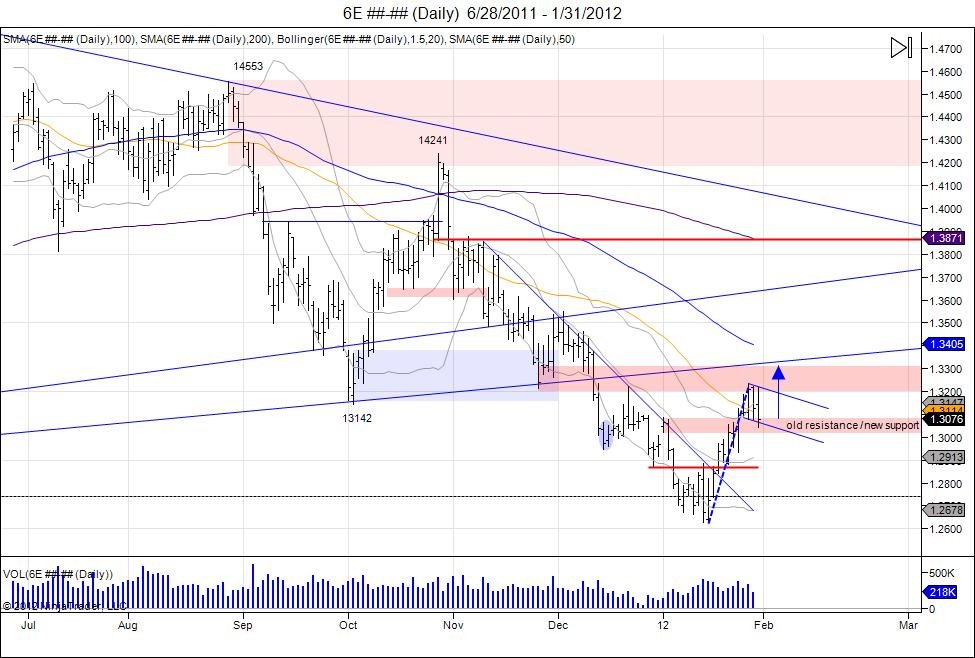
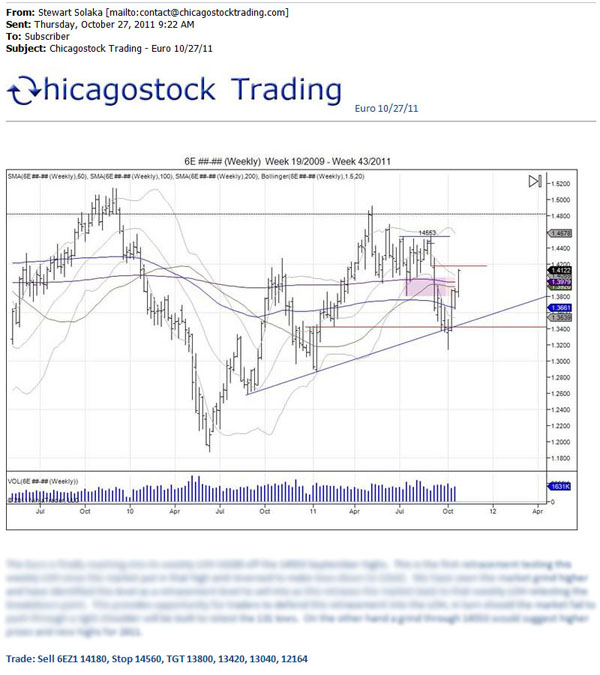
Since the Euro reversed its downward trend mid January by climbing above 12900 and through the downward trendline, the market has gone into a short squeeze which led the market to take out the year highs at 13085 and bump against resistance from December 13th at 13237.
more...
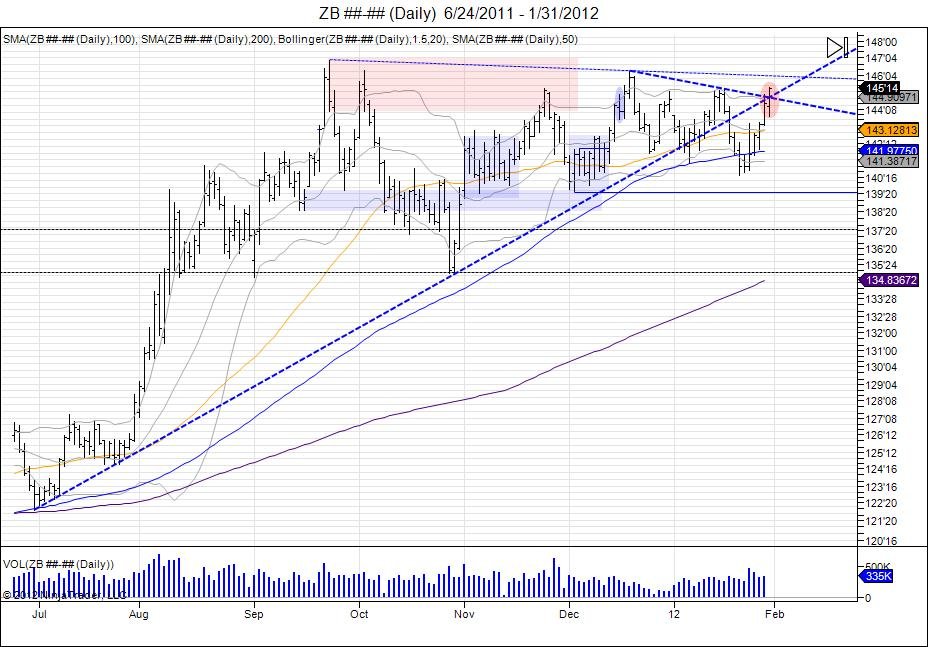
'X' marks the spot in the 30 year bond market as it squeezed through where two major trendlines crossed. The first major trendline being the June-October lows and the trendline from December - January highs.
more...
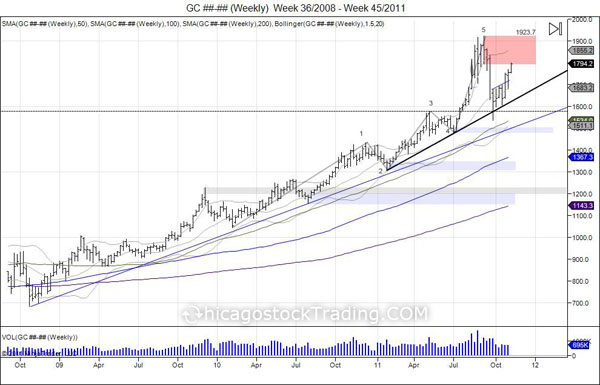
In November, the gold bounce from 1535-1804 was recommended to sell against. By December gold fell back to clip the 1535 lows with a new low at 1523.9 before turning back. This offered oppurtunity for aggressive traders to short the market and profit on the way down, along with oppurtunity for gold bugs to use the pullback as an area to defend and buy physical considering the market was $300 more just a month back.
more...
On October 27th 2011, Chicagostock Trading recommended selling the Euro at 1.4180:
more...
Risk Disclosure: Futures, foreign currency, and options trading contains substantial risk and is not for every investor. An investor could potentially lose all or more than the initial investment. Risk capital is money that can be lost without jeopardizing one's financial security or lifestyle. Only risk capital should be used for trading and only those with sufficient risk capital should consider trading. Past performance is not necessarily indicative of future results. Video content hosted by a third party.
Live Trade Room Example: This presentation is for educational purposes only and the opinions expressed are those of the presenter only. All trades presented should be considered hypothetical and should not be expected to be replicated in a live trading account.
Hypothetical Performance Disclosure Example: Hypothetical performance results have many inherent limitations, some of which are described below. no representation is being made that any account will or is likely to achieve profits or losses similar to those shown; in fact, there are frequently sharp differences between hypothetical performance results and the actual results subsequently achieved by any particular trading program. One of the limitations of hypothetical performance results is that they are generally prepared with the benefit of hindsight. In addition, hypothetical trading does not involve financial risk, and no hypothetical trading record can completely account for the impact of financial risk of actual trading. for example, the ability to withstand losses or to adhere to a particular trading program in spite of trading losses are material points that can also adversely affect actual trading results. There are numerous other factors related to the markets in general or to the implementation of any specific trading program which cannot be fully accounted for in the preparation of hypothetical performance results and all of which can adversely affect trading results.
© 2022 Chicagostock Trading. All Rights Reserved.
 12_10_2010 - 1_27_2012.jpg)

