Chicagostock Trading

Chicagostock Trading

SP500 & Nasdaq Back to Bottom of Rising Wedge

1-8-12b_1.jpg


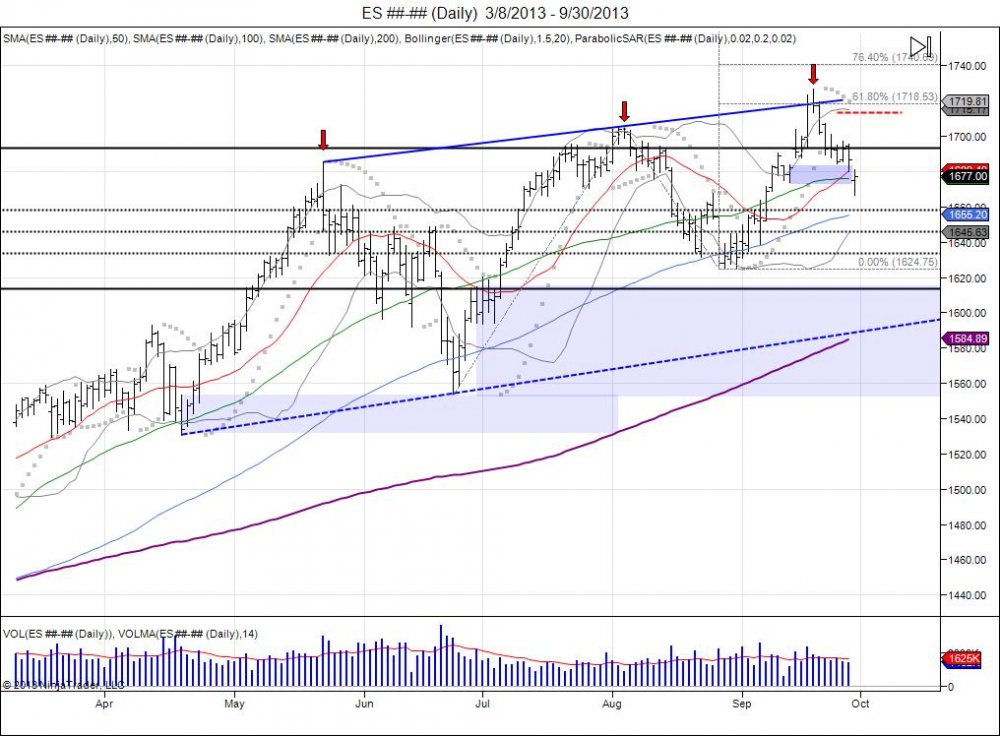
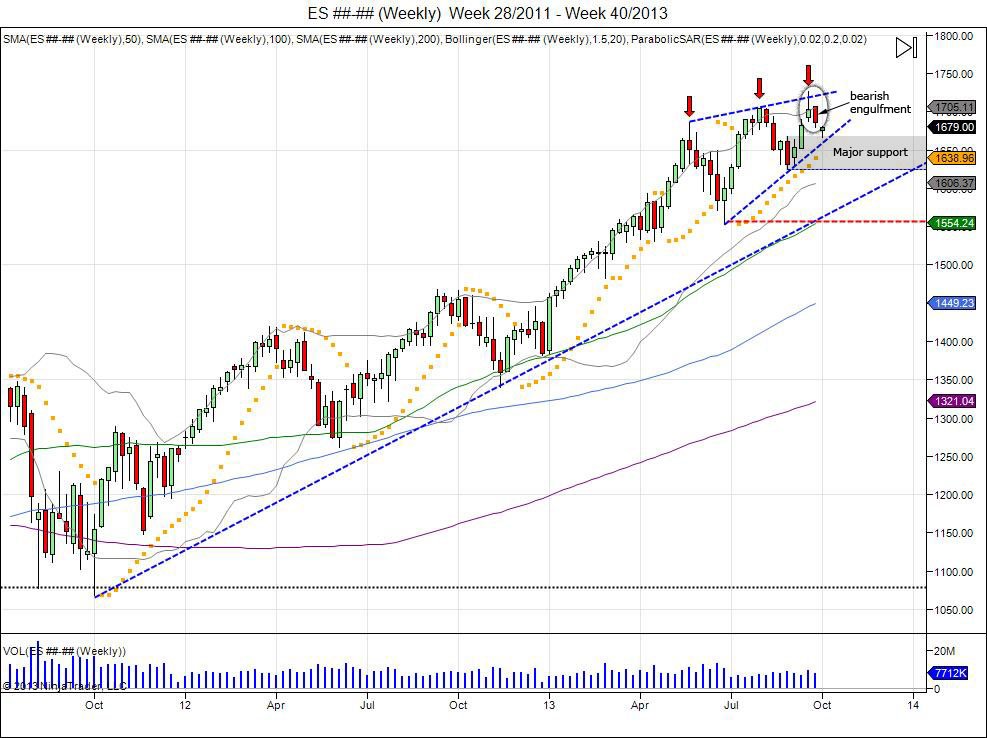
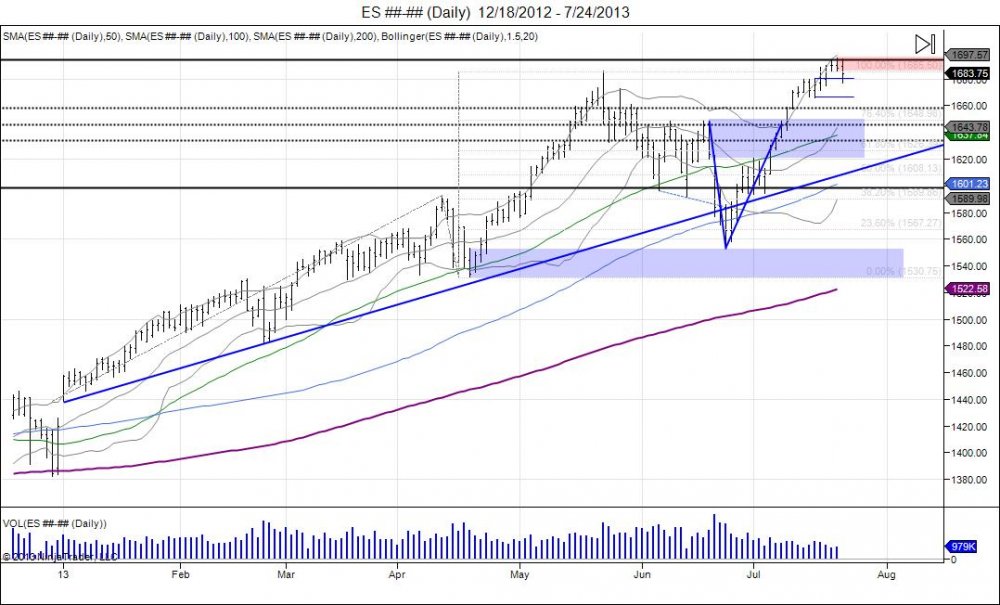
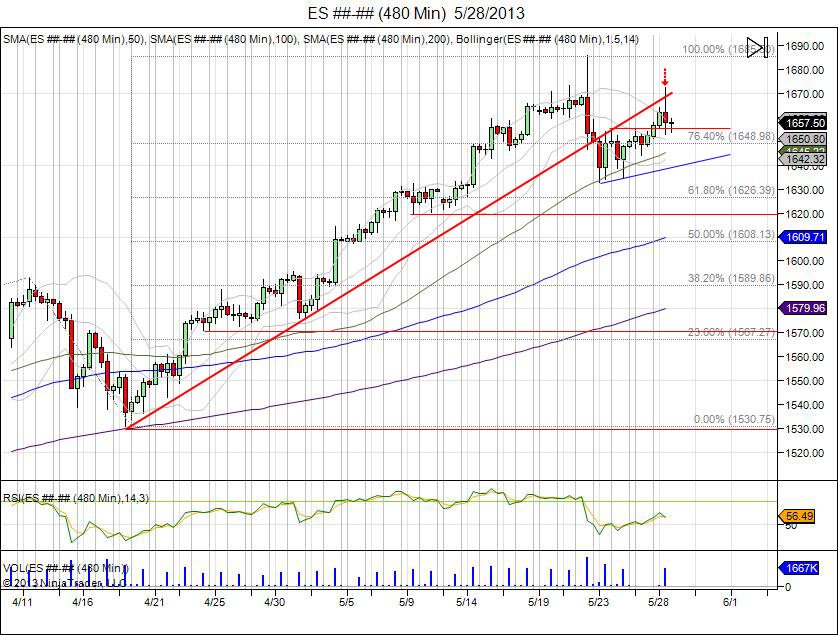
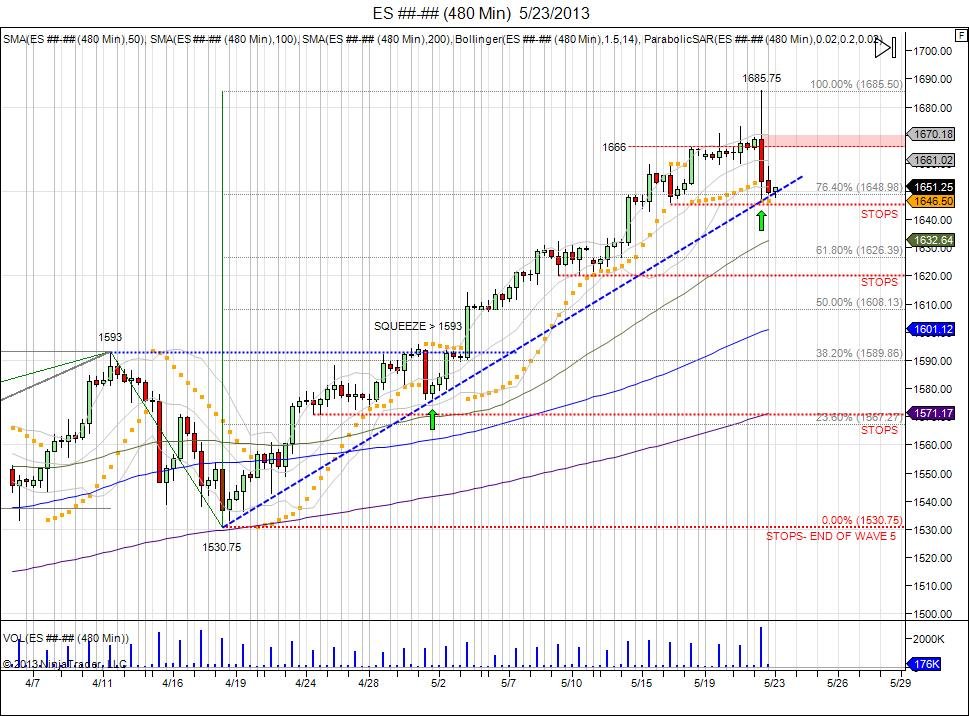
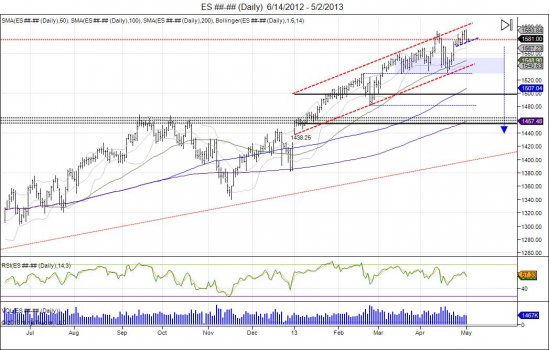
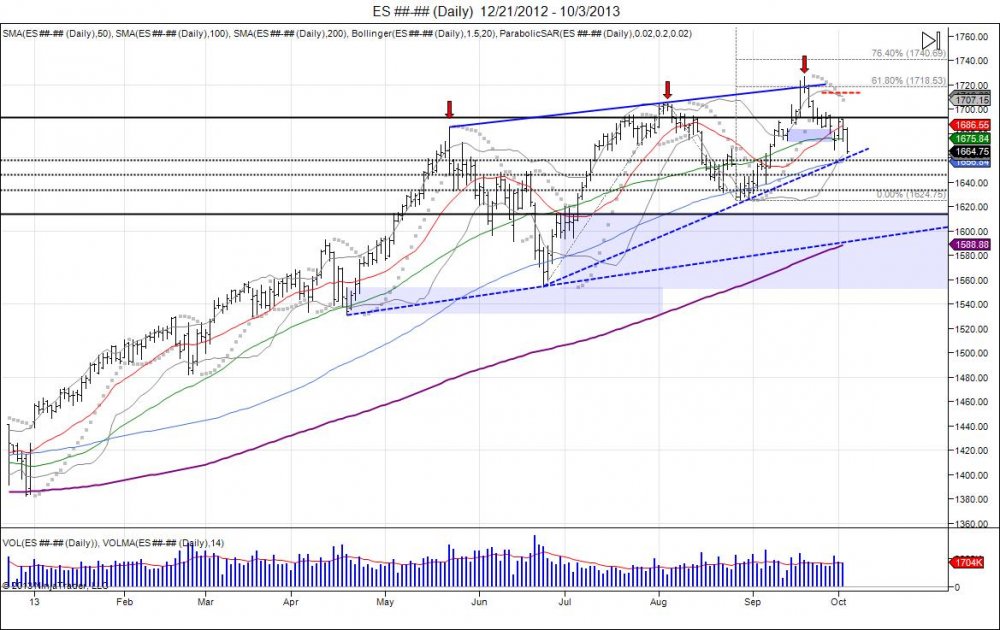
The struggle to top since the first correction in May from 1685-1553, being the most violent of the year, led to higher lows and higher highs as new highs squeezed shorts and every dip became more and more shallow. Buyers continued to pile into these dips making them more shallow, afraid of missing "the next leg up". This recipe is what makes the rising wedge, and a recipe for disaster as bulls and bears make money, but hogs g slaughtered. Thus far the surprises from the Fed on "no summers" and "no taper" have held as the highs as shorts capitulated into 1726s and market gave it all back the following week. Bulls have another opportunity to make a higher low here as the market comes into this support line from the June lows. Failure to hold the August lows of 162475 break the wedge to give way for a test of the June lows to confirm the failed higher high up to 1726.


1-8-12b_1.jpg


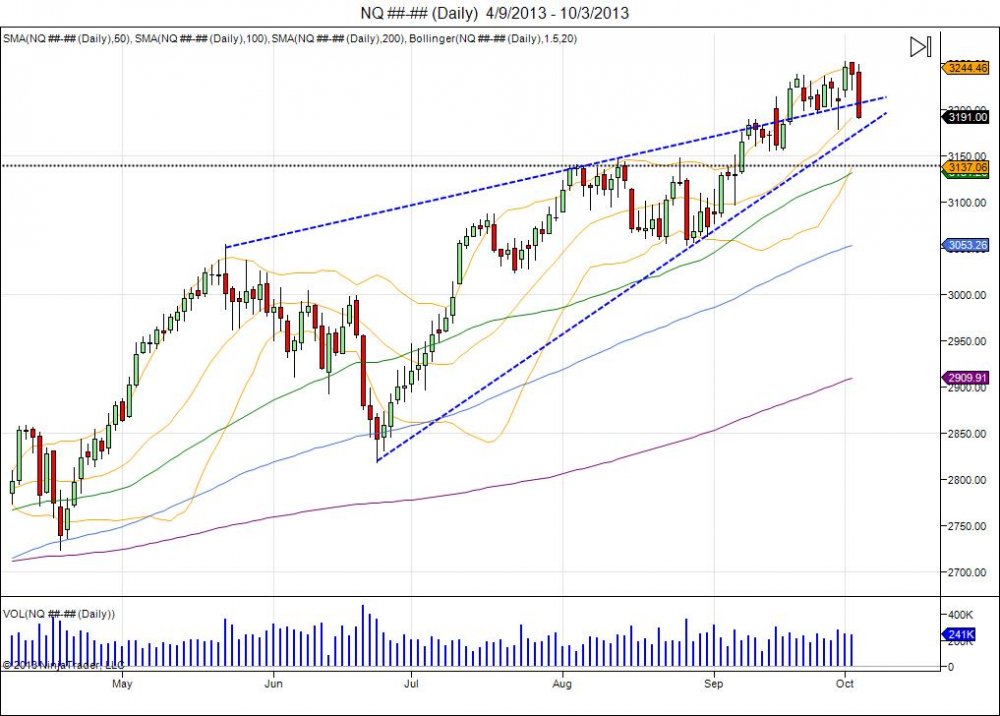
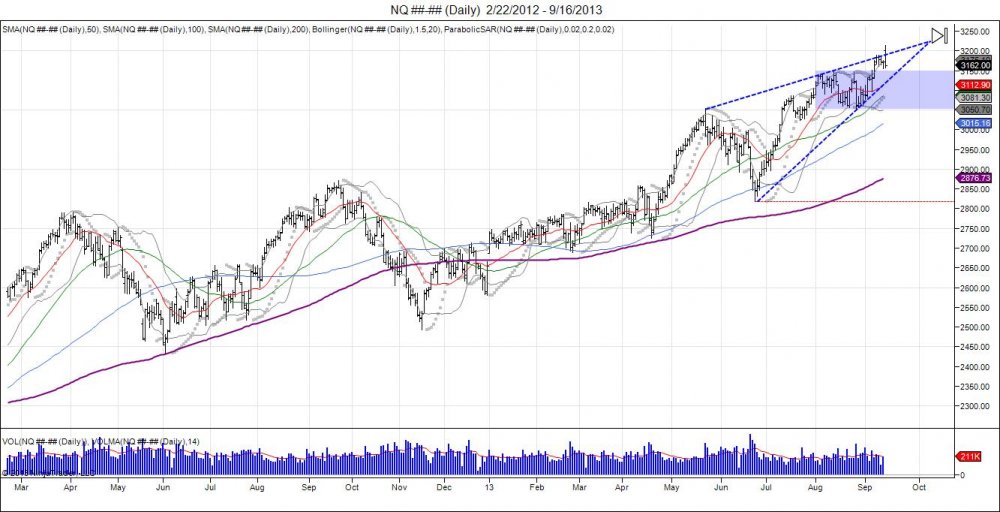
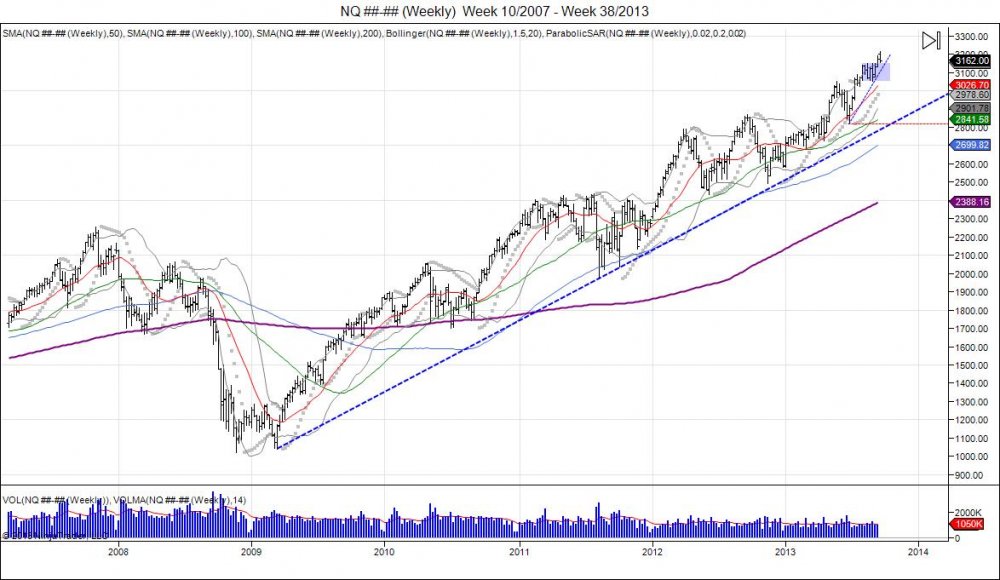
Nasdaq chart shows breakout above rising wedge to squeeze shorts and move back inside wedge to retest support.  This can lead to a water fall effect with confirmation of top on a break of 3055.

Continue reading
3087 Hits

SP500 Market Update

Picture1.jpg


1-8-12b_1.jpg


The Emini SP500 rallied once again into the top of its resistance line from the past 2 highs this year on the surprises seen 2 weeks ago with "no summers" and "no taper".  This led the market into highs of 172675 as shorts capitulated, before seeing a reversal that retraced the market back to where it broke out.  Last week, the market fell to take out the lows of 168775 based off those weekly highs of 172675.  This retracement gave way for new buyers to come into support the market post the short squeeze as it came back to its breakout point, however the weekly close below 1693 established a bearish engulfment on the weekly charts, and the close below 168775 further setup bearish signals.  This sees the market coming down to test its major support of 1668 based off the 162475 lows prior to making these new highs. The trend remains up as the rising wedge tightens. Short selling remains aggressive and going against the trend until the market loses the 162475 pivot low prior to the highs. Once these lows are taken out, the market sees next major support down to 1615, followed by 1553 from the June lows.  A breach of the June lows at 1553 is confirmation of this rising wedge being the top to give way to the Cyprus lows down to 1530. Going forward, 1688 comes in as first major resistance, followed by 1713.  The fact that the market gave back all of its "no taper" squeeze, shows wall street is losing credibility in the Fed as they appear to be "all in" with their QE programs. This is where new/fresh buyers need to step in to continue upside momentum.  The 2nd half of the year has established a bullish bias as it has closed above 1693 for 7 days. To reverse this bias, the market must see 7 day closes below 1613.75.


Tags:
Continue reading
2366 Hits

Nasdaq's Rising Wedge

1-8-12b_1.jpg

After running through 3050 in July, Nasdaq continued its run into August printing early highs of 3150 before falling back to 3050.  This led to a failed breakdown as the market found support at it's old resistance and turned the month of August into a consolidation month with a range of 3050-3150.  To start September, the pressure was put against the tops at 3150 which eventually gave, seeing the Nasdaq future trade up to 3213 today.  The gap open higher was above its rising wedge which led sellers to come into take profits and bring the futures back down to fill the gap from last friday.  This rising wedge should be taken with caution as the market presses the tops and the wedge tightens.  Going forward, 3150-3050 is new range for Nasdaq to hold to continue the upward momentum. To continue this range expansion of 3150-3050, this gives room up to 3250.  Line in the sand comes at the August lows just below 3050 as a break below this shows the market failed to hold the consolidaiton range and turns the breakout above 3150 as a failure. Major downside support seen within 2920-2870 with stops below the June 281775 low as a breach of this low sees a break of the 200day and a shift in trend momentum. Based off Monday's 3213 high, 3196 is a new level of resistance off these highs.


1-8-12b_1.jpg


Tags:
Continue reading
2484 Hits

Gold Breakout Looking for 1376 Above 1348

1-8-12b_1.jpg


Gold broke out of it's downward channel it has been in since meeting its 1348 resistance level late last month and squeezed through it's 200day moving average for the first time since November 2012 on the 8 hour chart above.  After completing 1255 downside objective from 1526 and even falling further to 1179, this setup oversold conditions which gave way for the short squeeze that saw the market recover back from 1179 into 1348.  This 1348 level is a major level of resistance based off the pivot high of 1376 that led into the flush to 1179.  After hitting 1348 last month the market consolidated and traded lower to shake out longs, putting in lows of 1271.8, to hold 1269.3.  This setup a small double bottom which gave way for a reversal last Friday back above 1300. The reversal late last week above 1300 put pressure against the 1320 pivot high prior to 1271.  Overnight the market took out 1320 to squeeze shorts which gave way to highs of 1343.7.  This is now retesting the 1348 level and putting pressure to squeeze through this to take shorts out and confirm the hold above 1300 to open the gates to the next major level at 1376 being the high that led into 1179.  By taking out 1376 the market recovers its fall from 1376-1179, confirming the "flush".  At this point should gold do this U turn, we look for the market to consolidate and build a base to develop support for continued retracement back to retesting the 2012 lows up to 1526.

Tags:
Continue reading
3445 Hits

Does Bernanke Leaving End the Bull Parade?

1-8-12b_1.jpg


In the aftermath of what was Bernanke's last testimony to congress, equity markets squeezed new highs for the year just as the testimony wrapped up. Most congressmen were applauding the chairman for his service, somewhat having the feeling of a farewell party. The question is, if the chairman is leaving, does this mean the QE party is over and who will be last to turn off the lights? The uncertainty of the next chairman and actions is unknown. It's been quite a ride for the year, opening above 1440, last year's resistance, and seeing a gap and go breakout. Moving through all resistance and squeeze shorts in the process. This took 5 waves in the first half of the year, with 2 being minor corrective waves as tops failed.. Shorts squeezed and investors piling in, forced into equities on a QE high. This saw record highs of 168575 last May before longs began to sell into the squeezed bid to take profits. Bernanke scared investors out on June 19th with worries of tapering QE, seeing the market reverse lower from 1649.  This started a shakedown and panic into testing major support based off 1530 which originally began the leg up through 1600. The bull strongly defended this test holding in the low 1550s to prevent the reversal in trend. The market was walked back up to the 1649 level just in time to give Bernanke a second chance on another FOMC release of July 10th, and creating a "V" bottom. Bernanke was able to calm the market enough to break through 1649, triggering a short squeeze to give way to take out the all time high from May.  The latest and "last" testimony to Congress from the Fed chairmen had the market sitting on all time highs.

The SP500 followed the Transports lower Wednesday after failing to take out 3 day highs and setting up a small flat top.  The bounce to test the highs was seen as Apple earnings led the stock to jump $20 higher, luring in buyers to the SP500 for a run through 1700, only to reverse lower and close below 3 day lows. The reversal has the market pressing against major support, within 1681-1665, based off last week's pivot higher.  Failure to hold this range sees weakness in buyers and a reversal on the daily chart.  This creates the potential for a double top with the market failing to attract new buyers after taking out the May highs.  New money at these levels have new risk of uncertainty of the next Fed chairman. Next support seen at 1650, followed by 1615 with sell stops below 1550. Breach of 1550 targets 1530 Cyprus lows and the pivot that led into these all time highs. Minor upside resistance 1688-1696, break through needed for buy side to continue momentum.


Continue reading
2675 Hits

Accurately Predicting Gold Trends Using Technical Analysis

GC5_8_9.jpg

(click chart to enlarge)

Gold in 2008 was the first time the market breached the $1000 mark, hitting highs of 1033.9 in March just as the Federal Reserve Bank of New York provided an emergency loan to Bear Stearns to keep the company solvent from it's bets in subprime mortgages.  This was followed by a correction and liquidation in the fall just as the equity markets began to crash in September.  The panic and liquidation selling led gold to fall into lows of 681 in October before retreating back to retest the $1000 mark in February of 2009.  This created an Elliot Wave pattern that saw the first wave 651-1033, second wave being the corrective wave from 1033-681, third wave being the move back up from 681-1007, fourth wave which was a very small 38.2% correction of the 3rd wave, setting up for the fifth wave to try and continue higher.


GCTRADE1-2.jpg

(click chart to enlarge)

The fifth wave completed with gold moving from 865-1227.5 just as the Federal Reserve bank lowered their federal funds target rate to 0% in January of 2009.  This gave gold the fuel to move back through $1000 and continue this 5th buying wave to take out the old $1033.9 highs.  Showing gold's strength and proving naysayers who did not see gold breaching over $1000 again wrong.  As the 5th wave completed with highs of 1227.5, this led to profit taking and a small correction as gold corrected 50% of the 865-1227.5 move as well as coming back to retest the old 1033.9 highs with the gold making a low of 1044.5 in February of 2010. 


Continue reading
4970 Hits

What to do with Gold.

GC________Weekly___Week_23_2007___Week_27_2013.jpg

Back in December of 2012 on the 12th, the FOMC released their statement that “… the Committee decided to keep the target range for the federal funds rate at 0 to 1/4 percent and currently anticipates that this exceptionally low range for the federal funds rate will be appropriate at least as long as the unemployment rate remains above 6-1/2 percent…”.  This was the first time since having rates at 0% the committee attached an unemployment rate “target”.  Since this statement, gold made a high of 1725 on that day, and never looked back.  It has been straight down since then. But this was not the beginning of selling in gold.  This was just a catalyst for long term holders to take profits. As we pointed out back in December “What’s With Gold? FOMC Spooks Market, Double Top Eyes 1250.”   Again this was not the beginning of selling.  Gold had a target of just above 1900 when it created a “diamond” pattern in August of 2011.  This was a continuation of the parabolic stage the market went in after the debt deal passed earlier that month.  Sure enough gold squeezed through 1900 into 1923.7 and reversed down into lows of 1535.  This was a major shakedown in the market place and left a lot of late buyers holding the back at parabolic prices above 1700.  Throughout 2012, the year was one major consolidation period.  After an early high of 1792.7 in March, the market pulled down to put in lows of 1526.7 in May. Not ready to breakdown, the market squeezed shorts and rallied back to take out the March high and print new highs for the year at 1798.1.  These new highs for the year once again failed to push past 1800 and the failure turned into a double top attempt.  Since this 1798 high, gold has been in profit taking and selling.  When the FOMC released their statement in December, this just gave excuse to continue the profit taking and move lower.  To start 2013, gold attempted to rally, only to put in highs of 1697.8 and roll over.  The reversal in January of 2013 to break the year low of 1626, continued the selling pressure, targeting the 2012 low of 1526.7.  With the 2012 low of 1526.7 being taken out in April, this confirmed the 2012 highs against 1800 as a double top.  By taking the range of 1526.7-1798.1 or 271.4, this gave a downside target of 1255.3. 


Most recently, we have seen gold complete this downside target of expanding the 2012 range down to 1255.3.  Of course the market did not stop there and went into further selling as longs panicked and stops continued to be shaken.  This led the market to fall below 1200 into lows of 1179.4, almost retracing 61.8% at 1155 of the 681 to 1923 move.  The breakdown below 1200 after completing 1255 put the market into extremely oversold levels.  The bear in gold is not new, this bear has been around since that 2012 double top, and the trend down since that high has been a $618 decline in prices from 1798.1-1179.4.  Short term gold is oversold, thus the bounce being attempted.  Gold below 1250 gives investors who patiently waited for prices to turn lower an opportunity to come in and pick up some physical and or invest long term at a 50% discount.  Gold remains in major downside pressure until it can close above 1300.  Doing so can give way to squeeze late shorts and attempt to retrace the market back to the 2012 low of where the market failed at 1526.  This old support should then act as new major resistance, however gives an upside target for buyers sub 1250 to target.  Bottom line: As we were bearish gold in 2012, we are now cautiously bullish and like putting some powder to work.  Failure to hold 1150 sees next major support at 1126-1045. Regardless, gold was trading 1900 just a few years ago, at 1250, this is a steal. Yes we can move lower, but it will only allow more opportunity to buy at lower prices, and NOT at parabolic prices.


“Buy weakness, sell strength’


Tags:
Continue reading
4126 Hits

SP500 FOMC Headfake = 157075, 153075.

ES________Daily___9_28_2012___6_20_2013.jpg

The SP500 fell down into a major trend line on Thursday based off support from the year lows.  This comes after the market originally broke out in May above 1593 to start the “5th wave” of the year from 1530.75-1685.75.  The highs at 1685.75 completed a 100% fib extension and since touching this level, sell programs from longs have been taking profits into rallies.  We saw the market fall down below 1600 in June twice. Both seeing a sharp reversal as the market squeezed shorts selling lows.  The last reversal on the 13th was much more violent.  It led the market to take out its 164850 high from June 10th by .50 as the market put in highs of 164900.  This turned into a failed breakout as sellers who stopped selling awaiting the FOMC statement, returned following the release.  They resumed taking profits in the market as the Fed continues to outline its strategy for exiting.  Why wait until the last minute when they are already hinting they want to slow down purchases? This is the case, especially after running up from 1438 this year and into 1685, 17%.  The resumption of profit taking post FOMC caught many off guard as it created that head fake above 1630, leaving shorts on the sidelines and buyers forced to exit the failed breakout. This is what has led to the fast chase into 1577 seen Thursday, just one week following the major reversal off 159175 and into 163350.  Going forward, this breakdown has caught many off guard and many are still not short the market.  This means the downside pressure continues to not allow shorts in and continue to press against next major support levels.  As the market retraces into this old 1593-157075 support range that led to the breakout in May, sell stops are seen below this range under 157075, being the lows late April that developed the support to breakout higher.  Breach of these stops takes the market to test its 100day moving average on the daily chart with next major sell stops being under 153075 as the pivot low in April that led to the 5th wave higher.  Once this low is taken out, then the market confirms the 5th wave is completed and that the move above 1593 is a potential for a failure.  This is the level (1530) one can look for support and to defend the market for a retest back to the 1593-1600 level to see if the market can regain above the level or turn support into resistance to start an abc corrective pattern following the 5 Elliot waves of the first half of the year.  New upside resistance now comes in within 1600-1610, followed by 1620, 1630, and finally 1640.  Move above 1649 is needed to derail the downside momentum and look for a retest of the highs.  Once 153075 fails, we are looking for a bounce into 1600 to create a right shoulder for a head/shoulder topping pattern. This 1530-1685 is a 155 point range which gives room to the downside at 1375.  However first thing is to fill the gap that started 2013 at 1420, followed by the 1375 support level. Thereafter, the market still has a gap from 2012 at 125250 that has yet to be filled. 


ES________Weekly___Week_32_2007___Week_25_2013.jpg


Tags:
Continue reading
1924 Hits

SP500 Johnny 5 Update

Who is Johnny 5?

Latest wave in SP500 1530.75-1685.75:

(click chart to enlarge)ES________480_Min___5_28_2013.jpg

SP500 8 hour chart above showing year to date trade.

First 6 months of 2013 = 5 waves:

Wave 1: 1438.25-1530.00 +91.75 6.4%

Wave 2: 1530.00-1481.75 -48.25 3.1%

Wave 3: 1481.75-1593.00 +111.25 7.5%  AVG VOLUME 9,436,701 

Wave 4: 1593.00-1530.75 -62.25 3.9%

Wave 5: 1530.75- *1685.75* +155 10.1% AVG VOLUME 9,344,753


Since blowing through 1593, the chase trade by buyers and short squeeze pushed the market to complete its 62.25 range (1593-1530.75) up to 1656.  This did not stop with the SP500 pushing through this, 1666, and into the top level of 1685.50 to extend the range 100%.  As shorts capitulated through 1673 into 1685, bulls used the bid to take profits into.  This led to a 3% decline down to 1632.75, shaking out the first 1646 level of sell stops.  The move was fast after the bear capitulation as sellers had to now chase.  With market falling into 1630s, bears chasing lows have been grinded out as market has used these bears to run stops above 1655 and into testing the 1670 level being where the SP failed off the high. The move has given more patient bears there chance to get in, now its up to see if they are stronger then this bull.  The bull has support at 1654 and sell stops below 1644.  Sell side gains ground with break of 1644 to retarget the 1632.75 low to confirm move above 1655 was failure.  Buy side needs to hold 1655 to continue pressure to retest 1672.75 from today's failed high.

Below is an excerpt of the 5th wave description in "Wikipedia"

"Wave 5: Wave five is the final leg in the direction of the dominant trend. The news is almost universally positive and everyone is bullish. Unfortunately, this is when many average investors finally buy in, right before the top. Volume is often lower in wave five than in wave three, and many momentum indicators start to show divergences (prices reach a new high but the indicators do not reach a new peak). At the end of a major bull market, bears may very well be ridiculed" (Source: Wikipedia - Elliot Wave Principle)

Ofcourse, this looks exactly like text book, wave 5 everyone is bullish, average investors forced to chase above 1593, and volume thus far has been lower then the 3rd wave. The 5th wave momentum continues until the pivot low of 1530.75 is taken out to confirm move above 1593 was a failure.

Same chart above, zoomed into last wave 1530.75-1685.75 (click chart to enlarge):

ES________480_Min___5_28_2013a.jpg

Continue reading
5081 Hits

Euro and the 200day


6E________Daily___5_24_2012___5_28_2013.jpg

The Euro has closed below its 200day moving average 9 days now since breaking below in May.  This comes after an initial attempt to break the average in April was followed by a reversal off new year lows of 12751 that closed the market above the 200day.  This turned the break of this average premature and caught shorts below trapped as the market ran into 13200 to run stops from March.  Since then, the Euro topped on the 1st trading day of May at 13248, as the 200day moving average slowly caught up to make a tight range.  With the failure to hold the pivot low of 12959 from April 24th, the Euro broke its 200day moving average, and this time around the market is getting comfortable under this level by slowly turning the average which is strong support, into new resistance.  This was seen last week as the market spiked up to 130, touching the bottom of the 200day, however failing.  This consolidation pattern has created a bear flag as a tug of war is taking place by turning the 200day average into resistance, and working to gather strength to break the April lows.  With this, the 50 day moving average has also began to cross the 200day average, also known as a "death cross".  Breach of April lows confirms the bear in the Euro which should continue to find its 200day average weigh down to attempt a retrace into 124 which is where the market broke out last year.  12906-13000 offers new area of resistance for this momentum, followed by 13075-13200.


6E________Weekly___Week_33_2011___Week_22_2013.jpg

The weekly Euro chart shows a different picture. With last week's attempt at the 200day on the daily chart with highs of 130, shows the market held below its prior weekly high and closed below the prior weekly open, to establish an "inside" week.  This has led to continued weakness as this week has began, in attempt for sellers to target last week's low of 12822.  Closing below this low on the weekly confirms downside to target the rising trend line for stops and eventually the November lows at 12665.

Continue reading
3568 Hits

SP500 Maxes 100% Fib and Reverses

ES________480_Min___5_23_2013.jpg

As soon as the SP500 hit its 100% Fib extension level of 1685.50, sell programs kicked in as the SP500 printed highs of 1685.75.  The move occurred after a squeeze through previous highs of 1673, seeing shorts capitulate which gave way to the 1685 print.  Smart longs sold into this bid to take profits. With longs taking profits, shorts already being stopped, the market fell down to retest its open. After trying to retest the highs and failing to find buyers at 1681, the market fell off to take out its session lows to reverse the intraday trend as more longs locked in profits and short sellers sat on the sidelines looking at the market drift lower.  With shorts out the market, this created a chase to the downside into 164650 to retest the pivot low of 1646 made last Thursday prior to Friday's move into 1665.75. A 40 point rejection off the top level of 1685 and a press to test the downside resistance range at 1656 to see if that old resistance acts as new support for a retest of the mid level at 1666-1670.  This has raised the stakes for bears as the range to defend has widened.  Failure to hold 1646 sees more shorts left on the sidelines and a wider range (40) to defend the high.  Market remains in its 5th wave that began on the breach of the old 1593 highs with a pivot low of 1530.75 occurring during the "4th" corrective wave.  As market moved past 1593, buy side chased and shorts squeezed from the 1593-1530 giving way into 1656.  Sell stops have built along this wave 1530-1685 below 1646, 1620, 1607, 1570.75, and ultimately the 1529.50 low from Cyprus.  Wave 5 ends on a breach of that pivot low that began the wave at 1530.75.  With that taking place, a confirmation will then be made that the move above 1593 was a failure and an "abc" corrective pattern can be seen should the market be able to bounce after breaking 1530 to retest the 1600 level and see if it can get back above. 

ES________Daily___12_21_2012___5_23_2013.jpg

See: "SP500 Wave 5 How High Will It Go"


Continue reading
3650 Hits

Volatility Index 13 Level


Tags:
VIX
Continue reading
3219 Hits

SP500 Wave 5 How High Will It Go

ES________480_Min___5_15_2013.jpg

Click to enlarge

The latest breakout above the previous high of 1593 is extending to be the 5th wave of the 2013 breakout above 1440.  As seen in the charts, the market has had 5 waves this year.  The first wave starting from the year lows of 1438.25 to the February high of 1530 rising 6.4%. The corrective wave off these highs retraced 52.6% to 1481.75 before stabilizing.  The breakout above the previous high of 1530 began the third wave up as the market rose 7.5% into 1593 in April before correcting.  The corrective wave off these highs retraced 56% to 1530.75 before once again stabilizing.  The latest squeeze through 1593 has become the new wave up, being the 5th wave of the bullish trend.  The 5th wave is usually the strongest out of the 1,3 ,5 buy waves as it attempts the final squeeze and extension of the trend, luring in the late buyers.  This happens as the market never pulled back to retest the April lows allowing for buyers to defend 1550s, and forcing a chase above 1600.  The chase thus far has been strong, with the market extending 76.4% above 1593 at 1648.75, and up 7.7% from the 1530.75 low, already a larger % move then the 1st and 3rd buy waves. Major resistance is being met at these levels. The range of 1593-1530.75 (62.25) completes at 1655.25 to be a +8.1% (1593+62.25). Next level comes in at 1666 to mark 1k points off the lows and 8.8% move from 1530.75, followed by 1685.50 as the 100% fib extension and 10.1% off the 1530.75 low.  As this latest wave pushes higher, bulls are most present and bears are ridiculed. Major upside targets are being thrown out, pumping the market.  As per the Elliot wave, once the 5th wave completes by seeing a correction off the highs, an a,b,c corrective pattern can be attempted. This can turn into a consolidation to build a base or a head/shoulder pattern as A is the wave off the high, B the wave to retest the high, and C the wave that fails the retest and falls to take out previous low from A which is needed to confirm change in trend.

Wave 1: 1438.25-1530.00 +91.75 6.4%

Wave 2: 1530.00-1481.75 -48.25 3.1%

Wave 3: 1481.75-1593.00 +111.25 7.5%

Wave 4: 1593.00-1530.75 -62.25 3.9%

Wave 5: 1530.75- *1685.75* +155 10.1%

Wave 5 ends when market turns back to take out the pivot low of 153075 that began the chase through 1593.

Sell stops are loaded up on the downside as the market built bases into the upside squeezes. These come in below 1620, 1607, 157075, 152950.

Continue reading
5516 Hits

FLASH BACK on the FLASH CRASH

Going into May 6th, 2010, the SP500 was already having trouble on a daily basis, distributing within 1180-1220. After originally making a high of 1210.50 on April 15th, the market fell down to 1179.75 before recovering to take out the 1210.50 high and stop out early shorts.  This higher high up to 1216.75 failed to hold, seeing the market reverse to take out the previous 1179.75 low.  Lows of 1176.75 before another bounce was seen to retest the failed higher high at 1216.75.  The retest turned into a right shoulder as the market failed to push through the April 26th highs and fell through the previous low of 1176.75 to confirm a head/shoulder pattern.  Going into May 6th, the market had already broken below 1176.75 and had a target of 1136.75.


DRUDGE05_06_10.jpg 

SP5_6a.jpg

On the day of May 6th, 2010, the market was well below its 1176.75 neckline, opening at 1157.50 and making highs of 1165.00.  Pictures and videos of Greece riots being shown  added fuel to the fire. Things quickly deteriorated after the market fell below 1154 and turned the level into resistance.  This led to the head/shoulder target of 1136.75 to be completed.  With this target completing, this is when the flash crash flushed the market from 1130 down to 1056 before recovering back to the 1130 level into the close.

DRUDGE05_06_10A.jpg


Eventually, the market retraced back to its broken neckline of 1176.75 by making highs of 1174.75 before turning back lower to "back and fill" the flash crash lows of 1056.  Lows of 1002.75 were made in July of 2010 before reversing off the lows and into 1127.75, being were the market failed the prior month in June.  With the markets back to whipping back and forth in attempt to consolidate and build a bottom, a retest of the 1002.75 lows was made with the market falling down to 1037.00 on August 25th just before Ben Bernanke's Jackson hole meeting.  During this meeting "Bernanke Says Fed Will Do `All It Can' to Ensure U.S. Recovery".  With the Federal Reserve promising to defend the markets, this turned the retest of the summer lows into a bottom and the markets turned higher to see a breakout "gap and go" on September 13th with the market making lows of 1108 and holding above the prior day's high close of 1105 to leave a small gap open, giving way for a short squeeze to move back higher and take out the earlier April high of 1216.75 which eventually led to 1373.50 on May 2nd, 2011 before going through another consolidation period that presented another correction, filling the 1105 gap. Another volatile period and more promises of support from the Fed led to another gap and go breakout to start 2012 with a gap open higher with lows of 1259.75, keeping open a gap down to 1252.50 from December 30th and giving way for another short squeeze to move back higher and take out the May high of 1373.50. Throughout 2012, the market kept this gap at 1252.50 open to create another bottom during summer, targeting the year highs.  Small correction in fall of 2012 as the 1441 upside target was completed, making highs of 1468 before falling down to 1340.25 in November to retest where the market broke out in August.  Since these lows, another gap has been made, with 2013 opening above 1440 with lows of 1438.25 and a previous close of 1420.  This has led us to where we are now as the market has gone through another major short squeeze, bubbling throughout the year to take out the all time highs of 1586.75 and breaking above 1600 on the latest non farm payroll number reported on May 3rd.  


Continue reading
5072 Hits

Gold Monthly Outlook

GC________Monthly___8_2006___5_2013.jpg


When the FOMC came out with a 6.5% unemployment target, this put gold on the edge fearing higher rates.  This was enough to hold the 2012 double top after consolidating the 1600-1900 parabolic move with lows of 1526.7 and break below 1700 into 2013 to make this a new level of resistance.  January this year gold tried to rally only to fail at 1697.8 and break below the year lows of 1626 giving way toward the 2012 low of 1526.7. With the market falling below the 2012 low, this squeezed the 1526.7-1798.1 range, retracing the market near 50% of its 681-1923.7 move. Since hitting 1321.5 gold has reversed back above 1400 and quietly trying to fill back the breakdown.  The old lows of 1526.7 as the bottom of the 2012 range will provide a major area of resistance.  For the gold bull to take control after this 50% correction, a 7 day hold above 1700 reverses downside momentum and targets all time highs for resumption of the bull trend. Below 1526.7 will continue to give pressure lower as late buyers in gold during the parabolic move of 1600-1900 are caught holding higher prices.


unemp5_3.jpg


Continue reading
2688 Hits

Yen and Dow Seasonal Since 2007

YEN6J________Weekly___Week_42_2007___Week_18_2013b.jpg


DOWYM________Weekly___Week_40_2004___Week_18_2013b.jpg

Continue reading
2854 Hits

Japanese May Flowers = Equity May Showers

6J________Daily___9_21_2012___5_2_2013.jpg

Yen is trying to round out a bottom. After retesting lows and not breaking, the Yen is back to retesting where it failed from April 15th with highs of 10383. This has led to a pause in the market as it consolidates builds support to continue the pressure against this level.  Support is seen down to 10150 ever since the market squeezed the level and turned on the short squeeze. Squeezing above 10383 confirms double bottom and gives room to target 10883 from where the market failed early April as the Bank of Japan came out with stimulus, derailing the March bottom attempt. By coming back to this level the yen will have rounded out a bottom from 108-100-108, leaving shorts who sold the BOJ stimulus wrong. This will turn the level into support as the market will also retrace 50% of the year highs 11531-10008. Recovery above 108 will attract buyers to press the gas against shorts to target year highs of 11531 and fill gap up to 118 from November. 

During the past 4 years the Yen has had a tendency to bottom during the Spring months. 


Equities were squeezed to new highs on the last day of trading in April as equity shorts threw in the towel.  This led the Emini SP500 to take out the previous high of 1593 and put in new highs of 159550. Nasdaq completed the squeeze of taking out last year's highs of 287175.  To start May, equities reversed sharply off the highs to close below Tuesday's lows.  These lows now act as major resistance and what buyers need to overcome to retest highs. On the ES daily chart, the breakdown setup an outside bar bearish reversal, by opening above previous day making a higher high and closing below previous day's lows. The breakdown was fast and sharp as shorts had already thrown in the towel the day before, so they were left behind, having to come back and offer the market down as they chased back in. This gives way for the SP500 to test support down to the mid 1550s of where the market broke out after putting in a 153075 low in April as sellers failed to break the Cyprus 152950 low.  Shorts have already been cleaned after failing this breakdown and ralling to take out the highs and squeezing them out.  Coming into this range of support allows buyers opportunity to defend and continue the upside momentum.  Failure to hold and breach of 153075 confirms a double top with room to target the year lows.  Once the SP500 takes out the year lows, prices above 1440 will not be visited for a long time. A Yen short squeeze will put pressure to make this break take place.

On Wall Street, the old saying is the markets like to climb the wall of worry, and they have surely done so this year moving higher in the face of all negativity along with two attempted breakdowns in February and April. These are what we call "cracks". We like to say the market climbs higher on glass stairs. Reason being is ever since the 08 crash and 09 bottom at 665.75, the market has been VERY fragile and on life support through the Fed.  As we have seen, the glass stairs have been broken several times since the ride from the 09 lows and each started with cracks first before falling through violently, flash crash and debt downgrade in 2011.  The recent February and April corrections were the first cracks in this latest climb of glass stairs.


The Ultimate Short Squeeze 665-1441 & Accurately Predicting Every Correction Using Technical Analysis


ES________Daily___6_14_2012___5_2_2013.jpg

Continue reading
1224 Hits

Bonds, Stocks, and the YEN


ZB________Daily___3_13_2012___4_28_2013.jpg

The 30 year bond has consolidated above 14617 in an effort to hold above the year highs after seeing a massive short squeeze that reversed the market from the year lows of 14014. Squeeze was fueled by shorts as the market broke below the February lows on the March NFP release to put in these lows, the market saw a recovery the following Friday going into the "Cyprus bailout".  Cyprus news led to gap above 14200 turning level into a failed breakdown as market continued to force shorts to cover until the year high was taken out. The move caught many off guard and in turn cleared out shorts in the market. By holding above 14617 the market now tries to build a base of support to attract buyers that neglected bonds for stocks earlier in the year.  The market sees major resistance against 14923. Taking the range of 14617-14014, gives way to push toward 15221 high from November.  Just as the Yen tries to target its November gap.   


  6J________Daily___8_28_2012___4_28_2013.jpg


Yen and SP500 show almost exact contrast comparison.  As Yen tries to double bottom in April, SP500 is trying to double top.  The Yen made lows of 10008 and 10013 before squeezing through 10158 last week.  This level has turned into a new area of support should the double bottom be good. Holding above 10150 gives room to force shorts to cover to give room to take out April 15th's 10383 high with next major level of stops above 10809 from April 2nd highs. Above 10809 confirms double bottom against 100 to give way for a massive short squeeze to target the year highs at 11531 and give room to fill last November's gap at 11790. During the past 4 years the Yen has had a tendency to bottom during the Spring months. 


ES________Daily___6_18_2012___4_28_2013.jpg

In contrast the SP500 has a small double top as market most recent reversed from 153075 to retest 1593 by making a high of 158825.  As the market hits it's head against this resistance it has managed to hold above 1570 to create a very tight trading range. Move past 1588 is needed to retarget 1593 for stops.  Break of 1570 gives way to test support at 1555 based from the 153075 pivot low.  Taking out this low would confirm the double top to give way to cross the "line in the sand" from the Cyprus lows of 152950 which have held like a rock.  This is line in the sand, just as 108 is the line in the sand in the Yen and 14617 was in bonds.  In contrast to the Yen with the gap at 11790, the SP500 has a gap down to 142575. 

Continue reading
3383 Hits

April Showers Bring Yen Flowers?

6J________Monthly___11_1997___4_2013B.jpg


6J________Weekly___Week_48_2006___Week_17_2013a.jpg

The Yen's failure to take out 13264 in 2012 and build of a right shoulder at 12967 that led to the neckline of 11879 to be broken, has now surpassed it's head/shoulder target of 10494 as the market broke below the May 08 lows during the "flash crash".  The break below this has seen the Yen's breakdown extend into a 61.8% retracement of the 2007-2011 move from .008123-.013264.  This has cretaed a period of consolidation as the market now fights to hold this .0100 level.  As we see on the weekly chart, RSI extremely oversold and volume extremely higher.


6J________Daily___1_18_2012___4_23_2013a.jpg

Looking at the daily chart, since the beginning of the year with the Yen breaking down, the RSI conversely has moved higher. All this on extremely high volume. This divergence gives way for the idea a bottom may be taking place and a massive short squeeze can be coming. So we will look at the numbers. First we remain in a major downward channel since the right shoulder was made up at .012967. As the Yen failed to hold onto March's lows at .010340, this led to a drop into the 100 level with lows of .010008. The market bounced off this level right into retesting the March lows which have turned into resistance.  This has led to another retest of the .010008 lows as the market fell into .010013 this week. Pressure is being placed to retest these lows and see if the market can flush below to attract new sellers and shake out new buyers of these levels.  Major resistance is now within the .010150 up to the .010383 April high that failed at the March lows.  Squeeze through this is needed to spark the short suqeeze and give way to test upside retracement levels based on the year high of .011522 with a 50% retracement coming in at .010765 level.  Should a short squeeze trigger into the 50% level, at this point a move through the year highs would give way to fill the gap from last year at .011804 from December 24th.  Failure to hold onto the .0100 level gives way to pressure against .009867 from April of 2009 with next major support coming in at .009231. Since that low of .009867 in April of 2009, every major low has been made in April or within a month apart. The question will be if the .0100 level is held before a squeeze or a flush followed by a reversal. 


Tags:
Continue reading
4357 Hits

SP500's Struggle and Failure

ES________Daily___11_6_2012___4_18_2013.jpg


The market fought gruesomely in squeezing out shorts as sellers were attracted following the Cyprus breakdown. This led to a major tug of war, making higher lows and higher highs until 1568 printed and the market reversed into the April NFP report to shake out the series of higher lows test 152950 and hold. Once again luring in shorts thinking the 1568 was the top, only to see a massive short suqeeze taking the market through the old 1568 high to stop early shorts and print new highs of 1593 as the all time highs of 158675 were taken out. 

Since taking out all time highs, the market fell back to retest where it broke out above at 1568. Old resistance failed to hold as new support as the market fell below 1568 which saw next level of support tested at 1555 from the April 5th NFP highs.  The market attempted to stabalize this level, however with the Boston tragedy, selling pressure drove through this down to retest the NFP low of 153325 as the market held at 153875.  This hold led to a bounce back on Tuesday, resetting the market as it came back to the 1568 level to allow sellers a bounce to defend and buyers another oppurtunity against the highs. Buy side failed to materialize and hold 1568 which in turn has seen sellers take control to reverse the market back below Monday's 153875 low.  In turn the bounce to retest 1593 has turned into a right shoulder of a head/shoulder topping pattern.  The neckline was broken on Wednesday as the market took out Monday's lows of 153875, giving 1568 shorts their first target.  At this point buyers are forced to defend last week's lows of 154300.  Closing below this for the week triggers sell signals going into next to continue the move lower. Closing below the daily neckline of 153875 gives room to expand the range of 54.25 (159300-153875) down to 1484.5 which would be a retest of the February lows at 148175. The Cyprus low remains the line in the sand which was a retest of the old February highs, falling below gives room to target February's lows with next major support within 1465-1450.

Continue reading
3570 Hits