Chicagostock Trading

Chicagostock Trading

Cash Market Games

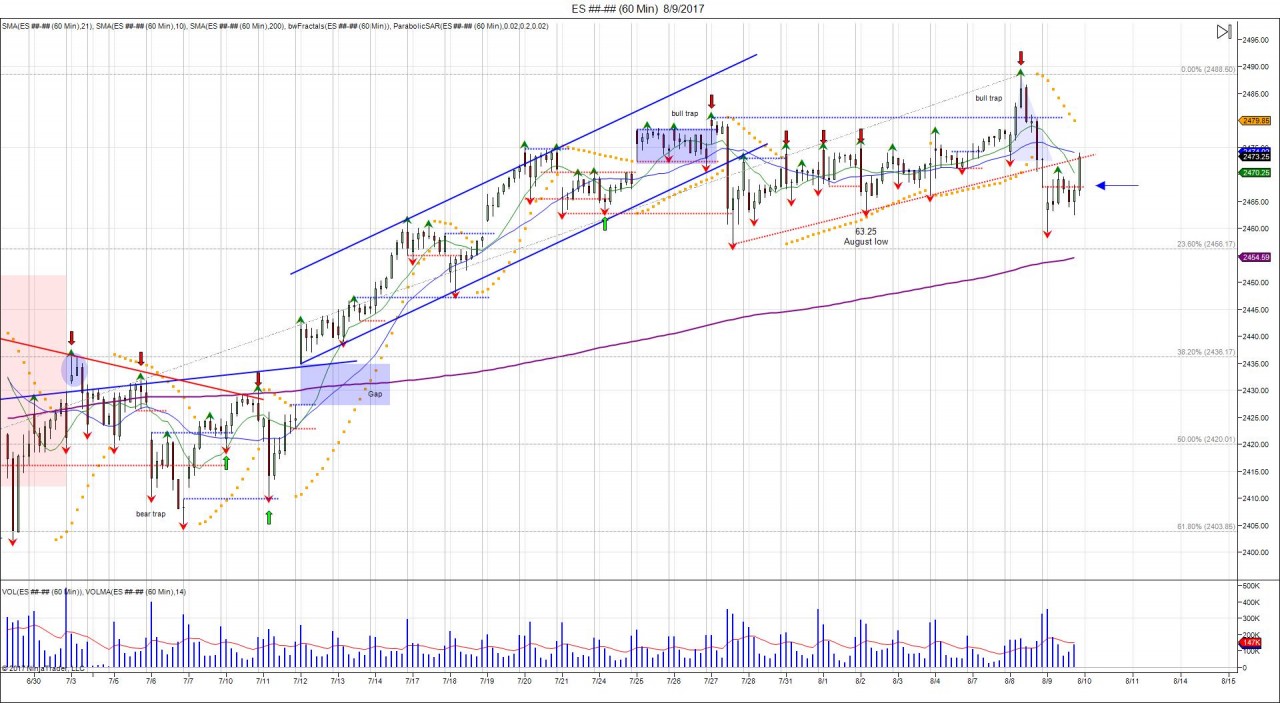
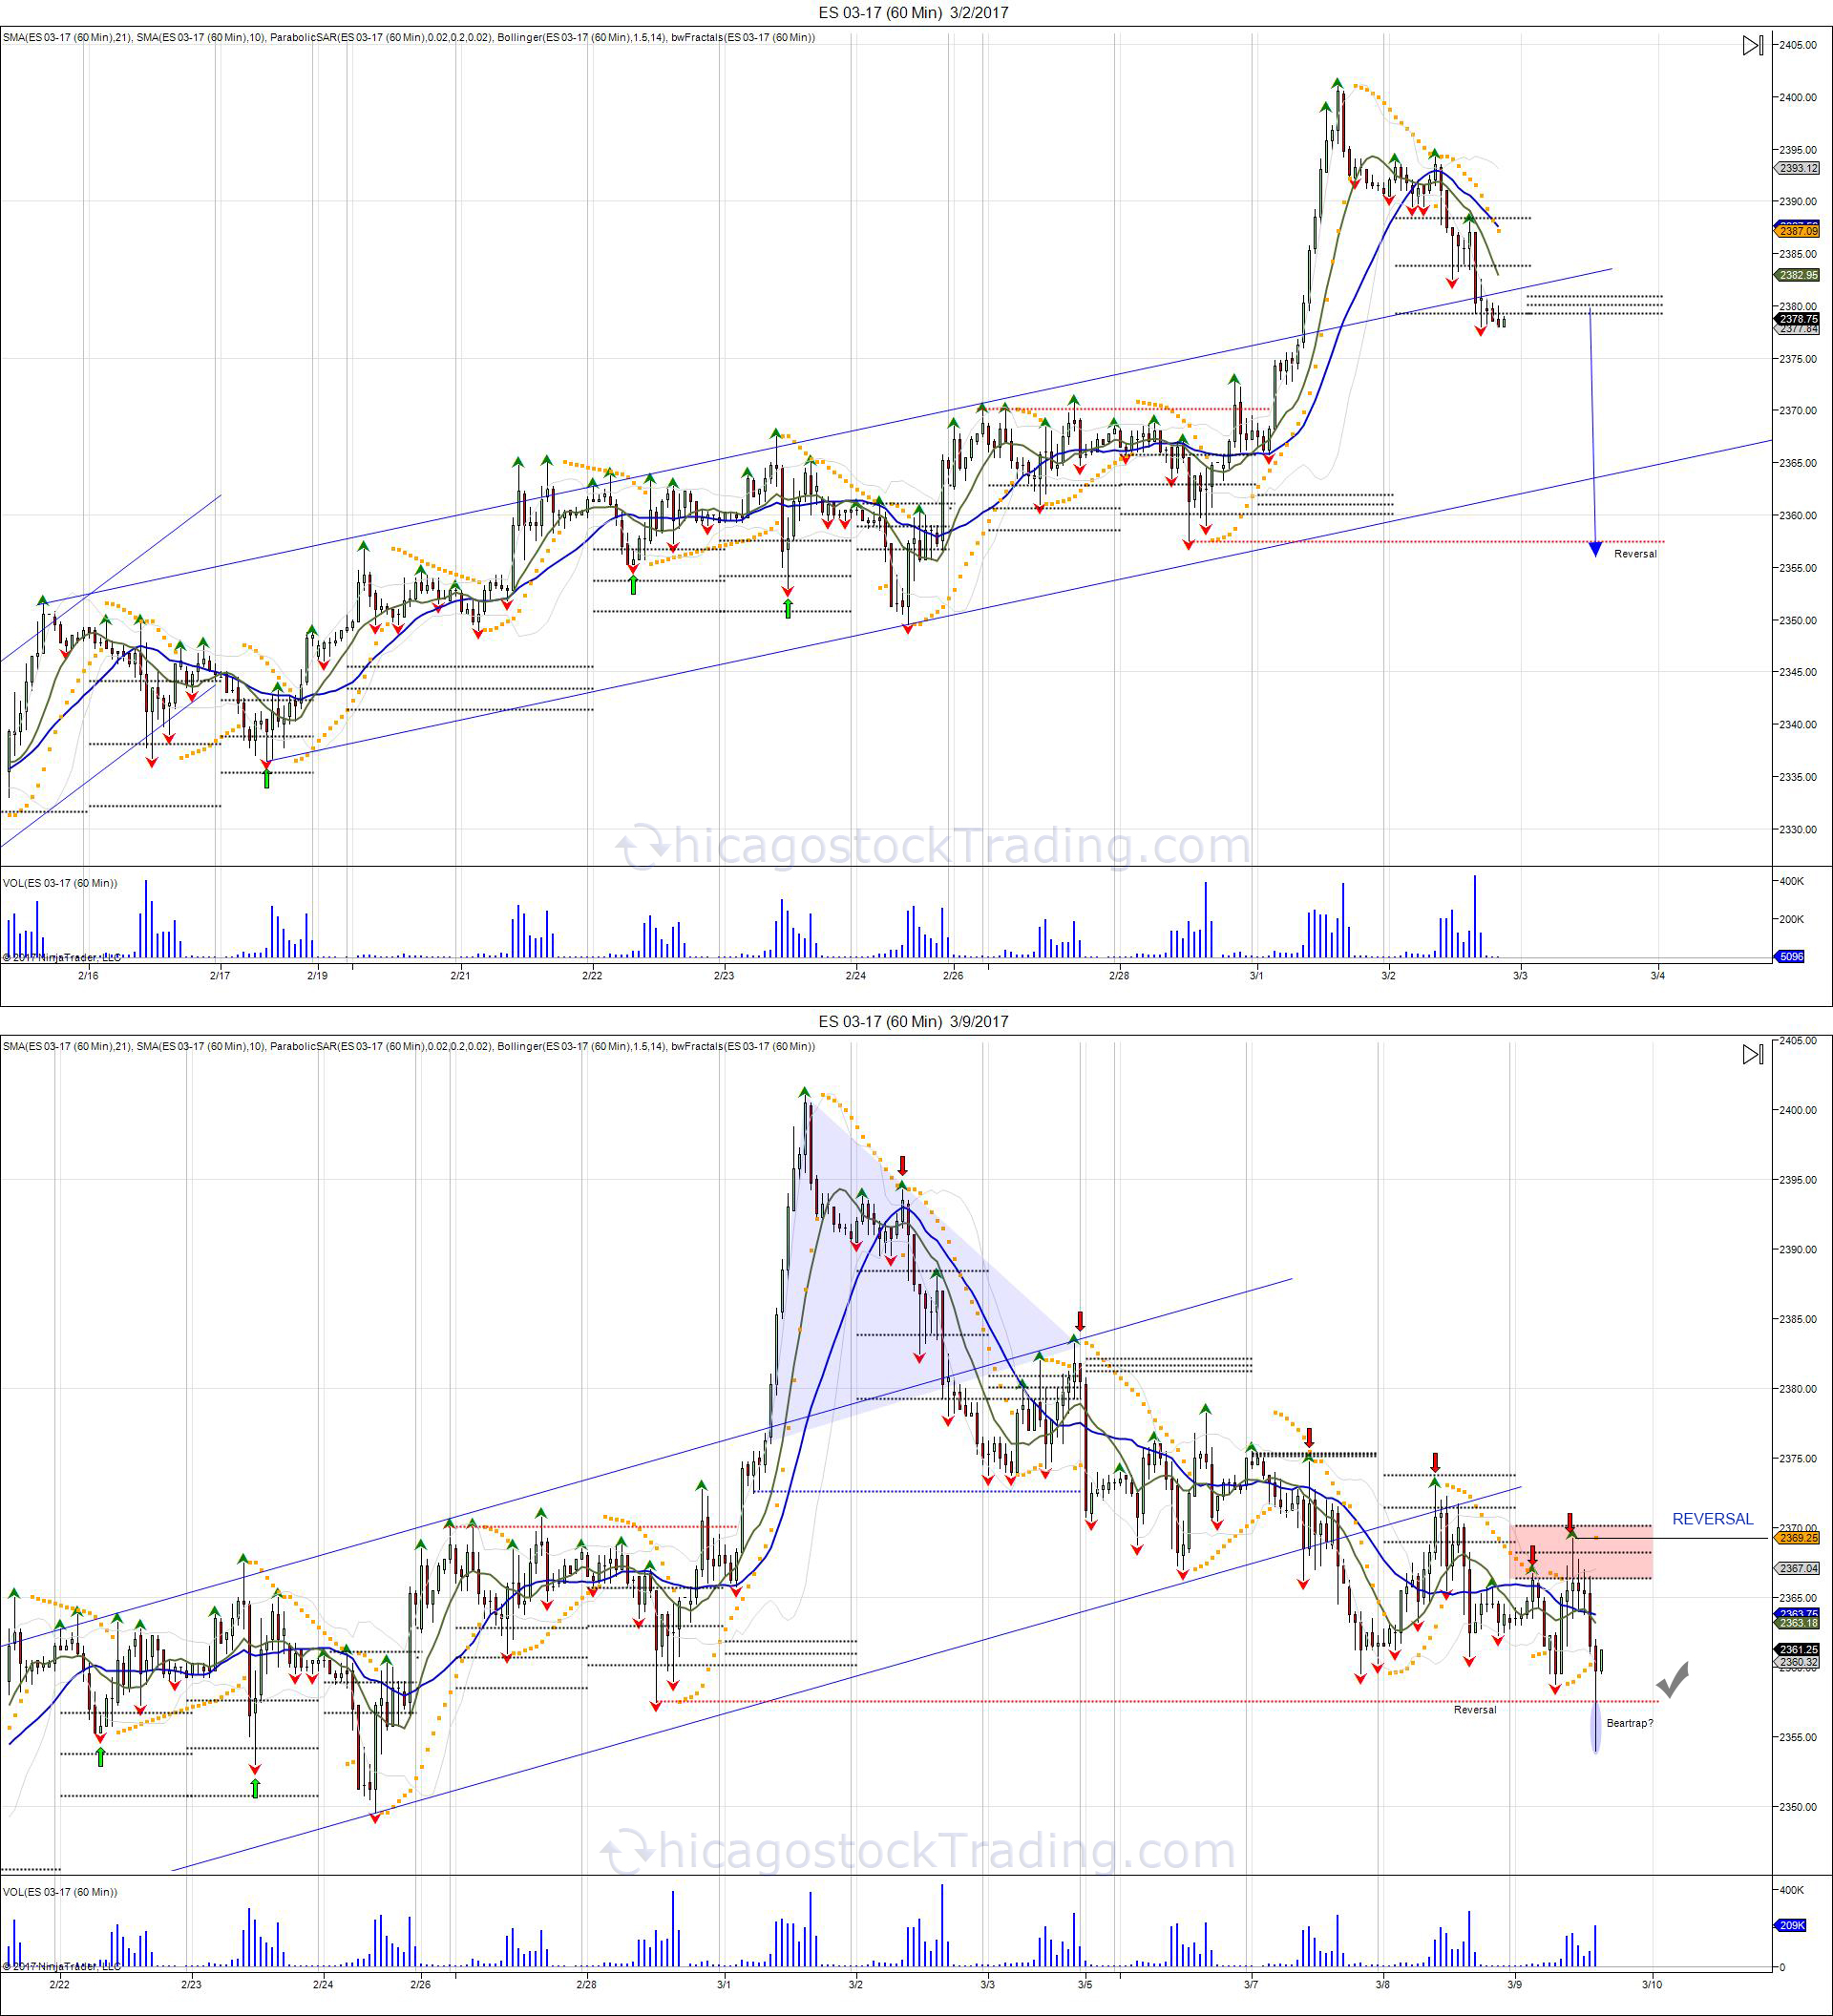
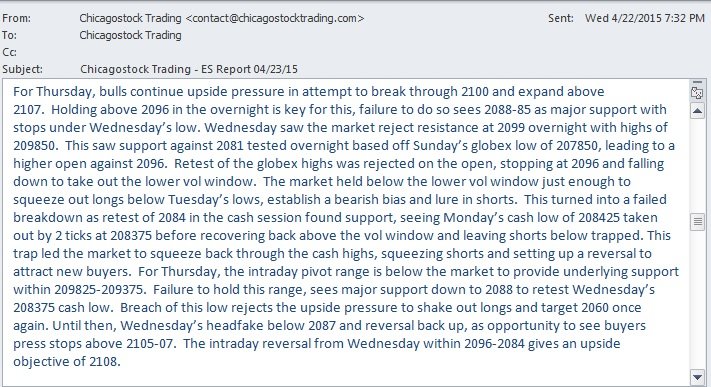
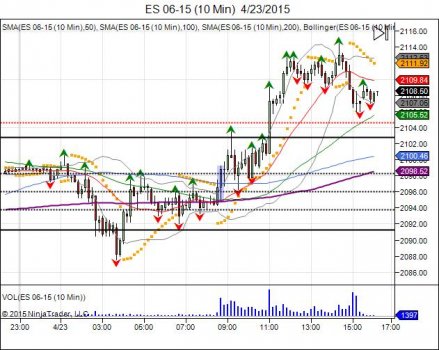
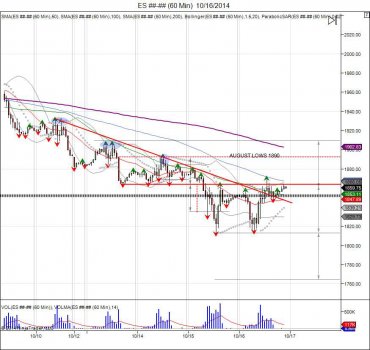
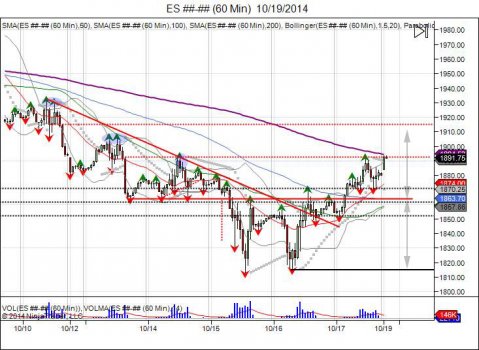
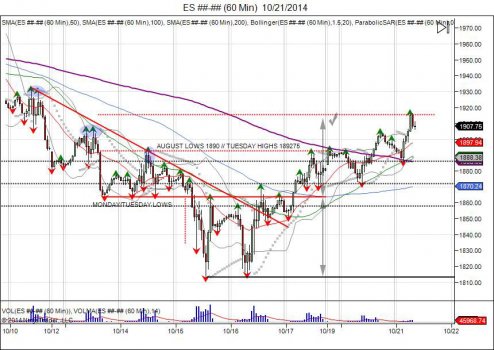
Sometimes most of the move is done in the overnight (Globex) session, and by the time the cash market opens and everyone is selling the weakness, the cash market holds to prevent these traders from getting paid. Interesting? Weird? This is what I call CASH MARKET GAMES.  Not only does a lower open lure in shorts, but when it pushes back to close on the highs, it sucks in new longs that need to get paid in the following session. Should the market open lower in the following session, those new buyers are on the hook and short sellers have to come back chasing lower. 

Tags:
Continue reading
2980 Hits

The Bear Trap into Yellen's Short Squeeze


On Thursday of last week, the market sold down to a low of 240525, which successfully tested and held the June low.  Friday saw the market overcome the 3D pivot range resistance to reverse the negative momentum. This reversal allowed Monday and Tuesday's 3D pivots to turn into support.  Both days saw the market chop sideways into awaiting for Janet Yellen on Wednesday.  This in turn, creating a cup/handle pattern, with room to expand into 2449 on a break through 2427.  

Tags:
Continue reading
3343 Hits

Is The Trump Trade Over?


When Trump took hold of Florida on election night, the SP500 futures sold off to a low of 2028, hitting its limit of 100 points to the downside.  The move, was reversed within the same day, seeing the market recover to push back to 2180 once the election was over and Trump was confirmed as the new President-elect.  The election of Trump, caught many off guard, however the market reversal also caught many off guard as a majority was looking for a sell off should Trump have been elected.  By taking the reversal of 2180-2030 of 150 points, this gave an upside objective of 2330.


Continue reading
2733 Hits

SP500-Tracking the Recent Correction, What Next?

Anyone old enough to remember the euphoric action on May 2, 2012 when Bin-Laden captured? $ES_F $SPY $SPX pic.twitter.com/8xMCd1AWzO

— Chicagostock (@Chicagostock) March 2, 2017


Tags:
Continue reading
3747 Hits

Will President Trump Devalue the US Dollar?

Before Mr. Ben Bernanke became Fed chairman, he made a speech before the national Economists Club in Washington, DC. on November 21, 2002, titled “Deflation: Making Sure "It" Doesn't Happen Here.” In these remarks, there were 5 major points Mr. Bernanke pointed out as tools the Fed could use to fight deflation:

Continue reading
6104 Hits

SP500's Consolidation


Tags:
Continue reading
2449 Hits

2016 Top 5 Trends

In no particular order, here were the top 5 major market changing trends of 2016 identified by Chicagostock:

1- DOW JONES CUP/HANDLE TARGET 20K
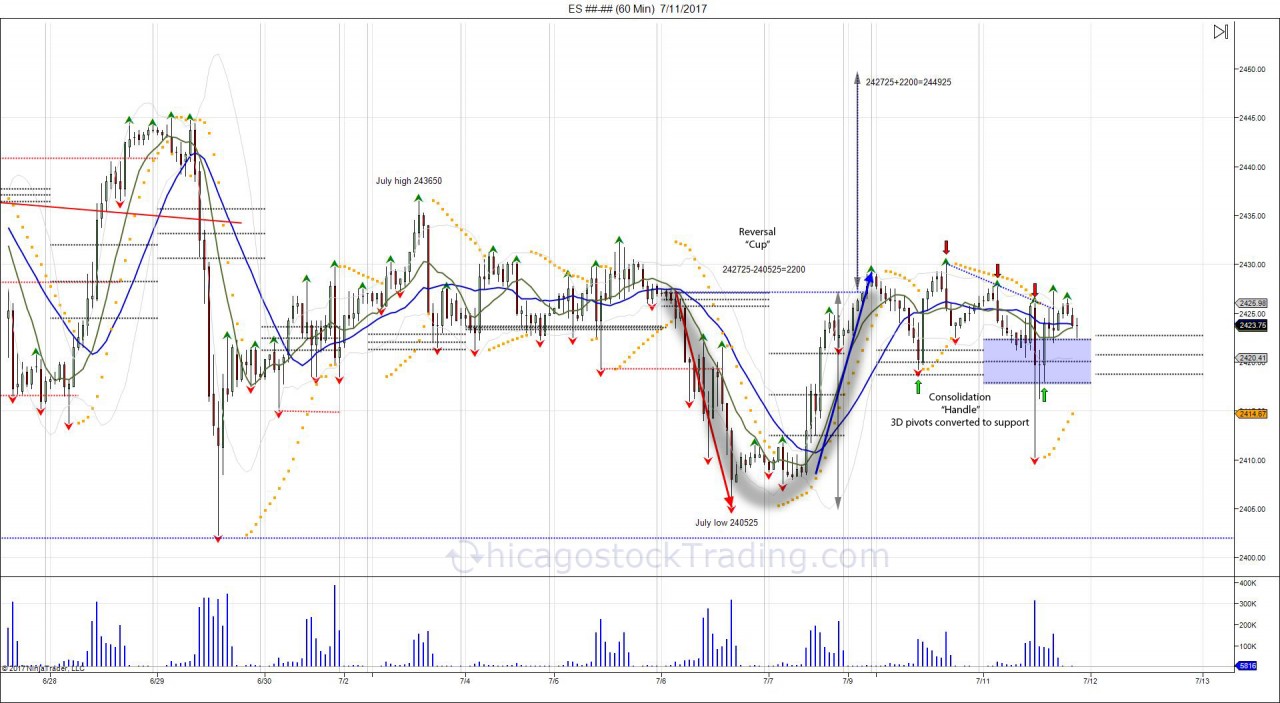
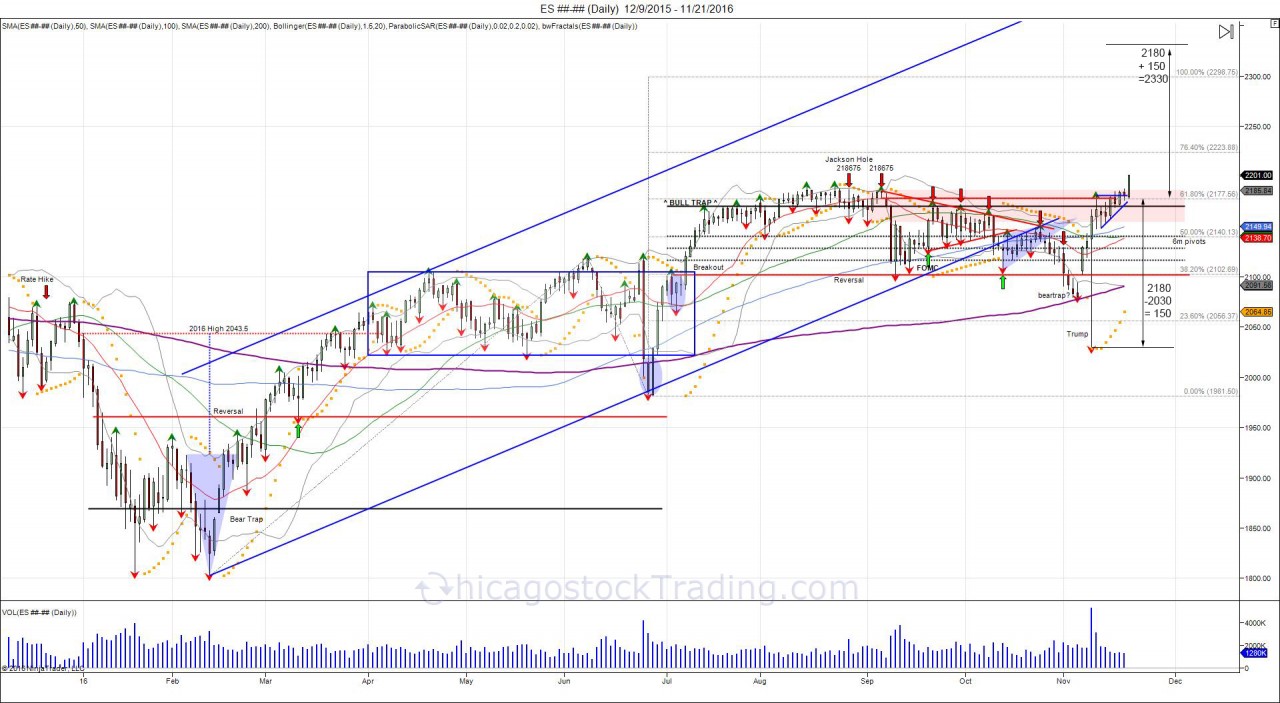
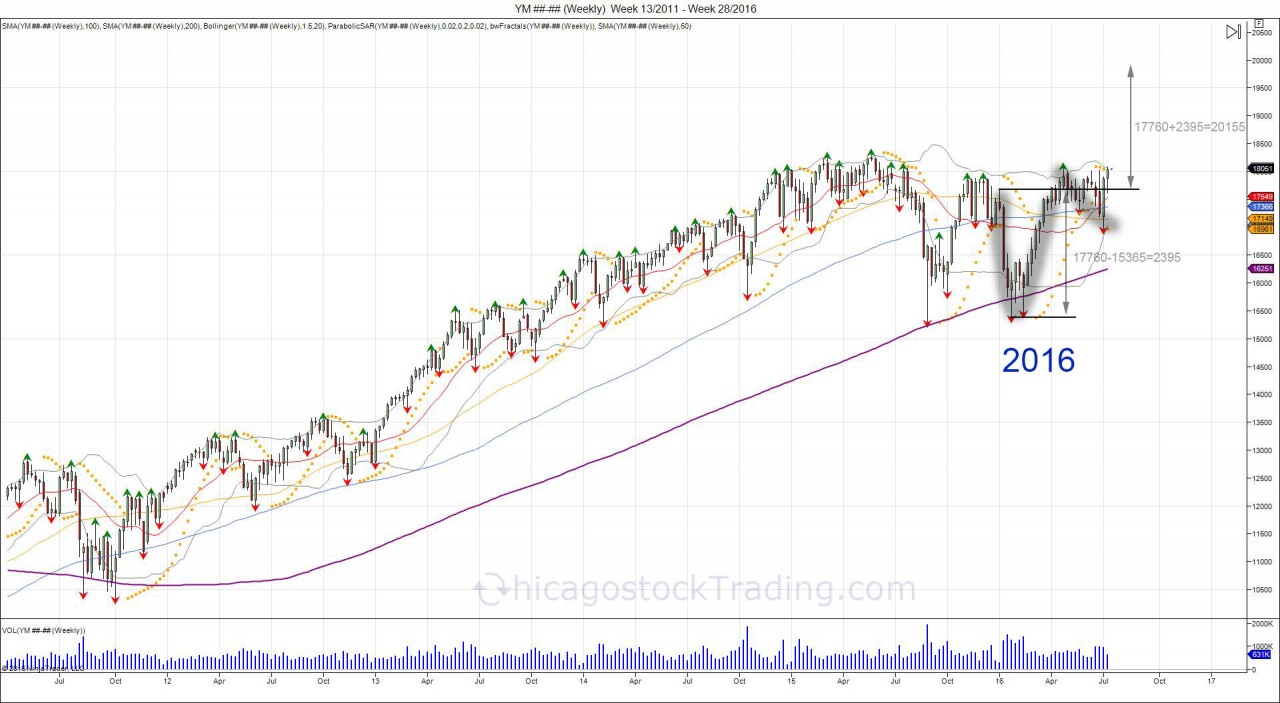
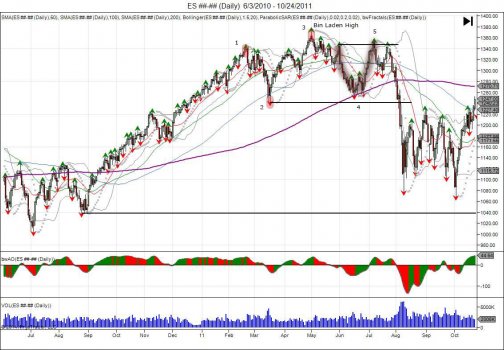
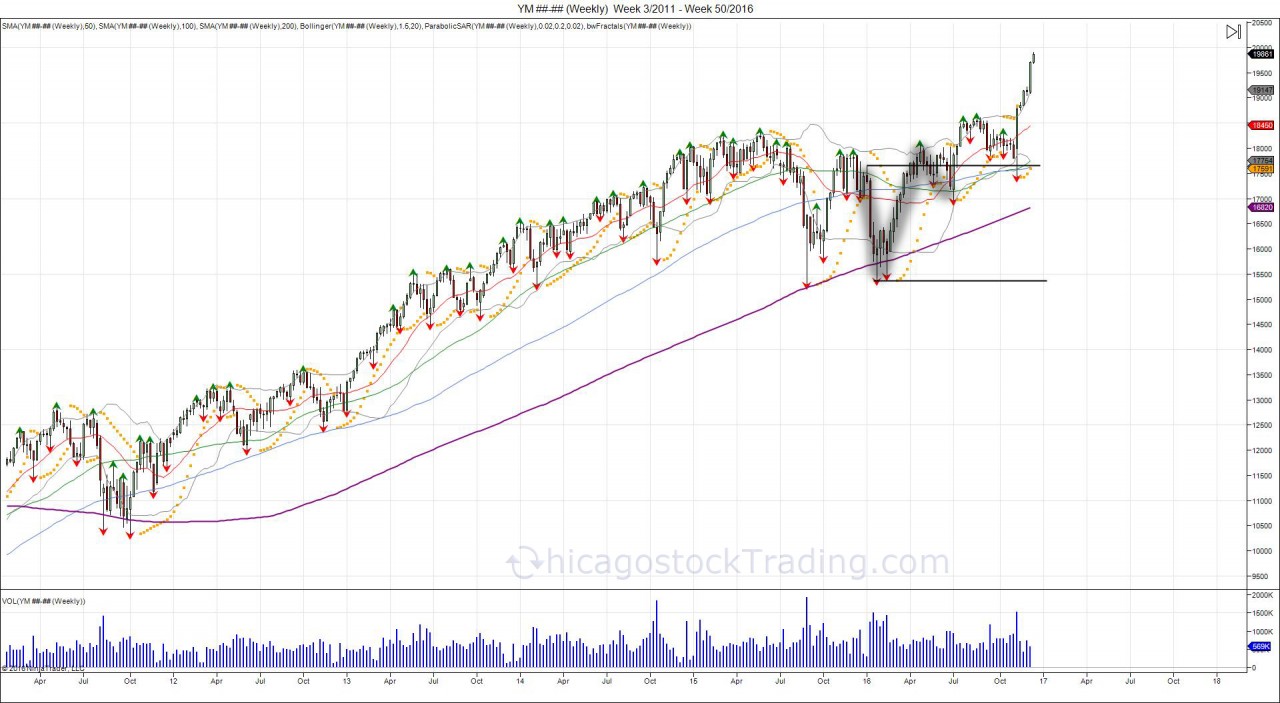
The stock market started 2016 weak, however recovered the highs of the year by summer, making a U turn. Those that were caught short, bearish, and wrong, were now forced to reverse position, thus creating the cup/handle formation, giving way to expand the U turn up to 20k.
Continue reading
3465 Hits

SP500's ride from 1800 to 2040 with Chicagostock

HOW DID THIS:


GET TO THIS?:

Continue reading
4192 Hits

How Oil Ripped the Face off Shorts

Let's take a look at how the oil short squeeze took place.  In February, oil broke the January low of 2756, falling to 2605 on February 11th.  Just as oil was testing and ready to break 26, the UAE Energy minister came out with remarks that they were willing to cooperate on production cuts.  This instantly reversed the market off the lows to see it recover 30 in the coming days.  Dubbing this the "OPEC put" as it clearly showed members of the organization were attempting to defend 26.  

The move, setup a failed breakdown, leaving shorts below 30 trapped:

Tags:
Continue reading
5002 Hits

The Great Reset

05_22_jpg.jpg

In December’s article “The Yellen that Stole Christmas”, the point was to show how buyers in the SP500 were caught above 2040, and needed a Yellen rescue.  The market attempted to breakout to start December, however the rug was pulled from underneath as Yellen reiterated a rate hike later in the month.  After bluffing the market for 2 years on this rate cut, the call fell on many deaf ears.  So it was. Buyers were left caught at higher prices, betting on a “Santa Claus Rally” only to be hoping for Yellen to save Christmas.  For the first time in 6 years and exactly 3 years from December 2012’s FOMC that placed a 6.5% target on NFP for a decision on Fed Funds rate, the FOMC reset the market and hiked the Fed Funds rate by a quarter point.  Bulls did not get what they were looking for and saw the market fall back to retest 1982 support.  The level barely held on December 18th, as the market rallied back for Christmas holiday and the “Santa Claus Rally” was actually a gift from Yellen for stuck longs above 2040 to “breakeven”, or as we like to call it “get out of jail free card”.  

Continue reading
4504 Hits

The Yellen that Stole Christmas


When the FOMC decided to place a 6.5% target on NFP rates to justify raising the federal funds rate, the SP500 was trading 1427, gold 1718, US dollar 7985, and 30 year bonds at 148.  

“… the Committee decided to keep the target range for the federal funds rate at 0 to 1/4 percent and currently anticipates that this exceptionally low range for the federal funds rate will be appropriate at least as long as the unemployment rate remains above 6-1/2 percent…” (FOMC 12/12/12 source).

Just days after this release, we highlighted the weakness in gold: Whats With Gold? FOMC Spooks Market. Double Top Eyes 1250.

Continue reading
4094 Hits

Pre-FOMC Market Update


Futures, foreign currency and options trading contains substantial risk and is not for every investor. An investor could potentially lose all or more than the initial investment. Risk capital is money that can be lost without jeopardizing ones financial security or lifestyle. Only risk capital should be used for trading and only those with sufficient risk capital should consider trading. Past performance is not necessarily indicative of future results. Video content hosted by third party.

Continue reading
3216 Hits

CST Pro May Trial

Excerpt from CST Pro subscription email sent on 04/27/15 for trade day 04/28/15.  As highlighted in the report, 209050 was a long trade with specific stop and target levels. Bottom left of image is excerpt from our chat, highlighting Chicagostock's intraday analysis, followed by a chart of the intraday Emini SP500 on 04/28/15.  

CST Pro Subscription- 2 Week Trial 

  • Daily Emini SP500 Futures Analysis
  • Daily pivots & vol windows (ES/CL/GC)
  • Volatility Windows PDF Guide
  • Swing trade recommendations
  • Live trading chatroom
  • Live charts
  • Live day trading signals 

CHATROOM TESTIMONIALS


For the month of May of 2015, we are offering a special 2 week trial period to CST Pro for only $99! This will gain you access to the daily letter, pivots, live day/swing trade signals, trading room, and screen share.  

This is an open offer to allow you the opportunity to try our group and see what we are about. Only serious traders apply. We have room for a maximum of 10 new traders. If you beleive you can find value in joining our group and services, please feel free to apply. See you soon and best of luck trading!

 Please email This email address is being protected from spambots. You need JavaScript enabled to view it. for future trials and or any questions.


By accepting trial membership you agree to terms and conditions. Chicagostock Trading uses proprietary and copyright protected material.

RISK DISCLOSURE: PAST PERFORMANCE IS NOT INDICATIVE OF FUTURE RESULTS. THE RISK OF LOSS IN TRADING FUTURES AND OPTIONS IS SUBSTANTIAL AND SUCH INVESTING IS NOT SUITABLE FOR ALL INVESTORS.  AN INVESTOR COULD LOSE MORE THAN THE INITIAL INVESTMENT.

Continue reading
2928 Hits

CST Emini Report vs CST Pro


CST Emini SP500 Report:

Example and excerpt of ES analysis sent on 04/22/15 for trade day 04/23/15 through CST EMINI SP500 Report:


Thursday 04/23/15 Emini SP500 Chart:

05_22_jpg.jpg

Low: 2087.50

High: 2114.50

Tags:
Continue reading
2778 Hits

Losing money watching TV...

 05_22_jpg.jpg

Continue reading
3399 Hits

SP500 Market Update - Video


Futures, foreign currency and options trading contains substantial risk and is not for every investor. An investor could potentially lose all or more than the initial investment. Risk capital is money that can be lost without jeopardizing ones financial security or lifestyle. Only risk capital should be used for trading and only those with sufficient risk capital should consider trading. Past performance is not necessarily indicative of future results. Video content hosted by third party.

Continue reading
2600 Hits

Technical Analysis Right Before Your Eyes

Continue reading
3481 Hits

SP500 Will History Repeat Itself?

 05_22_jpg.jpg

(click chart to enlarge)

The SP500 has come a long way.  Starting the year at 1838 to put in lows of 1732 and make highs of 2079 as of recent.  The 2nd half of the year has seen volatility expand.  July began just as January did, a very tight trading range followed by a small pullback before rallying into new highs. Difference in the 2nd half was the new highs was rejected in September, with the market falling apart in October to take out the August low and fall into 1813, testing major support based off the April lows.  The break of the multi year bullish channel, was followed by one of the most massive and violent short squeezes ever.  Just as early October the market put up a strong fight with violent short squeezes before finally letting go down to 1813, the move back to 1970 was just as violent.  The reversal from 1970 to 1813 and back to 1970, was a major short squeeze and V shaped bottom.  After this short squeeze, it was time for the market to take a breather, consolidate, attempt to build a base and support for new longs to join for a new leg up.  What happened was a different story.  Rather then allowing buyers this opportunity… Halloween 2014, just as the SP was pressing against major resistance against the September highs, BOJ came out with an expansion to their QE program, lifting the lid above the September highs and seeing the SP trade through 2k for the first time ever.  Rather then allowing the cool off period at 1970, the BOJ squeeze forced buyers to chase the market above 2000.  November made early lows at 1995, before grinding up to into highs of 2072 going into the Thanksgiving holiday. During this period, the cash market worked very hard to open and settle the market at its prior close, walking a very tight line.  Following the holiday, the market saw a gap open lower down to 2048, only to becoome a bear trap as the following day the market squeezed back above 2060 to save cash buyers and grind out new highs.  Draghi came out on the 4th of December, touting a ECB QE program in January which led the market to scetch out another new high at 207725.  All of these highs were made by a few points and saw profit taking into them. The following day was NFP and the SP managed once again to squeeze 2077, print highs of 2079, and fail to hold above. This led into a break out failure, seeing the market fall back to retest the December 1st low of 2048. 


The SP’s move below the Dec 1st low of 2048, has confirmed a short term failed breakout above 2077 and a double top.  The move now is testing major support down to 2015 based off the November low of 1995 that led to the chase higher.  The current break has caught longs off guard and sellers are looking for blood to press the market lower.  Failure to hold the November low of 1995, confirms a failed breakout above 2000 as the market retraces back below the BOJ QE breakout and leaves buyers who chased above holding the bag.  First major downside support is seen down to 1977 to retest the breakout point from October’s V bottom 1970-1813-1970.  The question that will arise and will be seen is will there be buyers left to buy the market at this level, after the BOJ forced them to chase above 2000?  This will leave for a thinner bid on the downside and more longs who are caught giving way for volatility to expand.  A failure to hold 1970 gives room down to retest the 1813 low with major support down to 1840.  The objective for the sell side is to take out these lows and test the 2014 low of 1732 with support coming in at 1750.  To reverse current momentum, buyers need to recover above 2050 to retest resistance at 2068 based off the highs of 2079.  The objective for the sell side is to settle the market below the December 1st lows to establish a weekly sell signal and bearish engulfment.  


Tags:
Continue reading
3243 Hits

How Does the Ali Baba Top Differ from 2011's Bin Laden Top?

 05_22_jpg.jpg


The recent reversal in the SP500 has reminded us of a similar time the charts and reversal felt and looked the same.  The above chart is from 2011.  As seen the market made an early high of 1335 in February, correcting down to 1241 before rallying back to new highs.  New highs were made on what was called the "Bin Laden" high. On the news of his capture, the SP printed the highs for the year at 1373.50 and turned lower to retest the previous 1335 lows made in February.  This retest was followed by a "U" shaped reversal that recovered back to where the market failed at 1348 on the 1st of June.  This reversal failed to stabilize and push through the highs, leading into what developed the right shoulder for the 2011 head/shoulder top and crash down to 1080 that was fueled by the debt downgrade.  QE 2 ended in July 2011, just as QE 3 is expected to end 10/29/14. 


Continue reading
3667 Hits

The Crawl Back to 1915

 05_22_jpg.jpg

After attempting to hold last Tuesday, the market rallied to 189275, only to meet major resistance against the broken August lows of 1890. This led to a narrow range last Tuesday, barely holding Monday's 186375 low.  Globex saw the market break this triple bottom against 186375, giving way for the 189275-186375 range to be expanded down to 183475 (189275-186375=29, 186375-29=183475). The market fell on Wednesday to complete this target, however continued another 20 handles lower into 1813 to test major support from the April lows, before seeing a squeeze back to the 1863 level.  The following day saw a retest of the lows which held, creating another range, 1863-1813. The range gave room for the market to expand up to 1913 (1863-1813=50, 1863+50=1913), or down to 1763, depending if the ES was able to breach the top range at 1863, or bottom range at 1813.


On Friday the SP500 recovered above 1863 and attempted to target Tuesday's 189275 highs, running into 189175.  The break above 1863, gave the market room to expand up to 1913.


On Monday the SP took out last Tuesday's 189275 high and found support down to 1870 before rallying into close at 1900.  Today, 1 week after the failed 189275 high made last Tuesday which was followed down to 181300, we have recovered back above those 189275 highs and completed the short term range expansion target of 1913.  The move now retests major resistance based on the double top made at 1930, along with revisiting the scene of the crime, being the 1920 major support level that was tested early October before finally giving out and falling 100+ handles.  Old support becomes new resistance.  A move through 1980 is needed to reverse momentum and create a V bottom on daily charts as rallies into 1920-1958 offer sellers an area to defend.  

Tags:
Continue reading
2644 Hits