Chicagostock Trading

Chicagostock Trading

Oil moves up $16 off lows, pays 27k


CL________Weekly___Week_48_2008___Week_33_2012.jpg

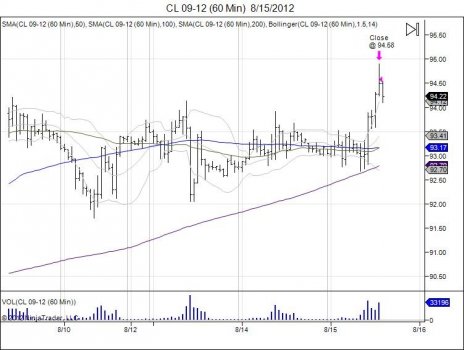
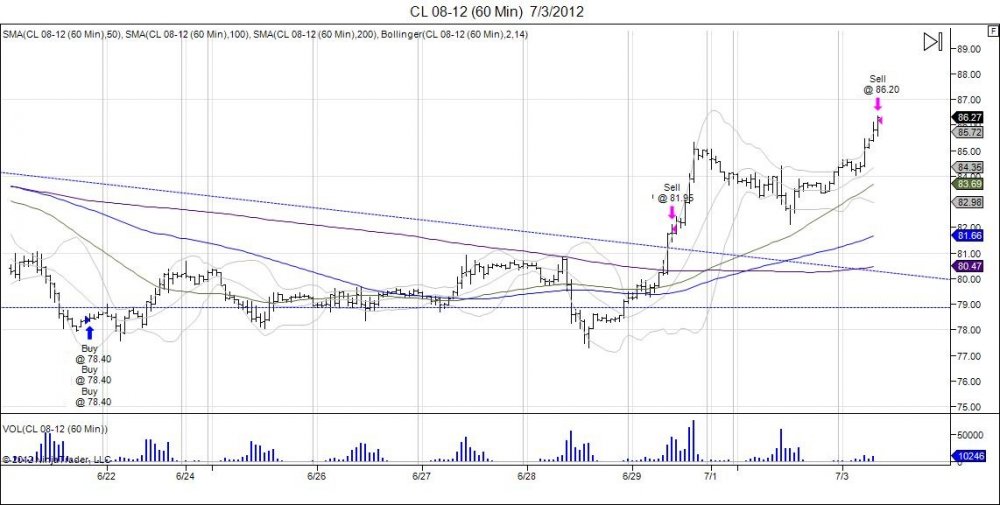
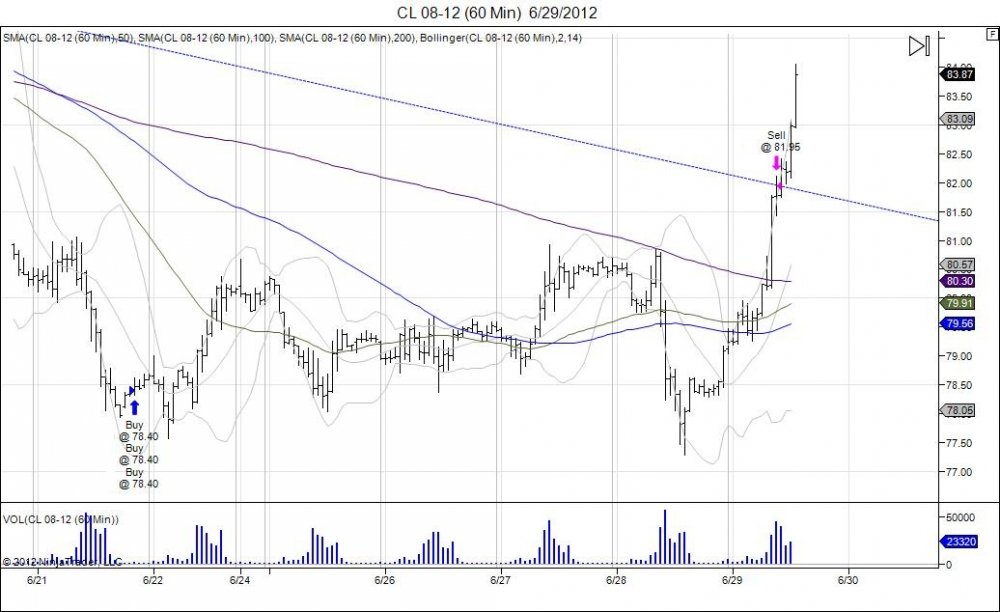
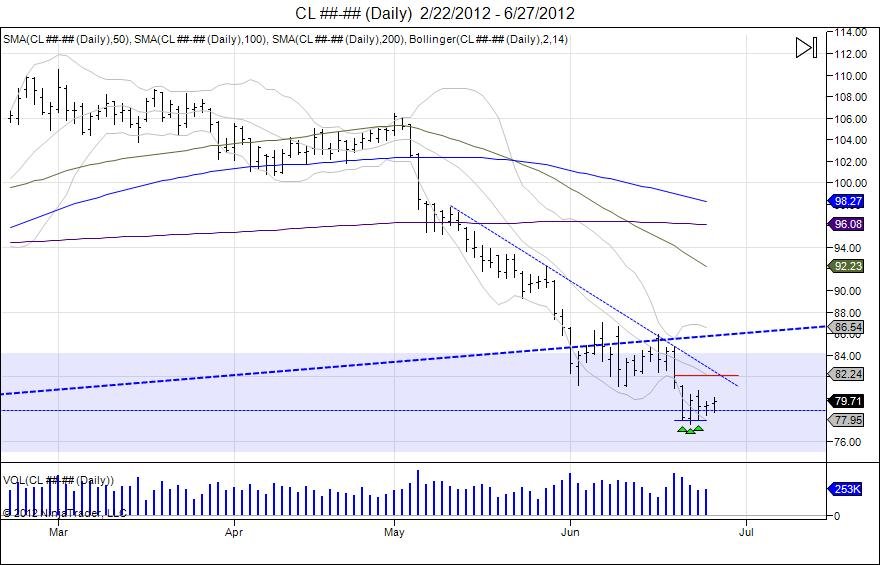
September crude oil contract ran up to highs of 94.90 today with only 5 days remaining for the contract to trade with it's expiration nearing on August 20th.  The move approaches the 9750 target which retraces the market to where it failed May of this year.  With the contract having to go into another roll and only $3 shy of its upside target, it is good enough to finally close out the runner position from 7840.  This contract already had to go through a roll from August into September and with the close of September, the two contracts combined have paid a total of 15.87 on this runner position. More then the first two targets combined which netted 11.35.  There was no risk on the runner after taking profits on targets 1 and 2 and allowing the 3rd to run with a stop at entry, however the trade has completed for a total of $27.22.  

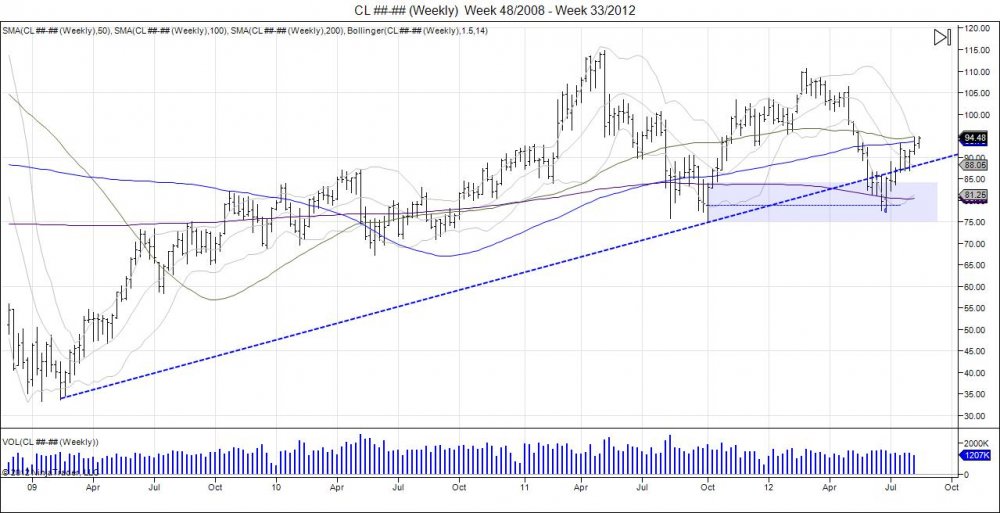
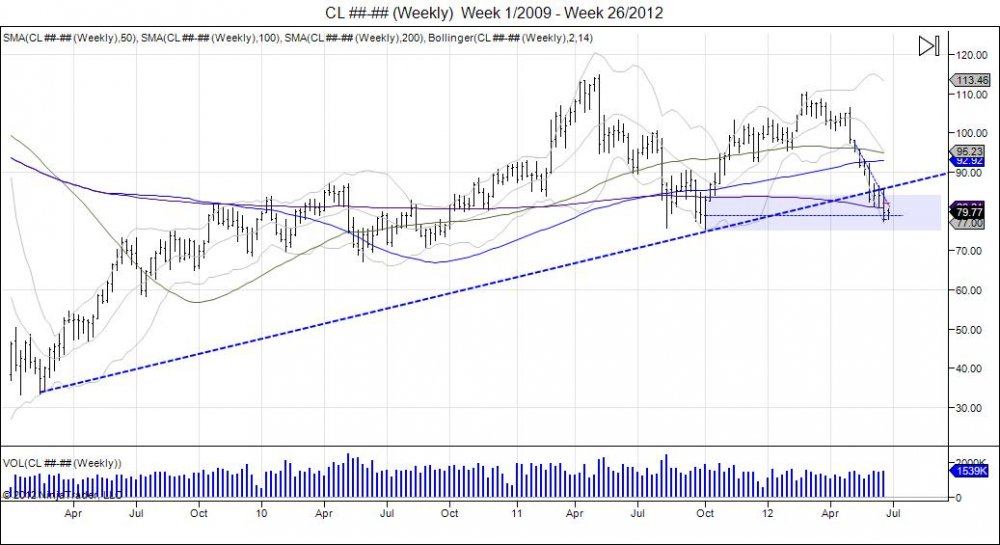
Going forward, 9750-10643 is a major area of resistance for crude oil to work through.  Moving past this range retraces the market to where it failed in May, making a U turn on the weekly chart, where at this point consolidation would need to be seen to build a base and target the year highs above 110.  Until then this is speculation and we need to see the market trade through this major resistance range of 9750-10643. Downside support is seen 8936-8684 and down to 8530.


CL_09_12__60_Min___8_15_2012.jpg


Reference: How We Played Crude

Continue reading
2829 Hits

Lumber Prices Complete Upside Objective

 LB________Weekly___Week_26_2009___Week_5_2012.jpg

 ^ Earlier this year, lumber prices showed signs of life as the market was knocking against 260 resistance after 6 months of building a base in late 2011.  The breakout above 260 took place in February of 2012 and the market turned this old resistance into new support.  Consolidation was seen holding above 260 as the market worked higher to complete its upside price objective of 311, retracing the prices to where they broke down in March of 2011 with highs of 324.7. 

LB________Weekly___Week_44_2009___Week_33_2012.jpg

click to maximize

Continue reading
2778 Hits

Euro's Inverted Head/Shoulder

 6E________Daily___2_8_2012___8_7_2012.jpg

Following last Thursday's "Draghi Sale" as the Euro fell down into lows of 12140 which retested the July lows, the market has sprung back as buyers stepped up to defend this low and sellers failed to break the range. A right shoulder developed with this move and the market is back to testing its neckline of 12417.  The move in itself has given brave buyers of the Draghi sale oppurtunity to have locked in most profits and now allow runners to work as the market attempts to chip away at this neckline.  Shorts in the market are now trapped as the market failed to move lower and the squeeze against the neckline puts pressure against these shorts to cover.  Moving past this resistance gives room to continue the squeeze and use shorts as the fuel to move past the 12051-12417 range. The inverted head/shoulder targets the June highs of 12759, putting the market against its 100 day moving average as well as the top of its daily channel.  Failure to attract buyers above 12417 and a move below 12140 is needed for bears to regain control.


6E_09_12__60_Min___8_6_2012.jpg


euro.jpg


Continue reading
4570 Hits

SP500 Retraces 100%

 ES7_19.jpg


Following the 1319.75 lows made on July 12th as the market retraced lower to test its breakout point on the 29th of June, the Emini SP500 has held this level of support to break out of its handle formation off the highs of 1375. This breakout has led to a 100% retracement back to 1375 as the market has squeezed out this high.  As noted in our market update on June 26th, we believed the pullback offered buyers opportunity to defend the market as the rounded bottom in the CUP was forming, followed by our post on July 12th as the handle was being formed identifying the 1328 level as support.  With the market now at 1375, this rewards those brave buyers by giving opportunity to take money off the table as 2 of the 3 targets are complete, 1348 and 1375.  Going forward, buyers can now run positions with their stop at their entry levels at the 1328 level and let the market attempt to complete its upside target of 1422.  This move past 1375 confirms the cup/handle formation, however the next major resistance comes in at 1390 which retraces the market to where it failed at 1411.75 in May.  Rather than buying at these levels, by stepping in and buying the breakdowns seen over the past few weeks, this has rewarded runners to do the heavy lifting through these major resistance levels. Sellers will be defending 1390 at all costs as this is the last level of defense where if fails, the highs of 1411.75 will be taken out, giving room to complete the upside target of 1422 and attempt to extend into 1441 being the May 2008 highs that saw the reversal into 665.75.  Failure to push through 1390 and a move below 1319.75 derails momentum. 


Continue reading
2907 Hits

Friday the 13th for Stock Bears

 ES________10_Min___7_13_2012.jpg


It was surely Friday the 13th for stock bears as the market moved through Thursday's highs which led to shorts being forced out as the market retraced back to where it failed earlier in the week at 1352.00-1356.50.  The market closed the week a tick higher at 1352.00 from last week's close of 1351.75. The move was a win for bulls as the market was down pressing against the late June lows on Thursday.  The market reversed on Thursday and was able to close above 1328, giving bulls their platform to continue higher. This was seen today with 1328.75 lows and a run into highs of 1353.25. The move in itself has given aggressive bulls who defended the pullback oppurtunity to take some money off the table and reduce exposure as the street now is back to bullish.  With the short squeeze sparking this rally, going forward it will be up to buyers to come in at these levels to carry this momentum and retest the major resistance of 1357-1375 level from early July where the market failed.  Bears are now looking at this squeeze as a simple retracement into those failed highs to build a -right shoulder, thus making the range of 135-1375 that much more important. Moving through this range sees next major resistance coming into play at 1390, followed by targeting the year highs of 1420.  Downside support is now 1340 and a break below Thursday's lows of 1319.75, derails this move and puts pressure to retest the 1302.50 lows from late June, followed by the 1297 right shoulder created June 12th.  

ES________60_Min___7_13_2012.jpg


ES________Daily___12_16_2011___7_13_2012.jpg

Click chart to enlarge

Tags:
Continue reading
2835 Hits

Will Bullish SP500 Patterns Hold Up? All Point To Year Highs

 es7_12.jpg


This year started out with a gap above last year's close of 1352.50, leading the market into highs of 1419.75 on March of 2012, which was met with the last level of resistance before the 1441 May 2008 highs which is the reversal that led into 665.75.  The SP500 retraced to test its year lows of 1259.75, only to hold and put in a double bottom at 1262.00 on June 4th.  Since this low failed to take out the year lows, the market bounced early June to squeeze shorts and make a 1342 high.  The market backed off this high and retested the short squeeze by pulling into lows of 1297.00 and holding to create a right shoulder of an inverted head and shoulders pattern as the market was testing its head of 1262.  With the test of the lows holding and the market turning, more shorts were caught as the market rallied through 1342 for another squeeze in attempt to break above its 1342 neckline, only to hit highs of 1357 and stutter.  The market met resistance at its 100day moving average along with the levels from where it broke down May 11th.  Following this failure to hold above the neckline the market was sold along with news from Reuters that “Goldman Sachs recommends shorting US stocks” with a 1285 target.  This news led to weak hands selling dropping the market down to 1317 off its highs of 1353 that day. This retested of the right shoulder lows of 1297 as the market hit 1302.50 on Monday, June 25th.  The following day the market tested this low with a 1303.25 low, and held to reverse and squeeze shorts running into resistance at 1330.  The market backed off this resistance level and retested Tuesday’s reversal by finding support at the open 1306.75 and once again putting in a reversal on this Thursday.  This action created a rounded bottom as the market failed to break below 1297, causing a run higher on Friday to squeeze out shorts due to the failure to break lower, retracing the market into 1375.  This action created a U turn as the market came back above 1357 which was where it broke down and rounded out to come right back into this level. Also known as a CUP.


Since the reversal seen into 1375, the market has gone into consolidation in attempt to build a handle for the cup as downside support is tested.  This handle has retraced the market down to where it reversed at 1328 from June 28th.  This is much steeper then the bulls would like and has the market pressing against this old resistance, acting as new support being the level where the market reversed higher into 1375.  On Thursday, July 12th the market shook below this level into lows of 1319.75 which hit the bottom of its rising channel from the 1283-1302.50 lows as seen above.  The market bounced off this channel and closed above 1328.  Going forward this level remains support with small stops below 1319 followed by larger stops below the CUP lows of 1302.50. A break below this low voids out the cup/handle and puts pressure to test the June lows within 1282-1262.  A close above 1342 is needed to close above these most recent highs and attempt to break out of this handle pattern to retest the premature breakout of 1357-1375.   A break above this confirms the cup/handle pattern with a target of the year highs.  Following this the next major resistance comes in at 1390 off the failed 1411 high in May. This cup/handle formation is also within the larger inverted head/shoulder formation with the left shoulder lows of 1287.25, head of 1262.00, and right shoulder of 1297.00 with a neckline of 1342.00, also targeting the year highs at 1422.  To void out this head/shoulder formation the head of 1262 must be taken out which gives room to take out the year lows of 1259.75 and fill the gap from last year at 1252.50.  So long as this gap is open, the bull is alive as a double bottom has formed by an inverted head/shoulder against the year lows which keeps pressure against sellers as the market attempts to squeeze shorts higher.  The ultimate objective above the year high is squeezing the May 2008 high of 1441 being the high the market reversed from that led into the crash down to 665.75 as seen in the weekly chart. 


Continue reading
6504 Hits

Two SP500 Channels to Watch

 ES________60_Min___7_12_2012.jpg

Hourly ES channel off 1375 highs, seeing 76.4% retracement of 1306.75-1375.00 move.


ES________Daily___12_13_2011___7_12_2012.jpg

Daily rising channel from 1283 lows on 06/06.


Tags:
Continue reading
2301 Hits

07/09/12 SP500 Intraday Action

ES________5_Min___7_10_2012.jpg

Overnight July 10, the Emini SP500 pulled in to retest its inverted head/shoulders bottom, with a 1343.00 low. The market held the head/shoulders and squeezed higher to complete the h/s target of 1353 with highs of 1355.25.


_______________________ES________5_Min___7_9_2012.jpg


After failing to rally at the open, the market fell down to take out Friday's lows by .50 at 1341.75. A squeeze was seen following this, leading back into the opening range. First test of the opening range met more sellers and the market was seen moving back down into new lows at 1341.00.  Another hold and reversal at this level the market turns back to where it failed previously (1347) and puts in a high of 1347.50, once again meeting sellers at the opening range and not able to hold up.  Another push down was seen, retesting the lows by falling to 1342.25 as the test of 1341.00 was defended by buyers, in turn building a right shoulder for an inverted head/shoulders pattern.  This defense led to another squeeze higher, this time since the low was retested, the market found enough strength to squeeze through its neckline of 1347.50 and put in a new session high of 1349.75 before settling at 1349.50. Today was all about attracting sellers below 1343 and squeezing out longs as the market had 3 bounces off these levels. It was not an easy day being a bull eitheir as the bias for today was bearish, however in the end, the bull squeezed out a new session high. 


Continue reading
2776 Hits

Soybeans Target New Record Highs

 ZS________Weekly___Week_43_2007___Week_26_2012.jpg


Since Soybeans put in highs of 1456 in September of 2011, the market fell down to 1094.25 within a few months in December of 2011.  Since these lows, the market has rounded out a bottom and come back right to where it broke down at 1456.  The market breached this high in April of 2012, rallying up to 1509.00. Since this was a complete U turn and new 3 year high, the market went into consolidation off these highs in attempt to look for support.  This in turn created a "handle" for the "cup" formation that was formed from 1456-1094.25-1509.  This handle pulled down into lows of 1317.50 in June 2012 and pivoted off this low to break out of its downward channel within this handle. Since this breakout the market has ran through the 1509.00 high, making new highs of 1517.75.  This cup/handle formation has a target of 1817.75, which breaches the July 2008 high of 1663.00.  This target is derived by taking the range 1456-1094.25=361.75, adding to 1456=1817.75.  Pullbacks down into 1400 should be supported with stops below 1317.50.

Continue reading
2730 Hits

How We Played Crude


07/03/12 Update:CL_08_12__60_Min___7_3_2012.jpg 

Crude reached its 2nd target of 8640, currently trading 8660s. 2/3 of trade is out.  Total locked $11.35. Next resistance 9020-9220, target on runner = 9750. This runner target will add $19.10 if completed.


_________________________________


CL_08_12__60_Min___6_29_2012.jpg

It was no easy task holding crude long this week. After attempting to breakout at 8092, the market failed on Thursday and a shakedown was seen squeezing out weak hands as the market fell into new lows for the week at 7728. Wiping paper gains. Sure enough this breakdown turned into a failed one as the market has reversed through Thursday's failed highs of 8084, completing the first upside target of 8240. Having taken some heat, we locked in target one at 8195 with no complaints. The market has confirmed the long side direction following Thursday's failed breakdown by this reversal, and we are seeing that today with the squeeze higher as shorts are forced to cover and longs who were squeezed out are forced to chase the market higher.  To continue higher, downside support is now seen down to 8090. Next upside targets come in at 8640 and 9750. 8474-8589 offers next major resistance, followed by 9750 which retraces the market to where it broke down the first week of May off highs of 106.43.

Continue reading
3529 Hits

SP500 Plays Out

 ES________Daily___12_23_2011___6_29_2012.jpg


Earlier this week we saw the market fall into retesting its right shoulder down to 1297 following last week's failed breakout above 1342. On Monday the market put in lows of 1302.50, retested on Tuesday at 1303.25, and with the hold, Tuesday brought forth a reversal that led to 1328.50, testing last Friday's resistance. This led to a pullback on Thursday, retesting Tuesday's reversal as the market fell into Tuesday's open of 1306.75 and turned this number into the exact low on Thursday. Once again Tuesday's levels were heavily defended and we are seeing the market do another reversal higher, trading back through 1342 and now retesting last week's failure of 1336.50-1357.00.  As noted on Tuesday in our market update- "We believe this pullback offers opportunity for buyers to step up and trade the long side, scaling out against upside resistance levels and adjusting stops accordingly."  This move gives oppurtunity for these brave buyers who stepped up this week defending the inverted right shoulder down to 1297, to take some profits against these resistance levels.  The market is yet to be fixed, however now must work through 1357 to continue the upside momentum and attempt to trade up to 1391, which retraces and retests where the market failed on May 1st. Ultimately the 1342-1262 inverted h/s targets 1422, giving room for new highs for the year, however we still have the May 2008 highs of 1441 to clip.  Going forward a breach below 1302.50-1297.00 is needed to negate this formation and give room to retest the 1262 lows.


Continue reading
1302 Hits

Euro Squeeze?

 06/29/12 Update:6E________Daily___2_27_2012___6_29_2012.jpg

Following Euro's fish for a bottom this week, the market finally breached its continuous June 12 low of 12443 down to 12417 and the market has climbed back to turn 12443 into today's lows as the market has run through Thursday's failed 12535 highs, squeezing shorts and hitting resistance from June 20th within 12646-12753.


______________________________________________________

6E________Daily___2_8_2012___6_27_2012.jpg

Since the Euro reversed off its 12288 lows from June 1st, the market ran up to resistance which was met from the May 21st levels at 12726.  The market failed to breach this level as sellers defended the range and went through a shakedown which led the market down to break its rising channel and fall into testing support from the June 12 lows.  This was the day the market pivoted into 12726.  The September contract lows from this date are 12455 and this week we saw the market clip this level and fall into 12451 before quickly recovering. On Wednesday this low was retested with a 12455 low that failed to break the week low of 12451.  Just as the Emini SP500 put in lows of 1302.50 on Monday and failed to take them out on Tuesday with a 1303.25 low which has been followed by a short squeeze higher into 1328, the Euro should also put pressure against shorts to cover as the market did not give oppurtunity to break the weekly low. On the continuous chart, the June 12 low comes in at 12443.  A close above 12542 is needed to squeeze out shorts and target the next major resistance being 12646 from where the market failed at 12753 on June 20th.  This is a major level of resistance as a test of this can build a right shoulder if sellers can hold the range, or see the market squeeze through to continue higher.  On the downside the 12443 lows are the neckline for this 2 week consoliation. A breach of this gives room to retest the month lows down to 12288.


Tags:
Continue reading
2889 Hits

Crude Oil Charts

 CL________Daily___2_22_2012___6_27_2012.jpg


CL________Weekly___Week_1_2009___Week_26_2012.jpg

Tags:
Continue reading
2734 Hits

SP500 Market Update

 ES________Daily___12_23_2011___6_26_2012_copyA.jpg

click chart to enlarge

On Tuesday the SP500 worked its way higher after a test of the week low 1302.50 held, catching shorts off guard which led to a short squeeze right into testing Friday's lows of 1318.25. This is where the market paused following last Thursday's break lower below the rising channel which was followed by a brief pause seen on Friday as the market held and traded higher causing shorts to cover into the weekend.  On Monday the move down was continued and sellers chased the market lower. Tuesday we saw once again a hold and a trade higher causing shorts to cover, only to lead right into where the market failed on Friday within 1318.25-1331.75.  This is a major range for buyers to squeeze through to show strength and attempt to retest where the market failed at 1336.50-1357.00 as the market tested its 100day moving average which kept a lid on prices and has the market now pressuring against retesting the 200day moving average along with the right shoulder of 1297 built on June 12.  Tuesday the market did show potential as sellers were unable to put in a new low for the week, causing a intraday U turn which built a handle and pushed into highs of 1318.  This push into 1318 is knocking on the door of resistance and is giving sellers their area to defend. Buyers have Tuesday's lows as their reference point to defend pullbacks and use this turn around to attempt to swim against these trends and squeeze through these resistance levels of 1318, 1327, 1336, 1390. Downside support is seen at 1310, break below 1297 gives room to retest the June lows with support at 1282. In the big picture, this is a retest of the inverted head/shoulders that was created mid May into mid June, offering buyers their levels to defend. Failure to do so and a break of the June lows sees room down to next major support at 1209.  We believe this pullback offers opportunity for buyers to step up and trade the long side, scaling out against upside resistance levels and adjusting stops accordingly. The inverted head/shoulders within 1342-1262 offers a 80 point range, if added to 1342, this targets 1422 which is a retest of the year highs at 1419.75.  Ultimately this will give room to run stops against the main May 2008 highs of 1441 which was the reversal that led into the lows of 665.75.  Failure to hold the 1297 level gives the room into retesting those 1262 lows where a break of this gives room to fill the gap from last year down to 1252.50 which puts the sellers into control. The 2nd half of the year begins in July, and how the market trades in the first two weeks will set the tone for the remainder of the year. 


Tags:
Continue reading
3936 Hits

Today's ES Trade

ES_09_12__10_Min___6_22_2012a.jpg 

Update: Runners see 1329.75 upside objective met. Adding 9.75 on top of 8.50 locked in. Total of +18.25. Runners don't always play out, but objective is to reduce exposure, take profits along the way, and allow runners to work where if they do, they pay as much as the first and second target combined.

_________________________________________________

ES_09_12__10_Min___6_22_2012.jpg

Yesterday's market action dropped into the 1320 support level with an intraday low of 1317.50 as the market squeezed out the downside. Overnight the trade was a long at 1320 and we have seen Thursday's lows hold providing oppurtunity to lock in intraday objectives on the top side at 1323.50 and 1325.00.  Two thirds of the trade is out and the runner is now doing the heavy lifting with a risk free stop at 1320 and an objective of 1329.75 on the upside. The market is trading very narrow as buyers are swimming upstream and sellers are fighting to break the market lower to close out shorts and lock in profits. 

Tags:
Continue reading
2718 Hits

How We Played the Yen

 6J_09_12__60_Min___6_20_2012.jpg


Following last Friday's squeeze into the sellzone in the Japanese Yen, the market opened lower this week, keeping buyers from that squeeze locked in allowing for the market to run lower and test downside support.  Today the market fell into retesting its monthly lows of .012546 with a low of .012558, giving oppurtunity to take some money off the table on the short side, and allow the market to now work this support.  If this downside is any good, it should be ready to break this monthly low in the coming days and turn lower to retest the .0124 level of where the market broke out late April. Thereafter comes the .011879 low from March, and ultimately the flash crash highs at  .011375. Reversing to take out last week's highs of .012737 gives room to retest the .012881 June 1 high.

Continue reading
2800 Hits

SP500 Market Update

 ES________Daily___12_16_2011___6_19_2012.jpg

The SP500 is back at trading the levels from where it broke down early May around 1350.  The market broke its channel at that point and fell into lows of 1287.25 May 21st, before seeing a small bounce that failed to regain the broken channel and was pushed back down to a new low.  Lows of 1362 were made, holding the year lows of 1259.75, and keeping the gap from last year down to 1352.50 OPEN.  This caught another bounce into 1342 on June 11th which was followed by another pullback that retested the lows.  The market came down to 1297.00 and found support, in turn building a right shoulder as it retested the 1262 low and has built an inverted h/s formation.  Since this right shoulder low the market has grinded higher and is now trading through its neckline of 1342, putting the market back within the channel it broke early May.  Taking this range of 1342-1262 gives us a range of 80 handles, adding this to the neckline of 1342 sees an upside target of 1422 which targets the year highs of 1419.75.  Recalling the upside target of 1441 being the May 2008 highs, the market stopped right at its last level of defense against this high which put in the highs this year at 1419.75.  We went into correction off the level and retested the lows of the year, however keeping the gap open has kept the potential to retake 1441 still there.  With a new target of 1422 now the market is working its way through heavy resistance and sellers. Doing so will give room to finally complete that May 08 high of 1441.  The bounce here is retracing the market to where it failed in May, so this will be an uphill battle as it comes back to where we failed within 1361-1411.75 as the range for sellers to defend. Failing to continue this move higher and falling back below 1297 puts the lows of 1262 in sight followed by the year lows of 1259.75 and the gap of 1252.50 to derail this bull.

ES________Weekly___Week_35_2007___Week_25_2012.jpg


Continue reading
3212 Hits

Euro Market Update

 6E_09_12__Daily___2_3_2012___6_18_2012.jpg

Since reversing off 12298 lows on June 1st, the Euro rallied to break its downward channel created from May 1st. This led the market into a short squeeze and a newly formed channel (bearflag) with the Euro running into its resistance range from May 21st within 12726-12826.  The move has given oppurtunity of buyers early this month to take profits against this major resistance level, as well as sellers a bounce into this resistance to defend.  Today we are seeing exactly that, sellers coming into defend this resistance range and pushing the market lower after a strong overnight gap higher.  Going forward, support is seen down to 12540-12455 as the range buyers must look to defend to keep this upward squeeze in place.  Failure to hold this range sees a retest of the 12298 lows followed by next major support coming in at 12164 off the 11874 lows put in June 2010. Moving through 12726-12826 is needed to turn this downard momentum in the Euro and squeeze out the new sellers who are defending this level with next major resistance coming in at 13000 from the broken April 16th lows.


Tags:
Continue reading
2349 Hits

Japanese Yen Sell Zone

 6J________Weekly___Week_6_2010___Week_24_2012.jpg

Since the Japaense Yen broke its neckline of .012582 late February, the market completed its downside target by falling into its support range of .011931-.011697 from April of 2011. Since this completion of its downside target and test of support, the market has grinded higher, squeezing out sellers and retracing back through its broken neckline.  Most recently the market spiked to .012881, hitting the top of its rising channel from the lows put in March 2012.  Since this spike high the market fell back into its neckline of .012582 which has acted as support.  Going forward, retracements into this spike high offers sellers a level to defend with stops above this high. Objective is to fall back below the neckline of .012582 and retest the March lows only this time to fall through and into the next major support which is .011375 from the flash crash highs of 2010.  Moving through .012881 gives room into next major resistnace being .013030 and a move through .013160 is needed to regain the bull.


Tags:
Continue reading
4381 Hits

Day Trading into Swing

ES 06-12 (60 Min)  6_6_2012_1.jpg 

On Tuesday there was a buy recommendation of 1271 with targets of 1278, 1285, and 1308.  The first 2 targets were completed intraday which allowed to take money and risk off the table by then moving stops to breakeven at 1271 for the last runner target of 1308 to be ran.  The third target or runners are always the gravy or cherry on top of everything as these give profits larger then the first two targets combined. Sometimes they work out, sometimes they don't. However to take out the greed, thought of "should I hold on, should I get out", taking money off the table along the way eliminates this and leaves a position that can continue to gain should the market continue to move in that direction.  On Wednesday the market ran up to 1299 and this was good enough to take off that 3rd target for a gain of 28 handles, totalling 44.5 handles.  Sure enough the market ran to 1308, however no complaints. 


Continue reading
3593 Hits