more...
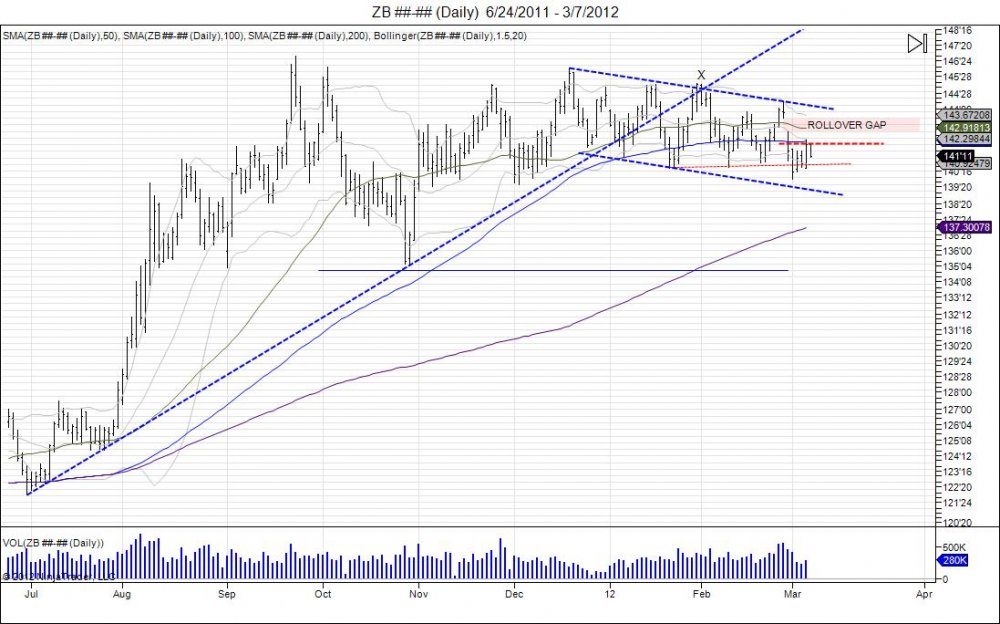
On January 19th when the bond market broke its trend line from June 30, 2011 – October 28, 2011, the market fell into year lows of 14021 for 2012. This was followed by a bounce back, squeezing shorts and leading into what was called “X MARKS THE SPOT” at the end of January. It was at this point where the bond market attempted to breakout as it retested where it fell down from, only to do a head fake with highs of 14515. This created a new channel pointing lower using the high of 14611 from December 19th and this most recent high of 14515 on January 31st. The market fell to retest the year lows of 14021 but failed to take them out with a 14023 low, before turning back higher. This once again squeezed weak shorts as it moved back to the top of the channel, putting in a high of 14414 on February 28 the day before rolling into the June contract. This turned into another head fake as the next day the June contract became the front month and we saw it on the continuous chart open at 14205, gapping lower from the previous day and leaving the market off guard to start a downside chase that targeted those year lows. It had to take a roll over to break these year lows of 14021 as the market fell into lows of 14002 on March 1st. We saw this breakdown once again heavily defended as the market tested the lower end of the channel and most recently we have seen the bond market squeeze back into highs of 14210, testing the contract roll over high of 14223. This is meeting major resistance at this level as a strong bear looks to keep this gap intact to leave longs in the market trapped and continue the chase to the downside and target the next major low being the December 13924 lows. We have already seen the market back off this latest retest of the 14223 high and moving forward the bear should be looking to take out this most recent low of 14021 to trigger a new wave to sell signals to target the 14002 low once again and move toward that December low. This 14021 level is a major level of support for buyers to defend and show their strength should they want to continue the assault against shorts and target this gap. Failing to hold 14021 means this latest test of the contract rollover high failed and the market looks to retest the year lows in turn causing the 50 day moving average to cross its 100 day moving average in what will turn into a death cross for the market and attract more sellers. Pushing through 14223 high gives room to fill the gap at 14316 in turn testing the 14414 highs before. The bond market has been in a major bull trend so it has taken some major work and time to try and roll over this 300 lb gorilla. It is slowly doing so and it has not been easy but it has been rolling over ever since the uptrend was broken on January 19th and the bond market formed this new channel pointing lower. The only thing that has taken place is that the market has been bouncing back in forth within this channel trying to whip out early and weak shorts and suckering in new longs. This gap will be very important moving forward, followed by the 50/100 day moving average crossing, as continued weakness finally can get this 300lb gorilla KO’d and sellers will take control. A push through this 14414 high would be needed for buyers to regain control and target that "X" high of 14515.

