more...
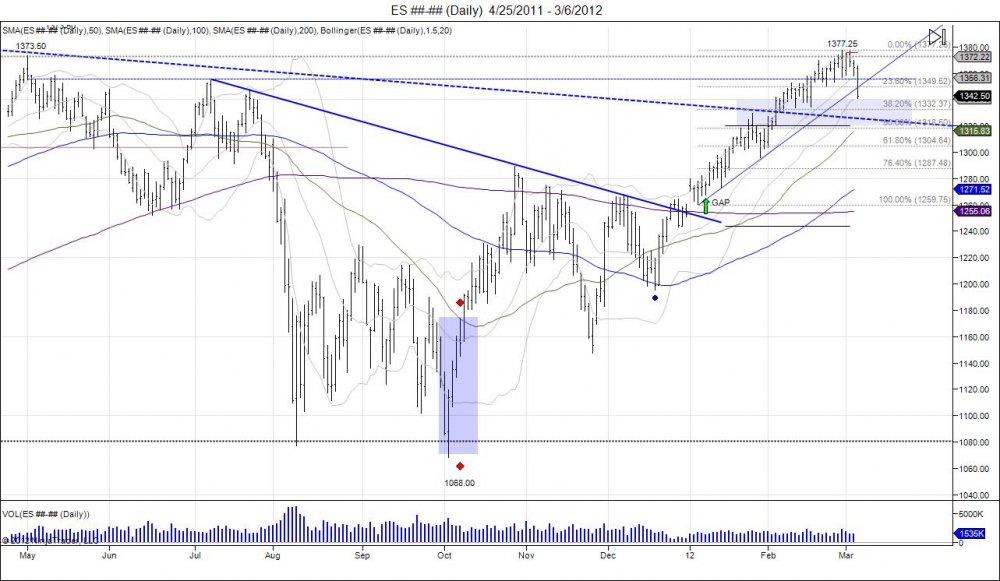
After starting the year with a gap, we moved from 1259.75 to highs of 1377.25, completing the objective of taking out last years highs. The move has gone up in a fashion with failed breakdowns that were used to attract shorts for the upside fuel. Now that last years highs has been taken out, the market is beginning to correct and looking for downside support as profit taking is being seen and longs rush to the exits which is causing for a chase to the downside. Today the market fell into the top of it's support zone being the 1340-1320 range. The 1334.25 is the next major low to breach for stops being the lows from February 16th prior as the market reversed on that day. The market retraces 38.2% of the years move at 1332.37 followed by 50% at 1318.50. This 50% retracement matches up with the range from January 30th being 1314.50-1296.00. This was the day the market retraced 50% of its 1259.75-1329.75 move before squeezing back through 1330. This 1314.50-1296.00 is a major level of support, matching up with the 50 day moving average for buyers to defend as a break below this derails momentum and gives room into the 76.4% retracement at 1287.48 followed by filling the gap from last year at 1252.50. Filling this gap derails the upside momentum putting sellers in control to look for Decembers lows to be retested. Upside resistance now comes in at 1355-1365. This range will have to be worked through to reclaim the 1377 high and move toward the top of the May 2008 highs at 1441.
1259.75-1377.25
23.60% 1349.52
38.20% 1332.37
50.00% 1318.50
61.80% 1304.64
76.40% 1287.48
100.00% 1259.75
Click image to maximize size

