click chart to maximize
more...
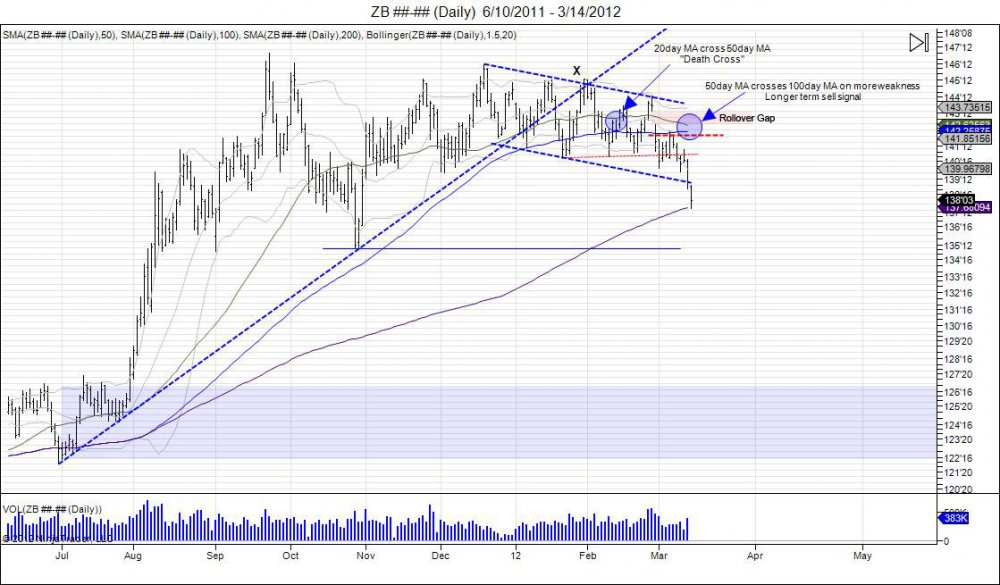
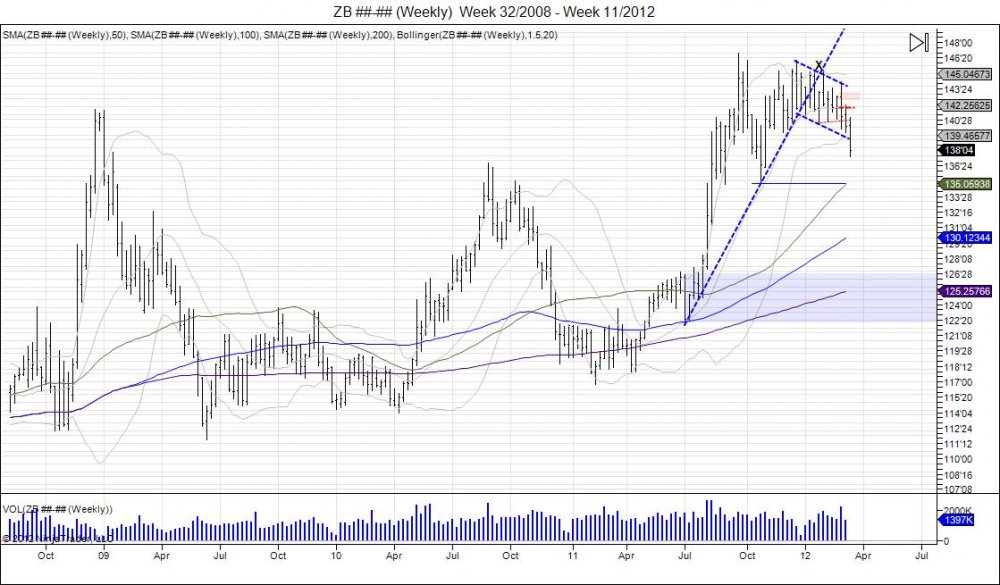
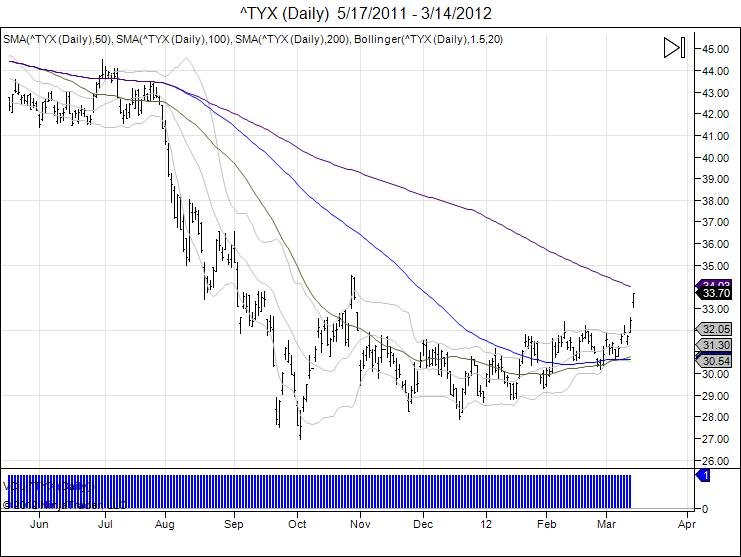
Since the “rollover gap” made with the March contract rolling into June, the bond market has fallen into taking out its year lows of 140’21. With this taking place, the next level was targeted, being the December lows of 139’24. This was breached on March 13, exactly one month following the 20day moving average crossing the 50day moving average in what is called a “cross of death”. The last time the bond market had this “cross of death” was in October of 2010. During this time the market was trading 131’** and eventually fell into lows of 116’26 by February of 2011. Here we are again and the market rallied from those lows into highs of 147’00 in September of 2011 with plenty of fed intervention and squeezing of the bears who came in late in 2011. The market has been in consolidation for the past 5 months, failing to take out these highs and began to slowly roll over in January as it broke its uptrend from the July-October lows. This led to another squeeze in late January that retested the highs and where two trend lines met, which became the “X marking the spot”. Once again the market failed this and we saw this slow roll over lower, with smart money slowly liquidating as bulls were slowly taken to the slaughter house. February 13th the 20/50 day cross occurred, and thus far we have seen the lows from December taken out, falling into lows of 137’19 as the retail chase is now beginning. With this breakdown accelerating, the 50day moving average is now looking to cross the 100day moving average to give a longer term sell signal. This is leading to this chase as the market is now fallen into the 200day moving average on the daily chart to test support and squeeze longs. This gives opportunity for shorts who sold the past months to take money off the table and leave remainders in cruise control. As this cross occurs, sellers just coming in should look out for a potential bounce to squeeze out the late comers. The downside now looks to target its next major support level being at 13501, Septembers lows. A breach of this level confirms the bond bubble has busted. To completely retrace the short squeeze the bond market had, the next major level comes in at 126’30 off July 2011’s 122’05 lows of where this breakout occurred which would put rates back at the 4.2% level. Upside resistance should now be met within 140’02-140’21 with a break through 144’14 needed for the bull to regain control. Ultimately this bond move is allowing for this money to flow into equities where the SP500 tries to complete it's upside target of 1441.
click chart to maximize
30 Year Yield:
click chart to maximize
Stay on top of these market developments subscribe to daily newsletter to be ahead of the street and taking profits as the street chases.

