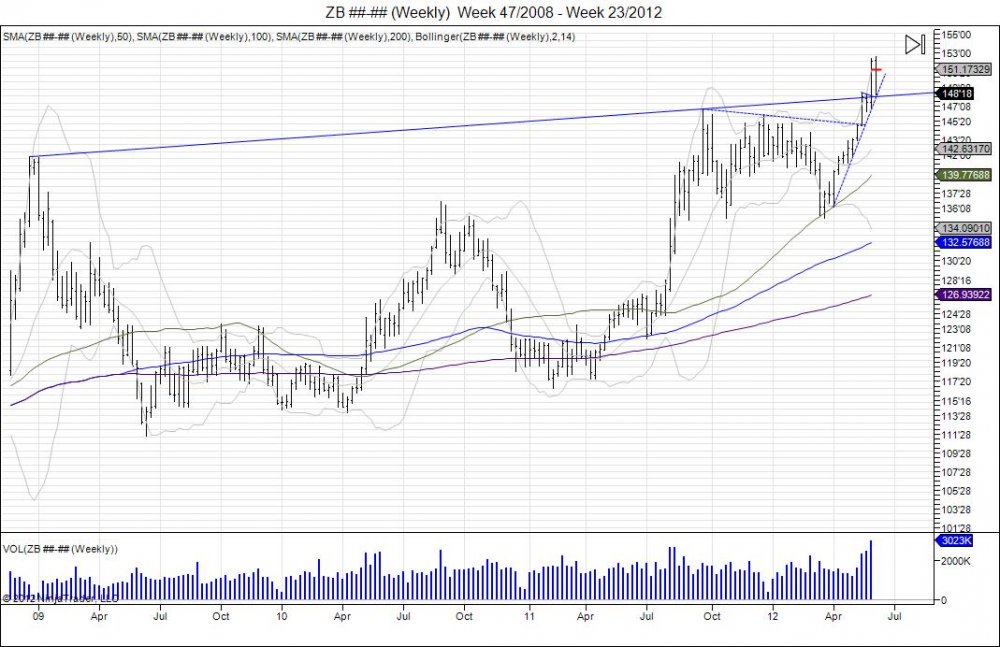
Following the squeeze above its weekly resistance dating back from the 2009 highs, the market rallied to 15219 before reversing back to this trendline the market squeezed above. Failure to hold this level turns this move higher into a failed breakout. Resistance comes in up to 15106 where sellers can look to defend these most recent highs with support at 14818-14622, 14508, 13804-13505.
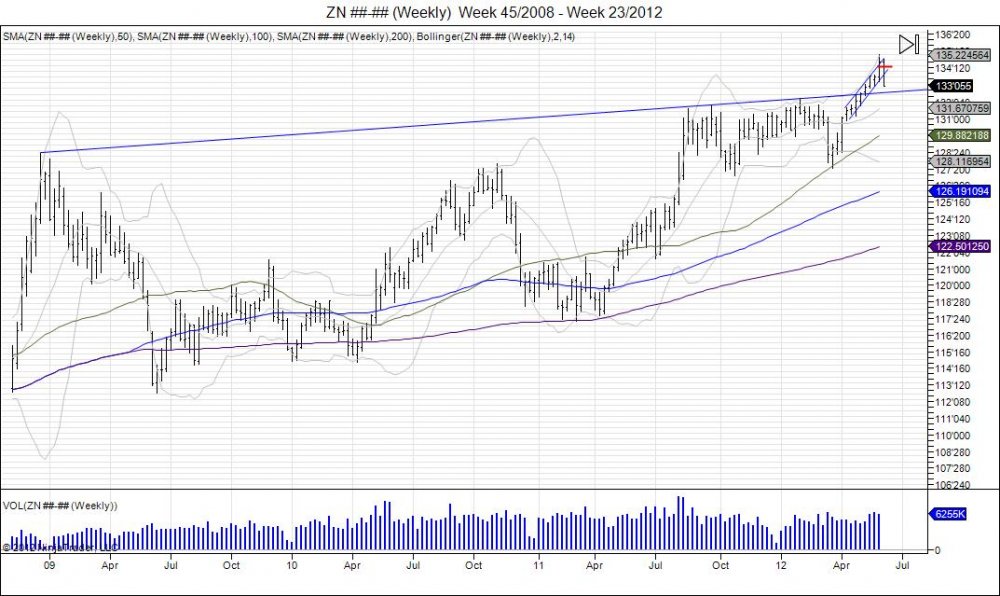
The 10 year has reversed off its highs of 135085 and taken out the lows from this high at 133155. In turn this has broken the rising channel the market has seen from early April. A weekly close below 133155 is bearish and turns the level to resistance which gives potential for this latest squeeze to 135085 to become a failed breakout. Support is seen at this resistance trendline from highs dating back in 2008 within 13217-13106, followed by next major support at 129095-127230 from where this market pivoted higher in March.
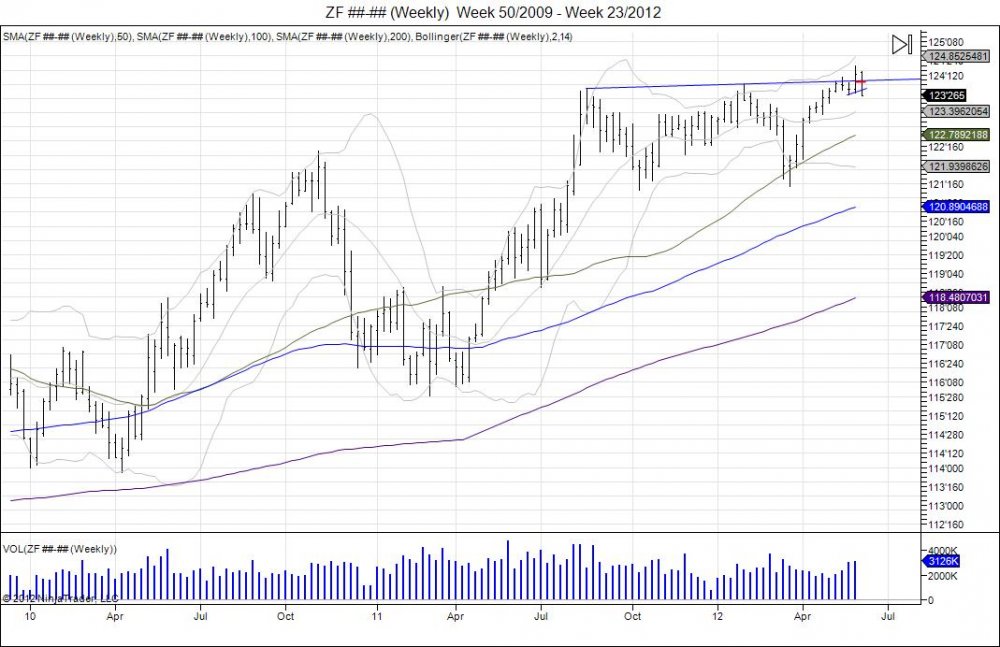
Same scenario in the 5 year, a break through resistance from the August 2011-February 2012 highs and a reversal lower to take out the weekly lows off this breakout. A close below this weekly low of 123285 is bearish and should be used as resistance for sellers looking to defend this breakout. This turns this breakout into a failed one, with next major support at 123195-123102 followed by 122080-121135 from the March pivot.
Treasury Charts
Become a member for LIVE swing/day trades with stop/target levels and updates via email and IM.


