They say history repeats itself, and the recent action in the market may prove that to be true. Though we will never see the exact same thing repeated, and as we know, past performance is not indicative of future results, what we do know is that human psychology is the same. That psychology is what produces these patterns that is seen in the charts, whether its greed, or fear.
Remember last year we came off a big rally from the prior year (2019). January and February of 2020 continued onto the rally, luring in late buyers only to trap them as the market reversed its bull bias and used trapped longs to expand the market lower as they were forced into liquidating. This can be seen here as we warned: http://www.chicagostocktrading.com/blog/sp500-6-month-volatility-window-update.html and http://www.chicagostocktrading.com/blog/sp500-6-month-vol-window-catches-late-buyers-again.html.
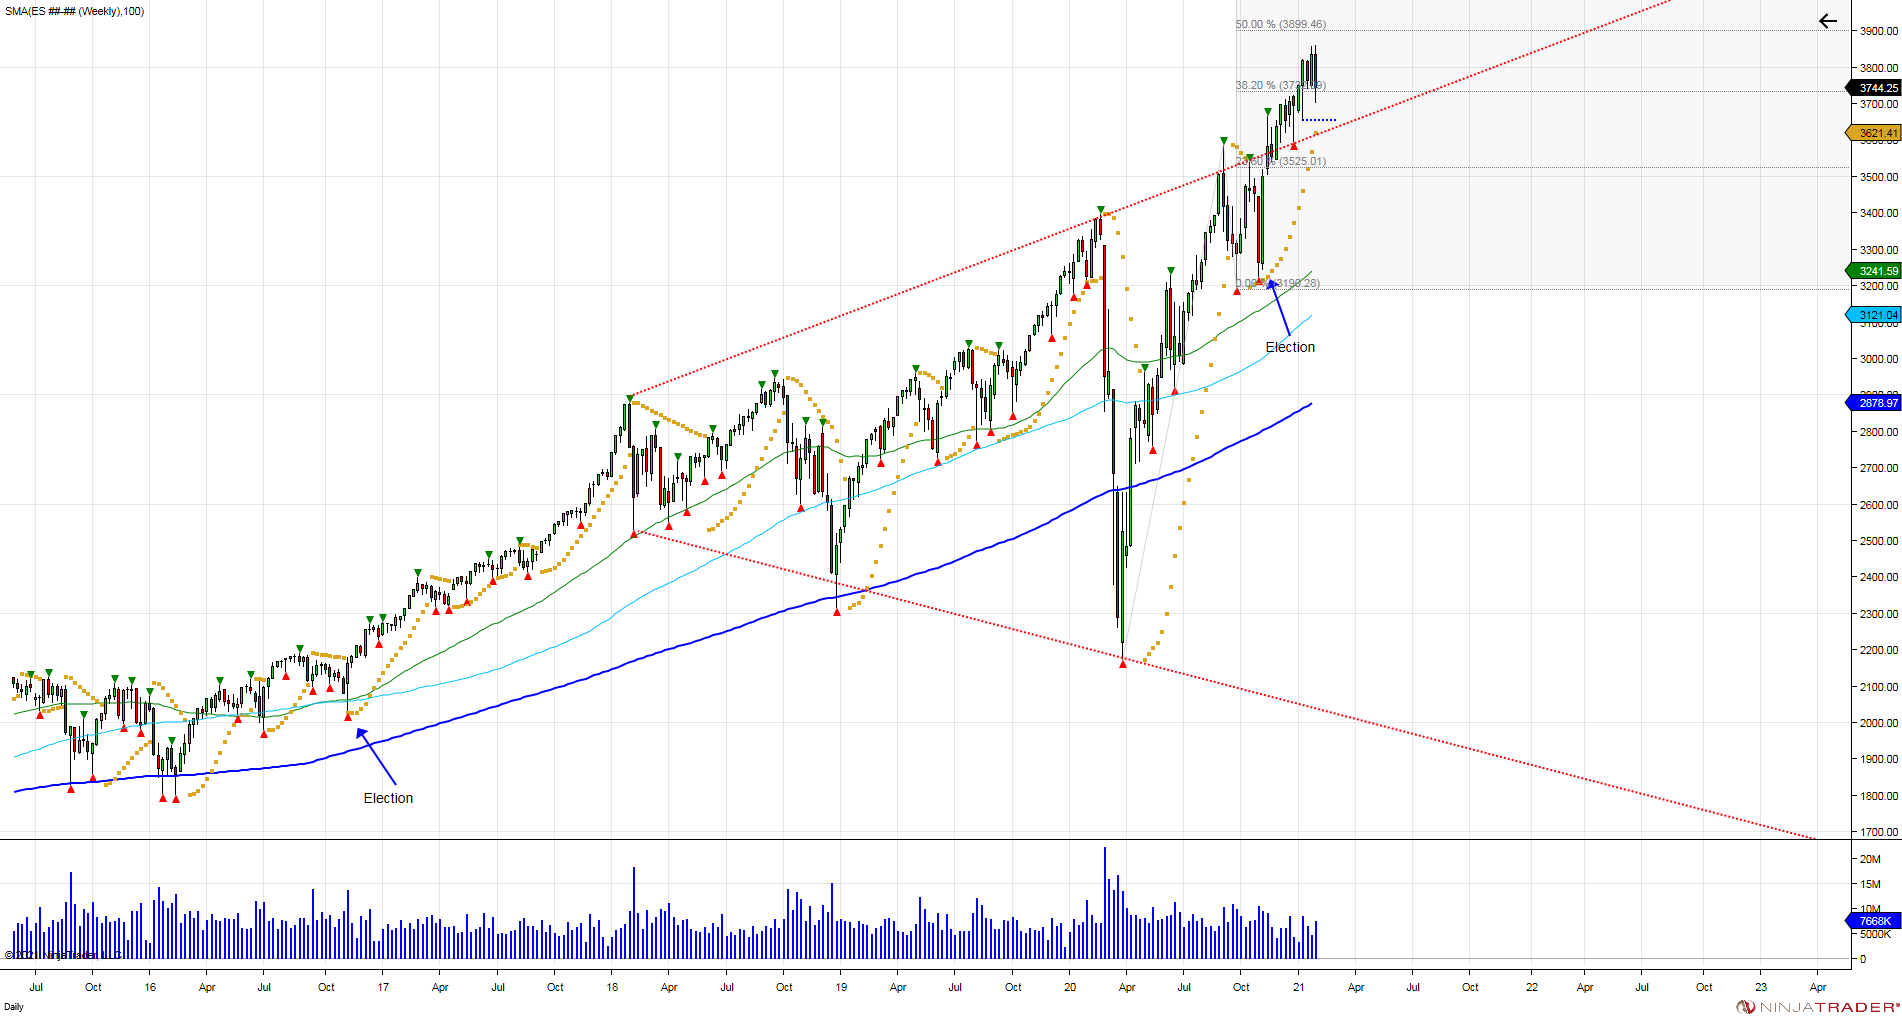
After correcting in the first half of 2020, the market bounced back into the 2nd half of the year. The start of the second half of the year started with the market breaking higher, establishing a bullish 6 month bias that held 3300 and expanded higher into the end of the year. The resolution of the election was followed with vaccine news on the 9th of November, which triggered a squeeze through 3600. Since this news, buyers were forced to chase as the market grinded higher into the close of 2020 with little pullback to allow buyers an opportunity to defend the election breakout.
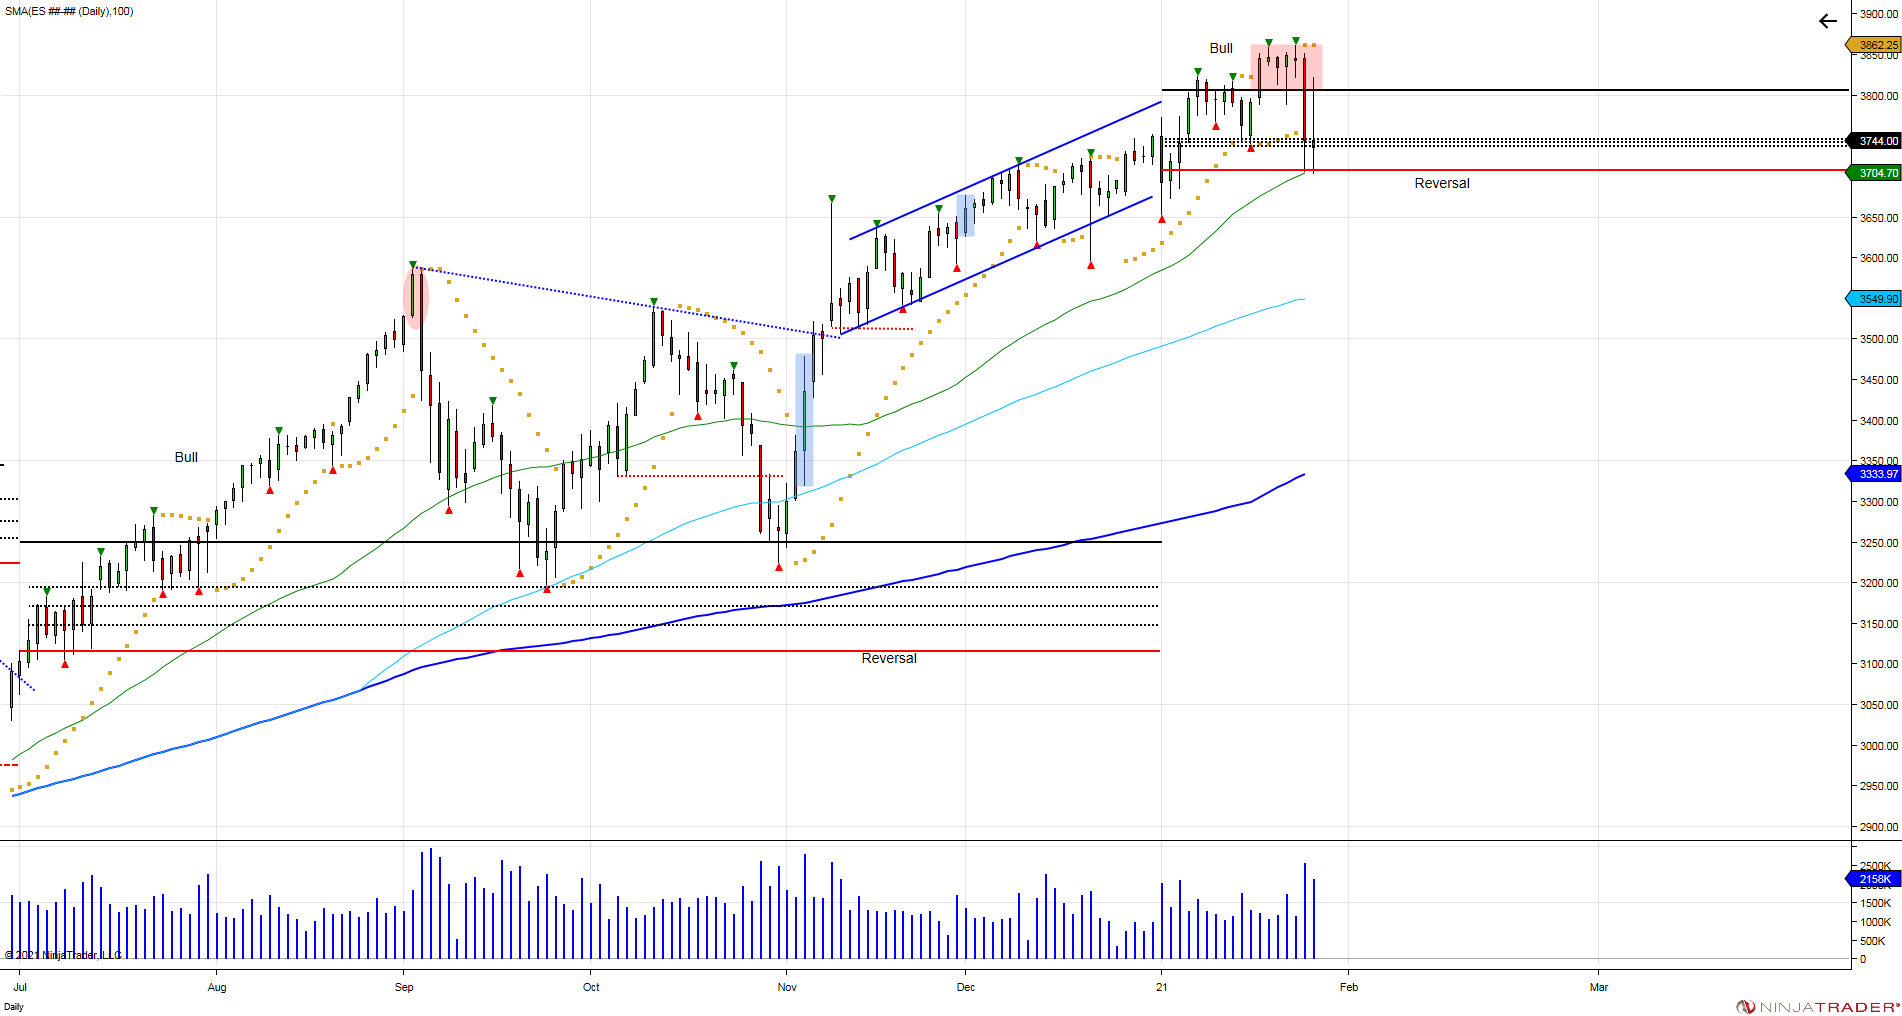
This year, started with a continuation of last year's rally. The market began the year with the first trading day dipping down to 3652 before turning higher to consolidate at the highs as the 2 week opening range in January was defined. The 2 week opening range is what creates the 6 month volatility windows. After completing the opening range, the rally continued with the market breaking through its upper vol window, holding above for half of the opening range (5days), which establishes a bullish bias. By establishing a bullish bias, buyers, or one can say late buyers are lured in, and are now forced to defend pullbacks to prevent a reversal from taking place. The market could not wait a day longer as just as it held above the upper vol window for 5 days to establish a bullish bias, the next day on January 27th the market fell below the window of 3806, leaving longs on the hook above and falling down into the reversal window of 3708. The test of the reversal window forced buyers to step up to prevent a reversal, seeing a defensive bounce into retesting the upper vol window at 3800 on the 28th of January. Buyers must overcome this window to recover trapped buyers above to allow opportunity in expanding the market higher. However, failure to do so, leaves buyers caught above. As we test the reversal window, 5 daily closes below are needed to reverse the 6 month bull bias, which would mean buyers on the year are caught on the wrong side, and can potentially be used to fuel and expand the market lower. Should this take place, key support is seen down to 3380 to retest the election low of 3319 that was never tested. This would allow buyers an opportunity to defend the breakout and into a healthy correction.
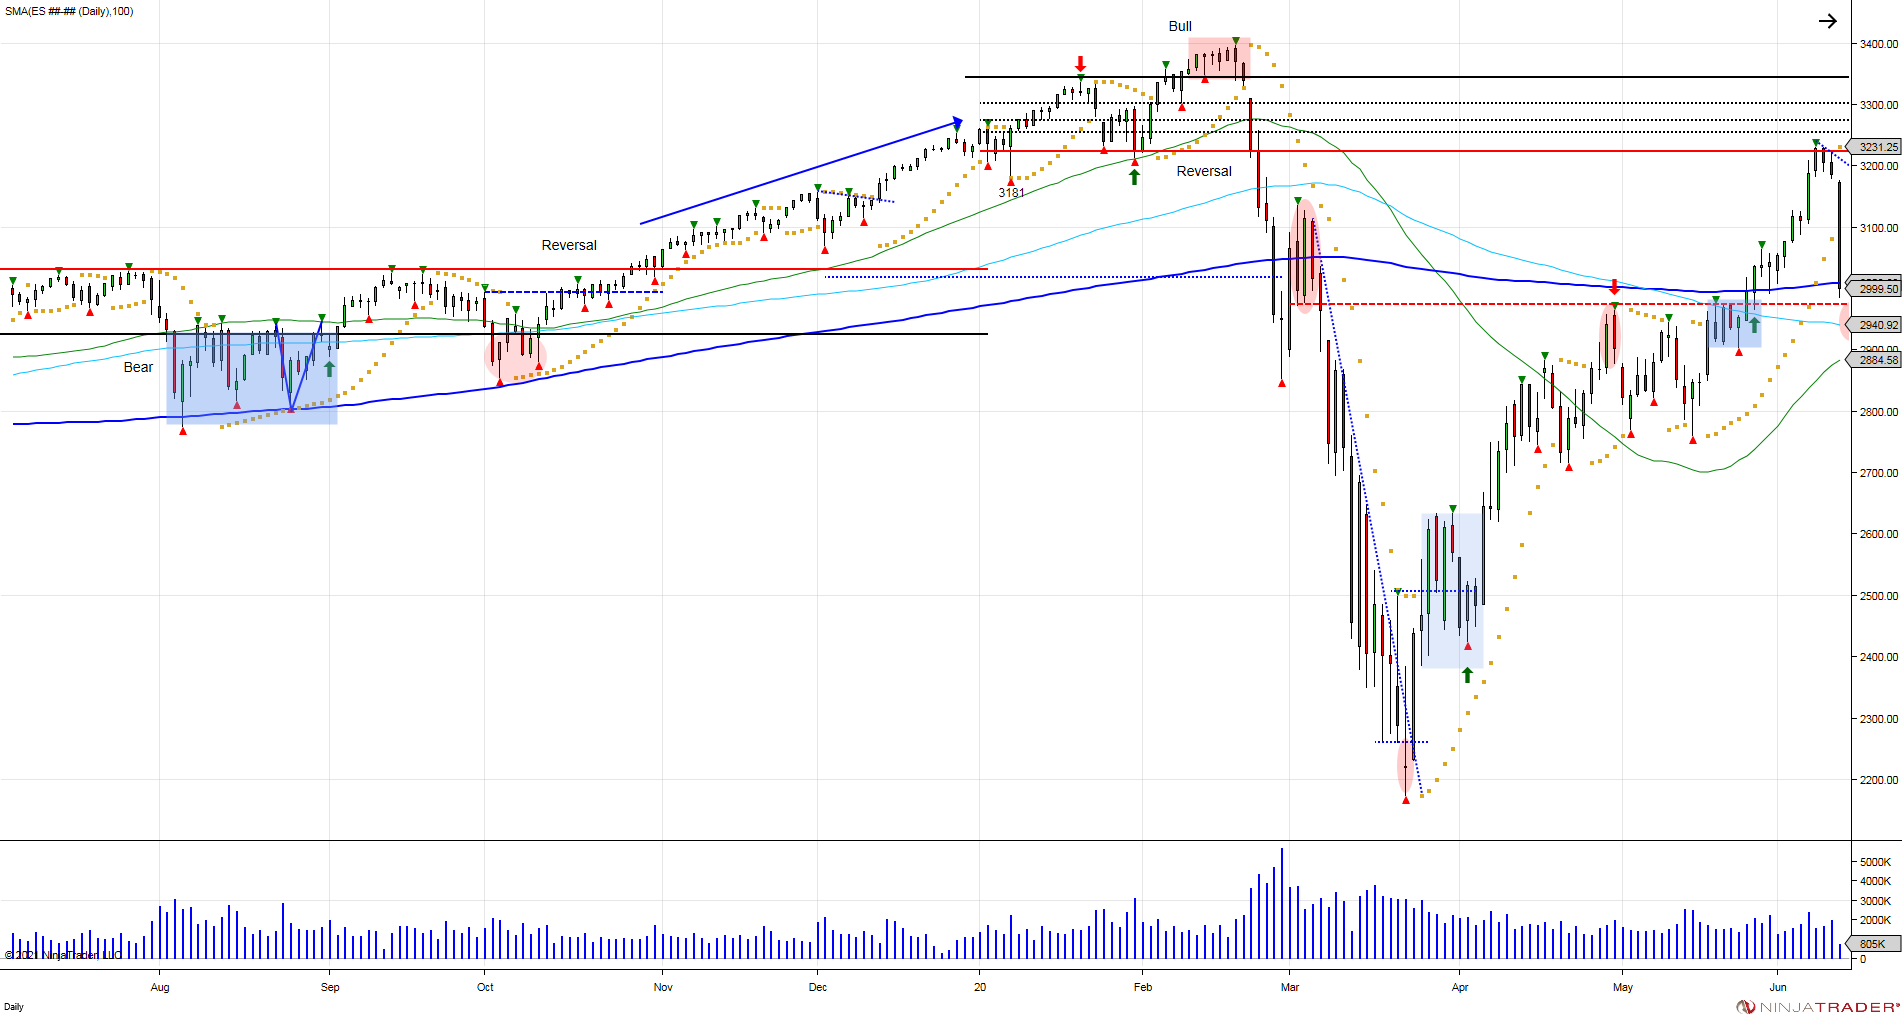
Below is the chart from the first half of 2020. notice the similar ramp in November-December leading up to the new year. The new year beginning with a break of the upper vol window that lured in buyers, only to trap buyers and use them to expand the market lower. Just as shorts were trapped in August of 2019 that were used to fuel the market higher as they failed to expand lower.
As individual stock names that are highly shorted are being targeted for squeezes, this is the same thing that happens on the daily, weekly, and monthly basis in the stock market. The way the market moves is by catching positions on the wrong side, and when they can't retain control and expand the market in their direction, as market moves away from them, they're forced to cover positions, which adds fuel in the opposite direction. If your a day trader, you see this everyday with the way algos trigger stops, lure in shorts/longs and move the opposite way. Just as it does so in the bigger picture as shown above.
Currently, it is buyers that have been forced into the market this month that are on the hook. Buyers must defend pullbacks to maintain control. One can make excuses for why or how the market moves, however at the end of the day, it's about supply/demand. If there is more supply caught above then demand, you have overhead resistance and weight on the market where that supply is forced to liquidate, moving the market in the opposite direction. As always, time will tell and the X factor is the velocity of a move.