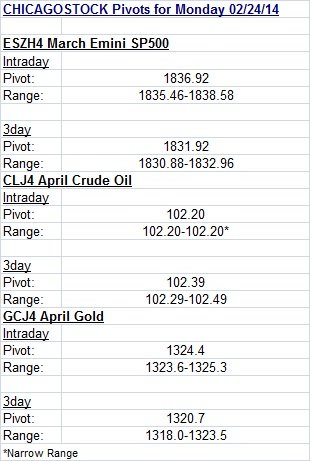
Pivots are used to determine areas of reference for support/resistance. Pivots are calculated by adding the high, low, and close of the determined time period, and subtracting by 3. This gives a "mean" of the market from that past data. Pivots themselves are not always enough. By adding ranges to the pivot (above and below), this gives an area of cushion around the pivot. The tighter the range, the more indecisive the previous data was, giving room for expansion of volatility. In the above examples, the intraday pivots are derived from the previous day's session. The three day pivots are derived from the last 3 trading sessions.
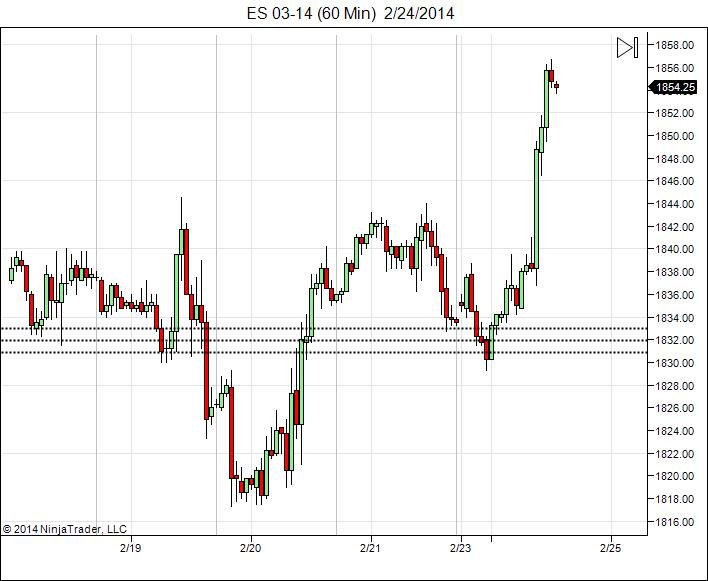
Three day pivots are added to longer time frames such as 30-90 minute. Since the 3 day pivots have a longer time period, they have more weight then the intraday pivots. Three day pivots show rolling support/resistance level. If the trend is higher, 3 day pivot ranges offer support and the pressure is higher, vice versa if trend is lower, pivots offer resistance. In the example above, the market pulled into testing the 3 day pivot range overnight before turning higher into the intraday pivots.
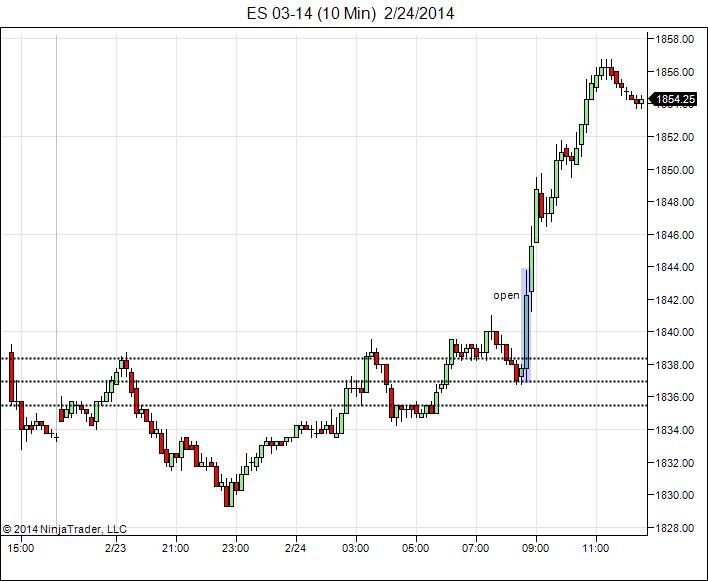
Intraday pivots are added to intraday charts such as 5-15 minutes. This identifies resistance/support levels for the day. In the above examples, after initially failing to move past the intraday pivot, the market fell overnight into the 3 day pivot range where support was found. The bounce led to a retest of the intraday pivot that at first saw a small pullback, before reclaiming above to turn the pivots into support going into the open.
Pivots are another tool in the trader's tool box and not a signal in themselves.
RISK DISCLOSURE: PAST PERFORMANCE IS NOT INDICATIVE OF FUTURE RESULTS. THE RISK OF LOSS IN TRADING FUTURES AND OPTIONS IS SUBSTANTIAL AND SUCH INVESTING IS NOT SUITABLE FOR ALL INVESTORS. AN INVESTOR COULD LOSE MORE THAN THE INITIAL INVESTMENT.

