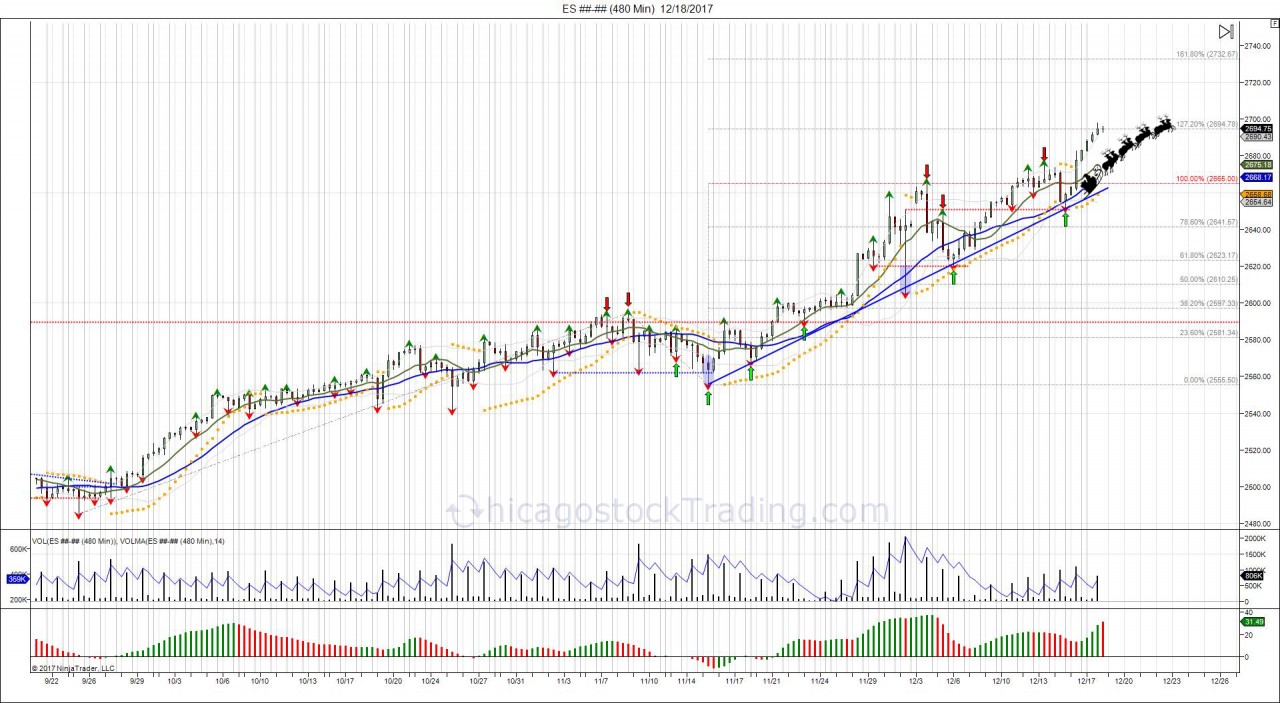
Santa Claus came a week early to Wall Street with the SP500 breaking through 2665 on Friday. As seen in the above chart, since the September low of 2485, the market expanded its rally into the November high of 2594 by 100% as it ran into 2665 earlier this month. There was an initial break off the level that caused the market to fall into 2605 which was fueled by "fake news". The market recovered off this low to make another run at 2665, before pulling into test 2620 as the November 29th low prior to seeing the break down to 2605. This level held, trapping shorts below as buyers marched back to press against 2665. The breakout seen this past Friday through 2665 has the market testing its 127.2% fib at 2694, with the 161.8% extension seen at 2732. Last week's 265175 low is now key for any downside shakeout/reversal.
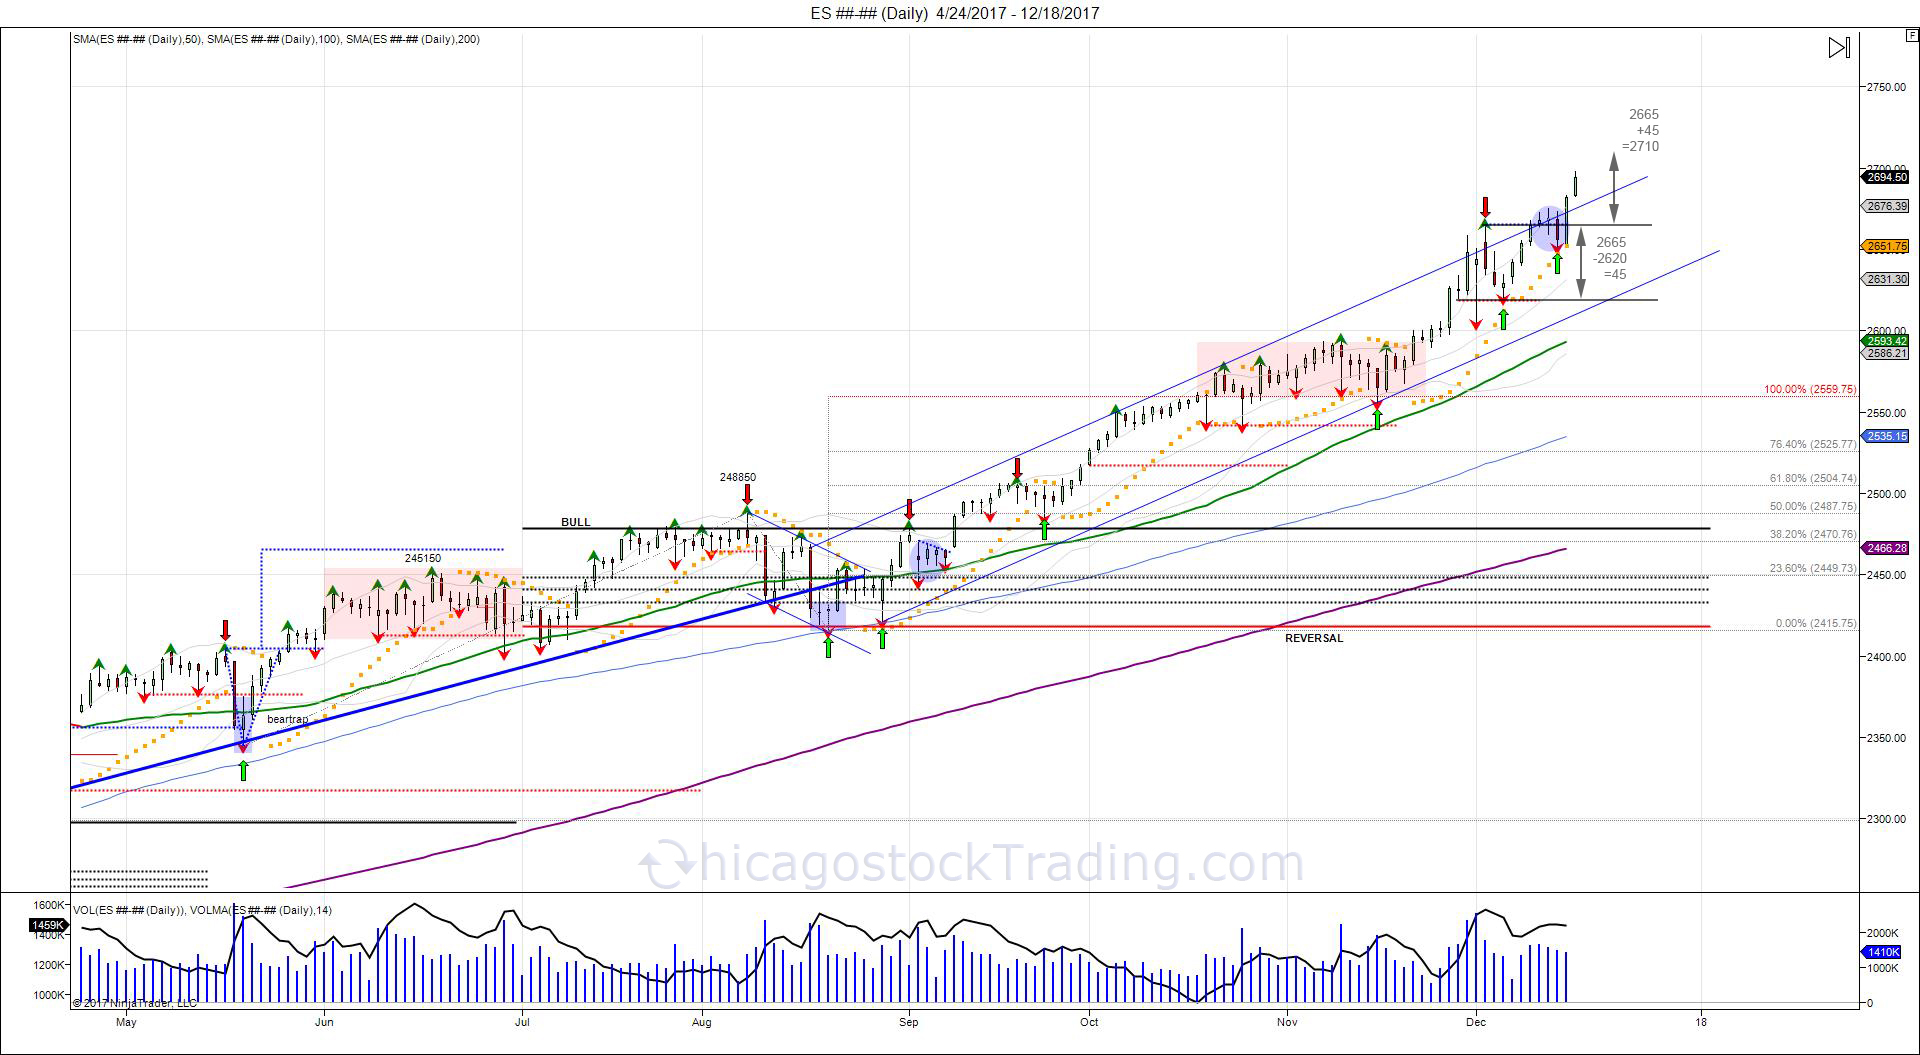
Looking at the daily chart above, we can see the previous range of 2620-2665 taken out on Friday with Thursday's failed break at 265175 and Friday's recovery to close above the prior high of 267550. The breakout, gives room to expand that range of 2665-2620 up to 2710. Pullbacks into 2675 provides new support for buyers to defend, with stops under last week's low of 265175 to shakeout longs and attempt another shot at 2620. Recall 2620 was the inverted head/shoulder target from Thanksgiving. With the breakout over 2620, volatility has picked up with buyers chasing above and shorts capitulating. This expands the "bullish bias" that was created in September, with the breakout over the 6 month volatility window of 2478 as late buyers rush into the market before the year end.
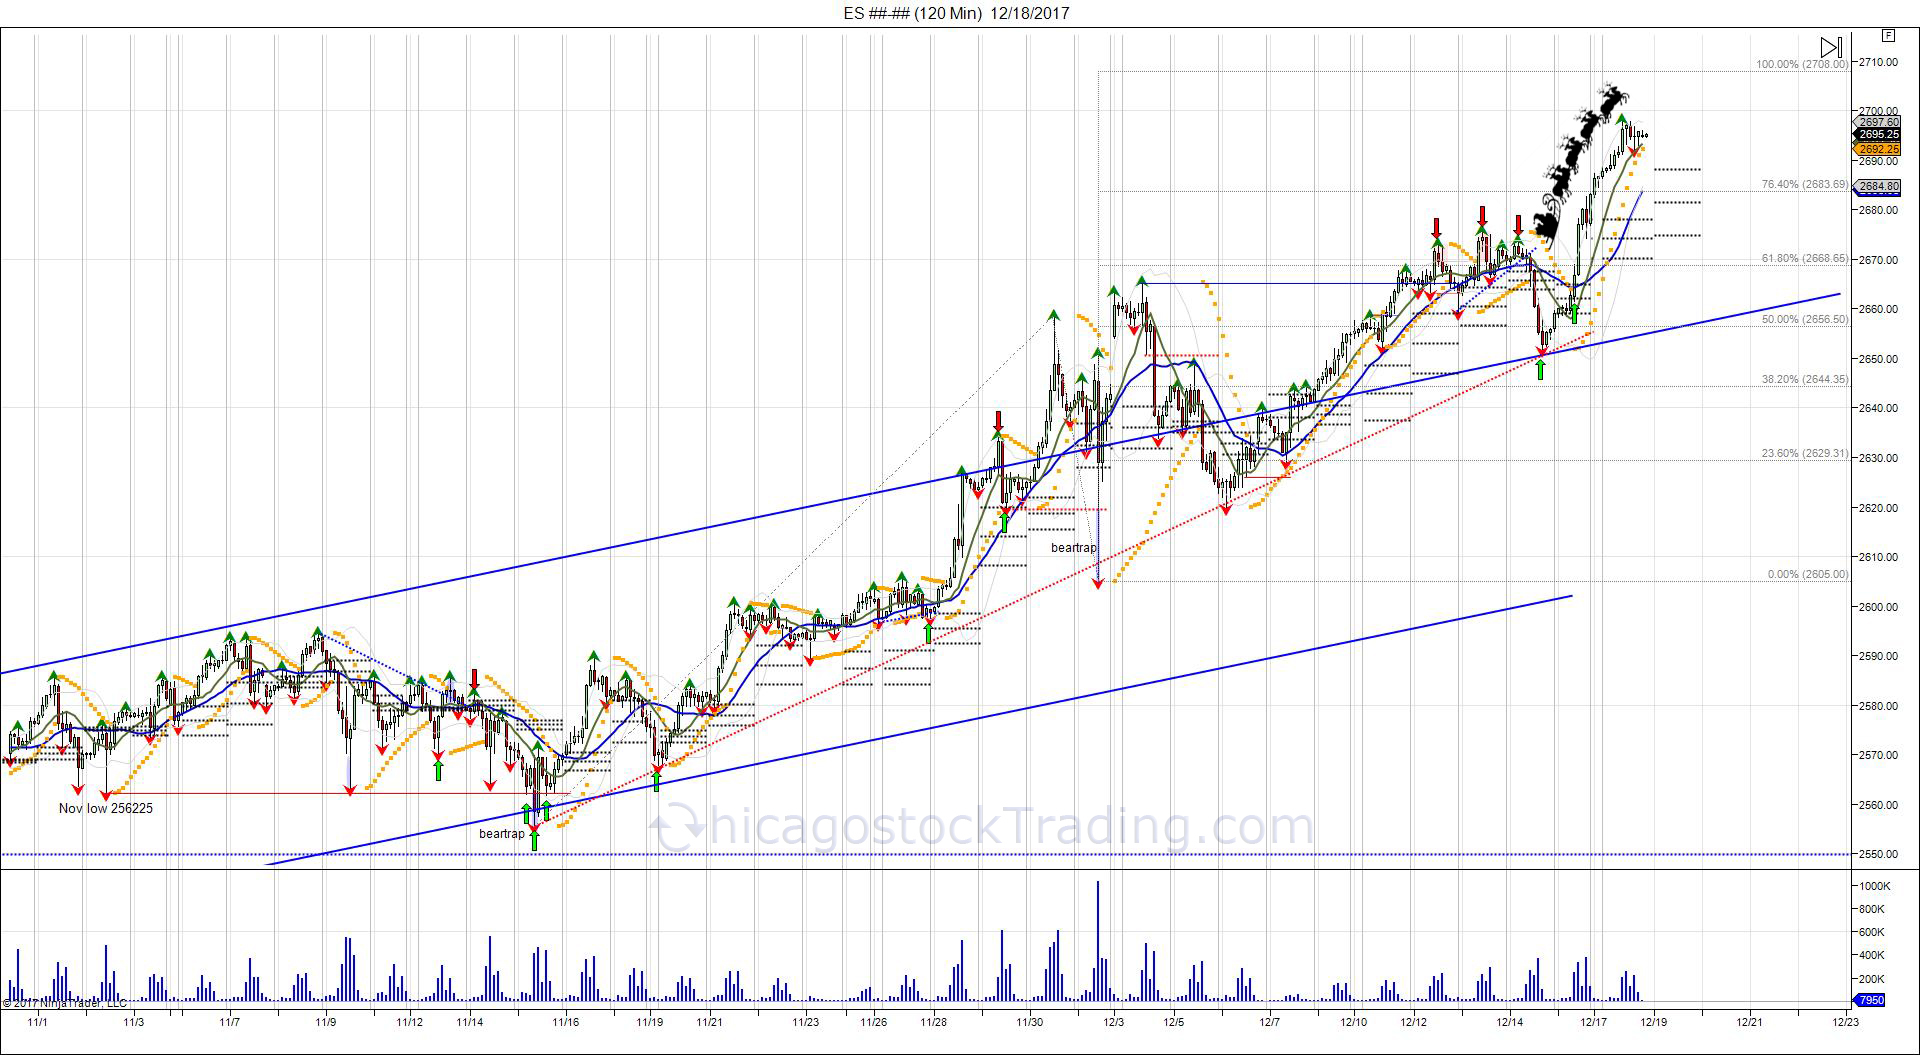
The market as it appears above, has come a long way since the failed breakout seen right before Thanksgiving as the market made new lows for November, before turning back above to trap shorts and create an inverted head/shoulder bottom. Again the chart also shows how the swings became more violent with the market reaching its 2620 objective, and trading through to hit 2665 as the 100% fib extension on the 8 hour chart. On Friday the "Santa Claus" rally showed up as the market broke through 2665 to overcome its 3 day pivots, resuming the uptrend after seeing a minor topping attempt last week. The breakout has buyers chasing once again, giving way for a test of the 100% fib extension at 2708. Tuesday's 3day pivot range is within 2688-2675 as a range for buyers to defend any breaks into. In order to reverse momentum, a close below the 3day pivot range is needed.
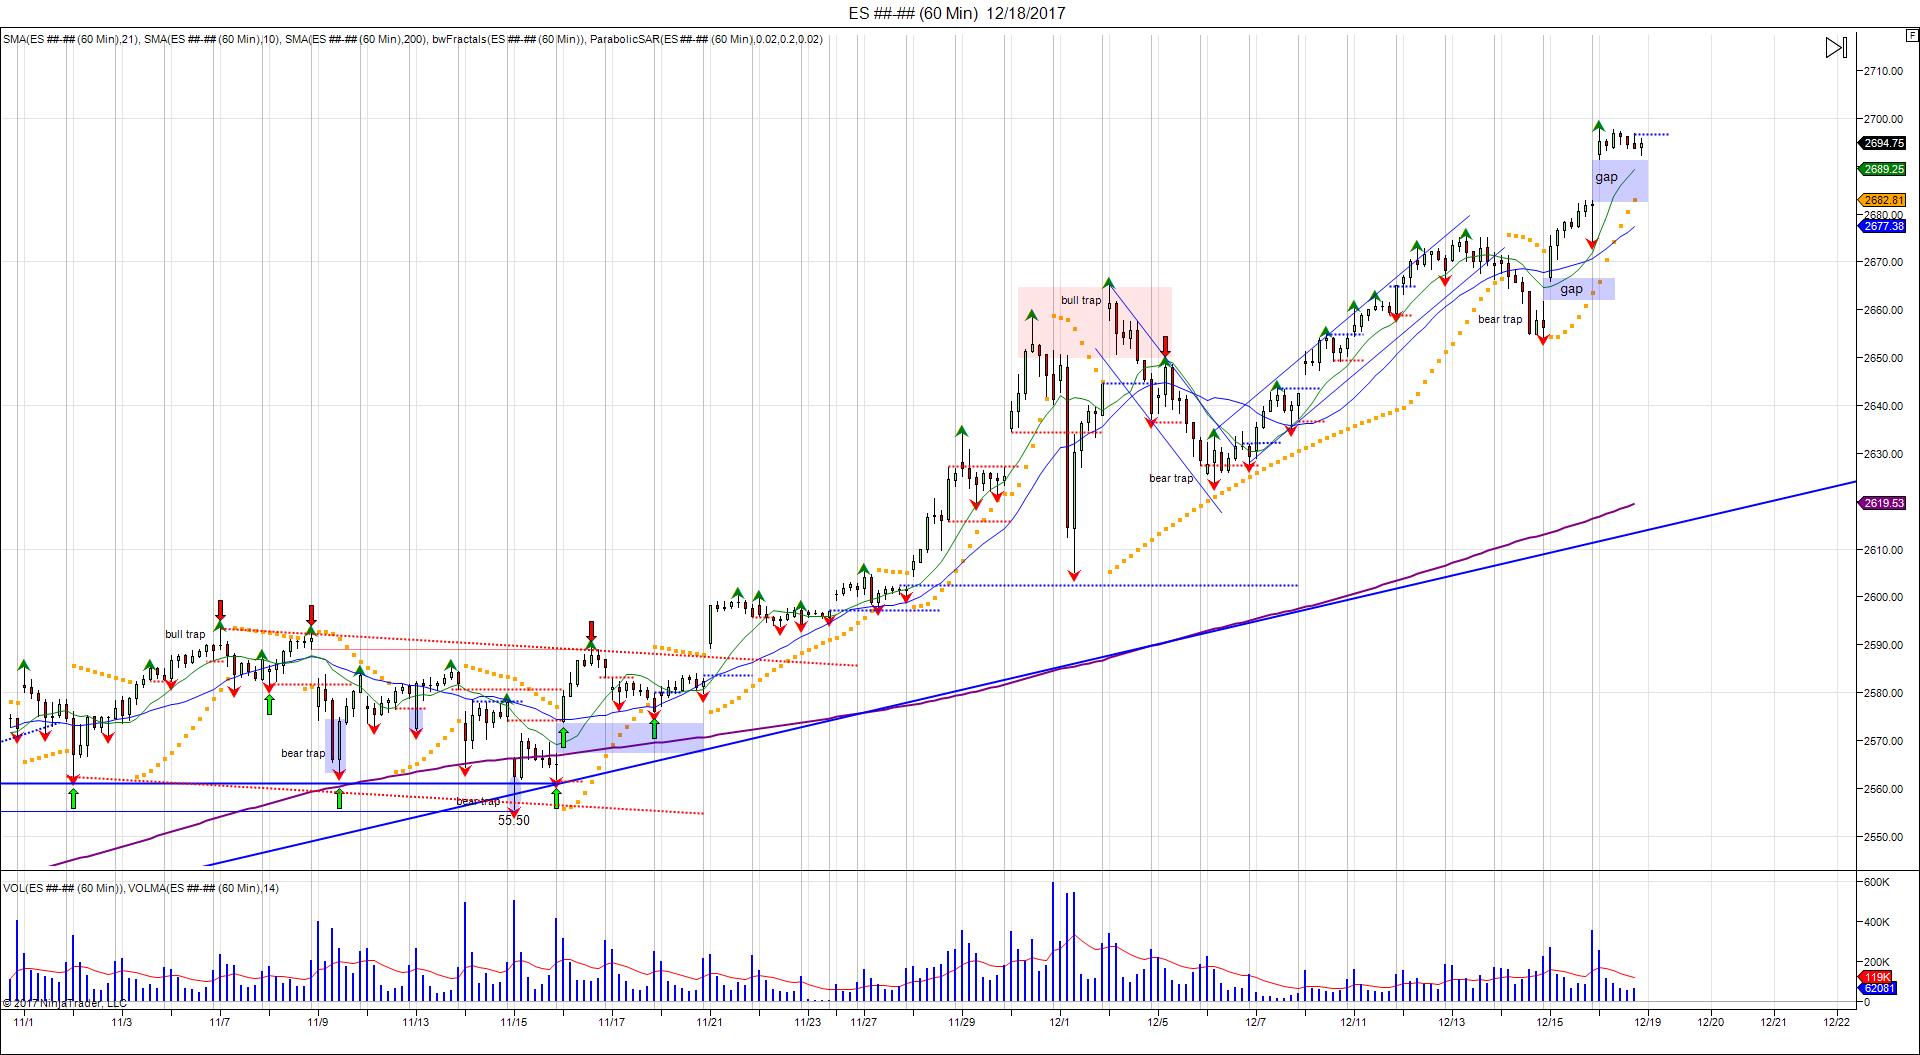
Cash market opening higher on Friday at 2666, trapping shorts from the prior close under 2660, fueling the breakout into new ATHs as buyers chased premium and shorts are being forced to cover. Monday saw another gap up, opening at 269250, +10 from Friday's 2682 settlement, once again the higher open forcing buyers to pay up and keeping shorts trapped, with the market trading in a very narrow range of 269150-269800. For Tuesday, cash open above 2696 creates another gap up, keeping bulls in control and forcing shorts to squeeze. Cash open below 2691 is needed to attempt a gap fill down to 2682 to retest Friday's settlement.

