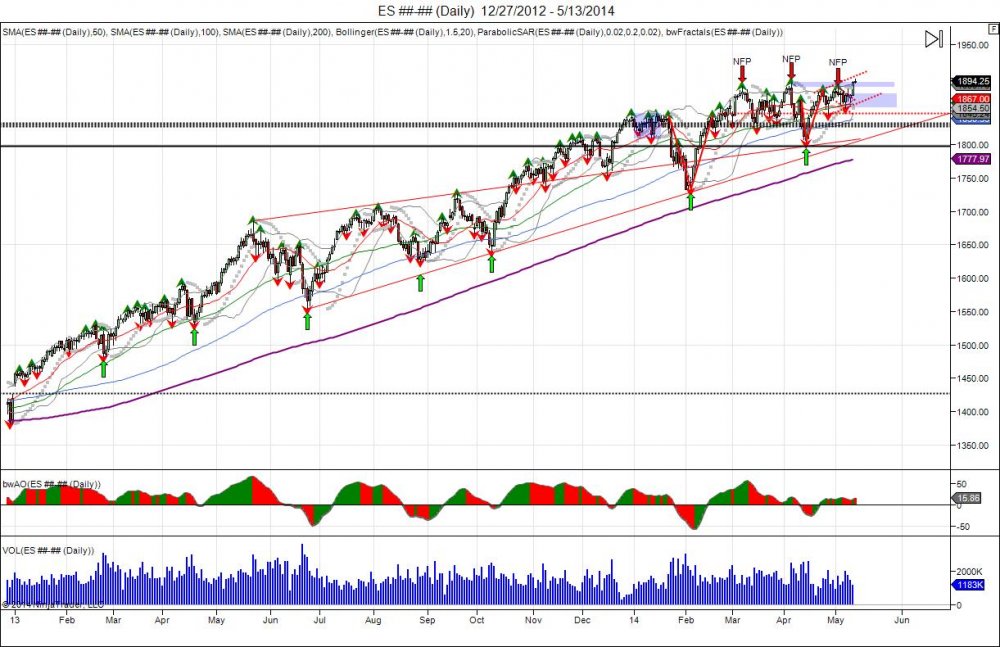
Notice long term 2013 trend from the breakout gap and go above 1440 to start the year see a setup of higher lows strongly defended. Early 2014 low held right against this trendline to put in another higher low and see new highs made. Latest higher low comes in at the April lows of 1803. Uptrend line caught up to the market forcing buyers to defend even as market has gone into sideways distribution. The sideways consolidation has been a fight to hold the uptrend. Latest bounce coming from the April low and break out above recent 3 month range is looking for capitulation of shorts and new longs to be forced above new highs. The April low is now a major pivot level as a breach below breaks reveres the uptrend of higher lows.
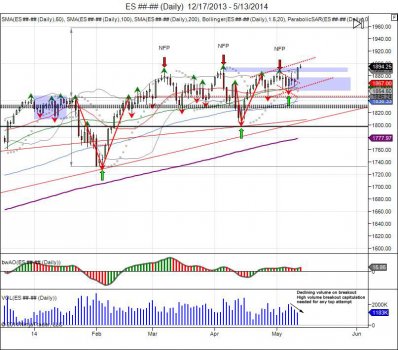
Looking at daily chart, we see the start of the year begin with 2 week of sideways consolidation before liquidation to see market fall into 1732, only to put in a V bottom and continue longer term trend of higher lows. Move above 1847 squeezed out the short side and has given way to the last 3 months of sideways consolidation as market has held above the V reversal forcing shorts to cover and look for new buyers. The last 2 peak highs were made on jobs numbers, seeing profits taken into the new highs made and giving way for retracements. Latest NFP report failed to make a new peak high, falling short at 1886 as this was rejected last Friday at 188475. With the cash market opening at 1882 on Monday, this has put pressure on shorts and forcing a squeeze to take out the failed 1886 May high, in turn reversing market squeezing shorts and fueling the move above the April highs and into 189850. So long as the gap from Monday stays open, it gives a “gap and go” effect, by not allowing shorts to cover at lower prices, forcing them cover and be squeezed, in turn, forcing new buyers chase into the market's "breakout". This will happen if the market can sustain above the May highs of 1886. Giving way to expand the V reversal done earlier this year within 1844-1732 (112), up to 1956 (1844+112) to complete the objective. With only a month and a half before starting the second half of the year, shorts from the first half are starting to be forced out. 2014's started with 2 weeks of sideways chop before setting the bear trap and creating a V bottom to squeeze them out, the market has turned its 6 month pivots into support. With lateast breakout this gives way for remaining shorts to capitulate and see upward expansion into July. Failure to hold the May lows, 185450, gives way for a reversal as it shakes out longs and gives way to retest the April lows. A reversal of this sort would show a lack of shorts in the market and a majority already long, thus not seeing the squeeze and chase of new buyers.
RISK DISCLOSURE: PAST PERFORMANCE IS NOT INDICATIVE OF FUTURE RESULTS. THE RISK OF LOSS IN TRADING FUTURES AND OPTIONS IS SUBSTANTIAL AND SUCH INVESTING IS NOT SUITABLE FOR ALL INVESTORS. AN INVESTOR COULD LOSE MORE THAN THE INITIAL INVESTMENT.

