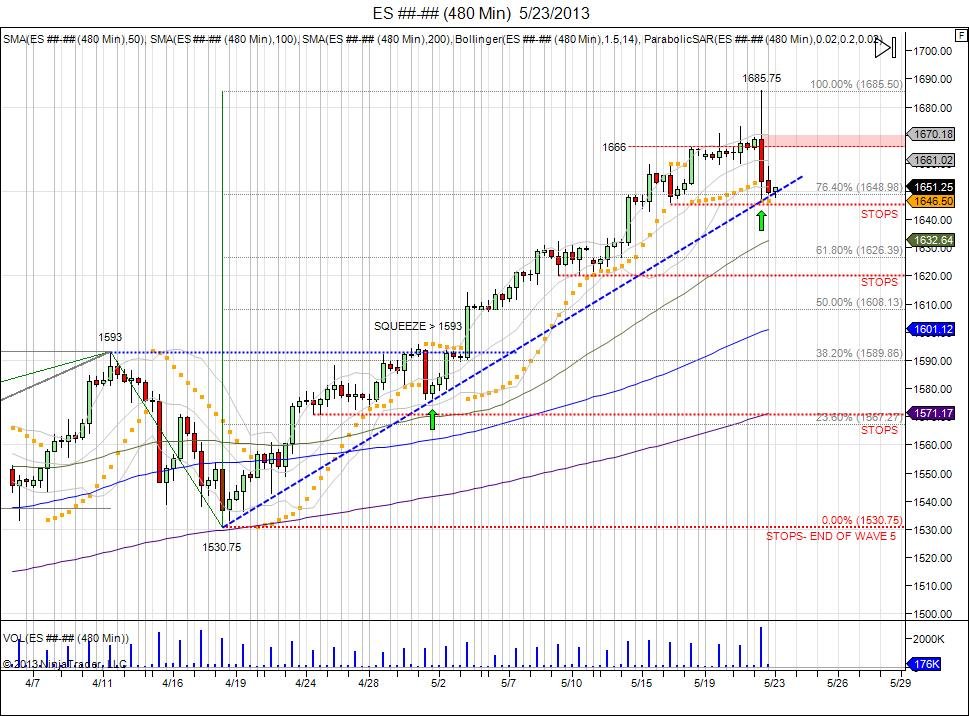
As soon as the SP500 hit its 100% Fib extension level of 1685.50, sell programs kicked in as the SP500 printed highs of 1685.75. The move occurred after a squeeze through previous highs of 1673, seeing shorts capitulate which gave way to the 1685 print. Smart longs sold into this bid to take profits. With longs taking profits, shorts already being stopped, the market fell down to retest its open. After trying to retest the highs and failing to find buyers at 1681, the market fell off to take out its session lows to reverse the intraday trend as more longs locked in profits and short sellers sat on the sidelines looking at the market drift lower. With shorts out the market, this created a chase to the downside into 164650 to retest the pivot low of 1646 made last Thursday prior to Friday's move into 1665.75. A 40 point rejection off the top level of 1685 and a press to test the downside resistance range at 1656 to see if that old resistance acts as new support for a retest of the mid level at 1666-1670. This has raised the stakes for bears as the range to defend has widened. Failure to hold 1646 sees more shorts left on the sidelines and a wider range (40) to defend the high. Market remains in its 5th wave that began on the breach of the old 1593 highs with a pivot low of 1530.75 occurring during the "4th" corrective wave. As market moved past 1593, buy side chased and shorts squeezed from the 1593-1530 giving way into 1656. Sell stops have built along this wave 1530-1685 below 1646, 1620, 1607, 1570.75, and ultimately the 1529.50 low from Cyprus. Wave 5 ends on a breach of that pivot low that began the wave at 1530.75. With that taking place, a confirmation will then be made that the move above 1593 was a failure and an "abc" corrective pattern can be seen should the market be able to bounce after breaking 1530 to retest the 1600 level and see if it can get back above.
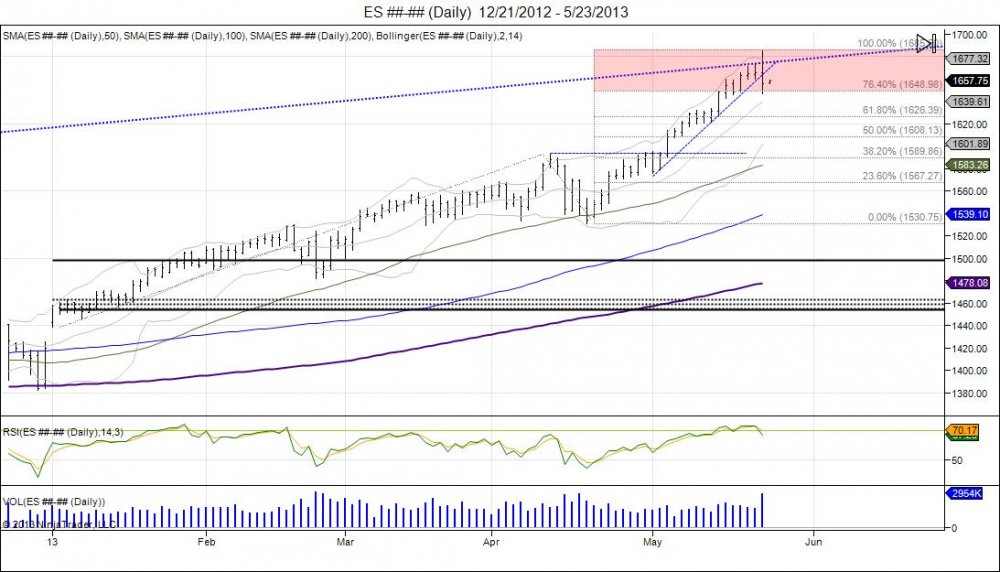
See: "SP500 Wave 5 How High Will It Go"
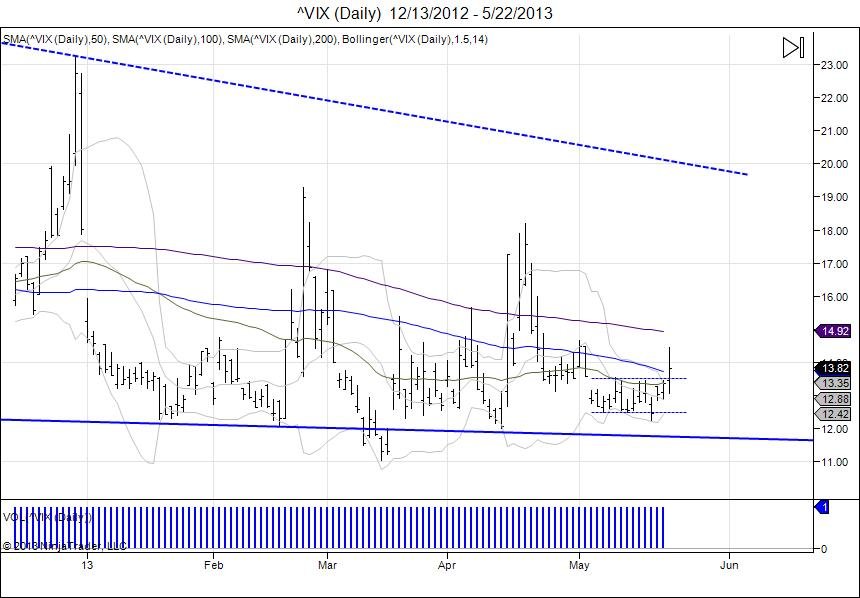
Volatility index chart above shows how it broke above its 2 week trading range in May, traidng above 14. Volatility consolidated it's 13 support as equities screamed new highs, making a tight range of in a 1353-1256. Volatility squeezed higher off 13 and outside of the range as equities reversed 40 handles off 1685. When volatility moves up, ofcourse put optiosn gain in value because volatility is increasing with fear, so "insurance" becomes more expensive. The vix will spike to 19 with the SP500 falling down to 1600. The speed of this will determine how fast the premium of puts gain in value. The vix inside its trading range was also a warning of this volatility that came today.
See: "Volatility Index 13 Level"
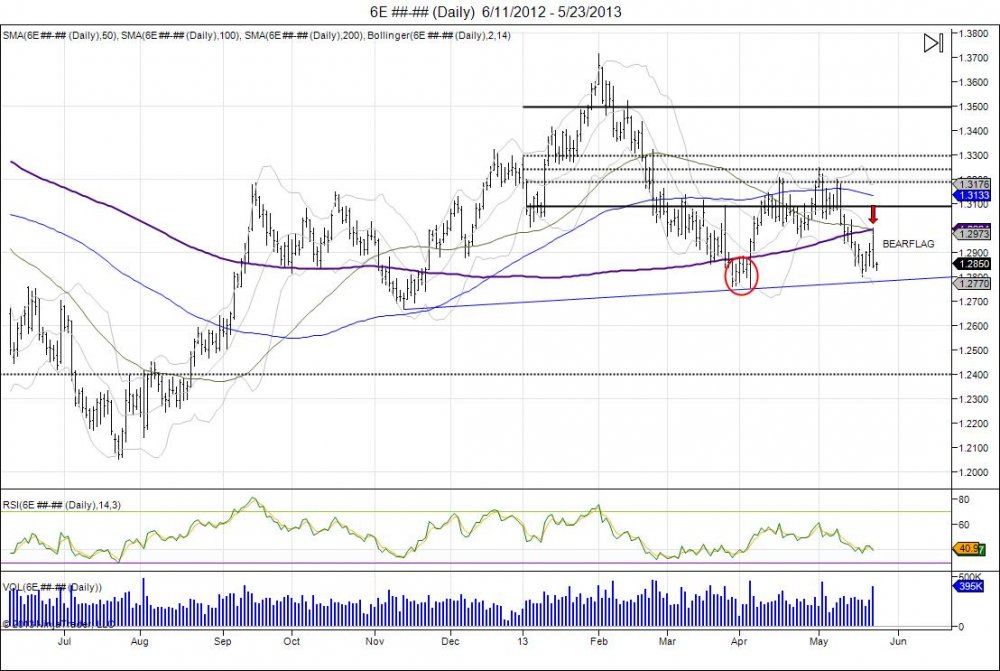
The one chart not many are paying attention to, Euro. The Euro broke below its 200day moving average late March and into April. This breakdown into a new year low of 12751 on April 4th, led to a sharp reversal off this low and through 129. This made the 1st attempted break of the 200day average as a failed breakdown and a head fake, keeping shorts below the average trapped as the market went after stops above the March highs. This led to the market hitting its 6 month pivot, with highs of 13248 on the 1st of May. The high was retested on the 8th at 13198 which saw a rejection, dropping the market back down. With this, the 200day average caught up to prices, making a tight range. With the market failing to hold the late April low of 12959, the market broke its 200day moving average. Since breaking this average, the market has closed below it 7 times. The 200day was tested on Wednesday as the market spiked into 130 and was quickly rejected. Making the 200day moving average, old support, act as new resistance. This should continue to weigh on the market to put pressure against April low of 12751. Break of this low confirms the bear in the Euro and gives room to retreat down to the 124 level which retests where the market broke out last August.
For presice trade levels, click to sign up.
RISK DISCLOSURE: PAST PERFORMANCE IS NOT INDICATIVE OF FUTURE RESULTS. THE RISK OF LOSS IN TRADING FUTURES AND OPTIONS IS SUBSTANTIAL AND SUCH INVESTING IS NOT SUITABLE FOR ALL INVESTORS. AN INVESTOR COULD LOSE MORE THAN THE INITIAL INVESTMENT.

