click chart to maximize
more...
The September 2011 gap breakout at 1105 and run into May 08 resistance at 1372.75 off 1441 highs:
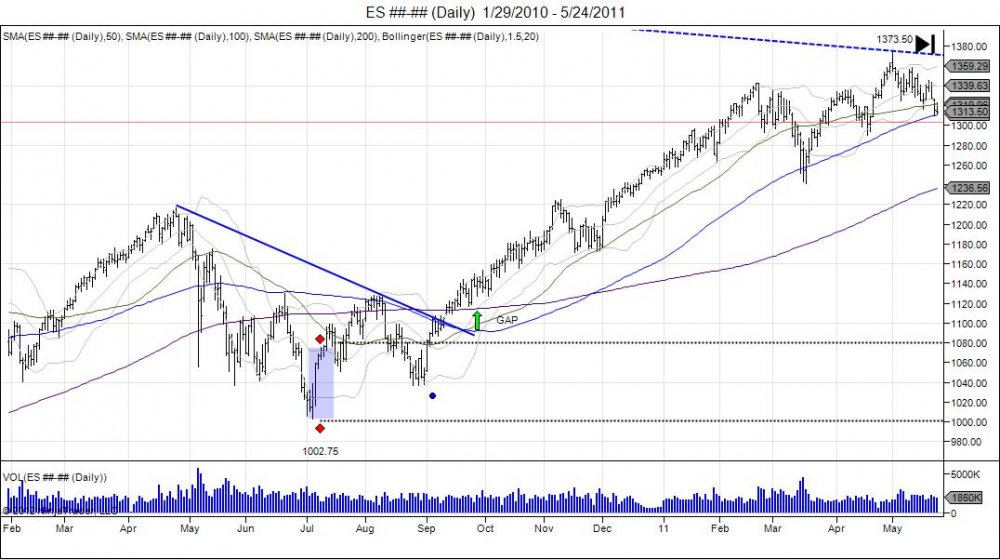
click chart to maximize
The January 2012 gap breakout at 1275 and run through May 08 resistance of 1372.75 in target of next resistance, May 08 highs 1441:
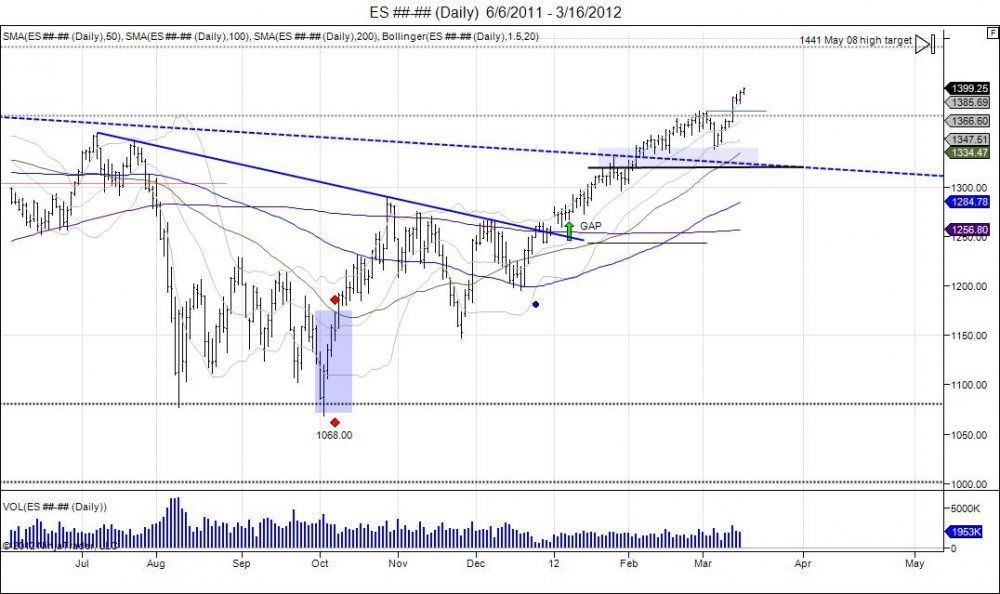
click chart to maximize

