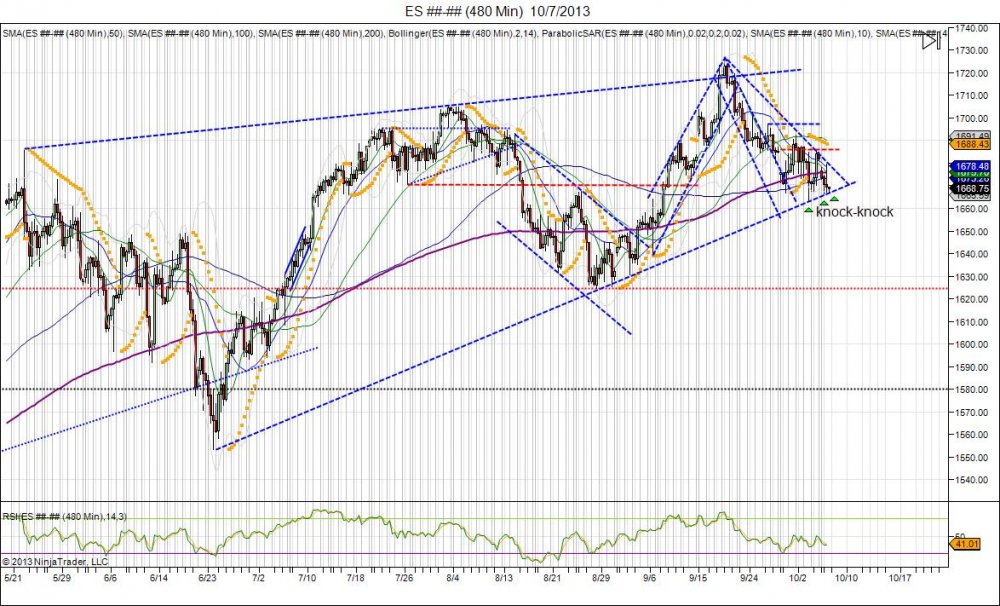
As seen in the above chart, since the biggest correction of the year - 1685-1553, the SP500 has made higher lows and higher highs. These higher lows have come as the pullbacks became more shallow with buyers desperate to get in the market. After putting in a flat top at 1705 in July and falling down to 162475, this was the second higher low after June's lows, and ultimately led to another higher high. The new highs were made as the Fed surprised the market with no taper and no Summers, capitulating shorts as the SP500 briefly took out the top of this pennant up to 172675. Since then, the SP failed to sustain the move, reversing to fall back to where it broke out into those highs at 1682. Coming back to this level gave new buyers an area to defend the pullback after seeing shorts squeezed up to 172675. Thus far, buyers have had a hard time turning the market back up. This has led the market to fall into its rising trend line from the June lows, giving another attempt at "higher lows". This time around, this trend line should not hold. Why? Because not only did we have a failure to sustain the move into 172675 to create a bearish weekly engulfment which have given bears an area to defend up to 1690s, but we also have bulls who are attempting to buy this dip in front of politicians attempting to come up with a deal on the government shutdown. Politics and markets never make a good combination. The bull buying the market now has to factor in this risk. Friday saw the market close on its highs as algos squeezed shorts and bulls hoped for a weekend deal on the government shutdown. When this did not happen, the SP opened 8 handles lower on Sunday, putting in the 2nd Sunday in a row where the market gapped lower. This has led the market to once again knock on its support trend line where bears are looking to breach the level and chase down to take out the June lows of 162475. Once this takes place, buyers from these levels will be shaken out and the market will confirm the move up to 172675 was a failed higher high. From here the projection can be seen for a retest at 1690 to develop a right shoulder for a head/shoulder topping pattern. For this to take place again, the market must confirm weakness by taking out the August lows and breaking this trend of higher lows and higher highs. For shorts to squeeze, 1692s must be taken out, which can then give way for a test of major resistance into 1710s. A strong bear in control will not allow this to take place. The market now has someone to blame when moving lower, and that will be the GOP, while "no taper" decision will look smart, when in fact, thus far it has marked the highs.
RISK DISCLOSURE: PAST PERFORMANCE IS NOT INDICATIVE OF FUTURE RESULTS. THE RISK OF LOSS IN TRADING FUTURES AND OPTIONS IS SUBSTANTIAL AND SUCH INVESTING IS NOT SUITABLE FOR ALL INVESTORS. AN INVESTOR COULD LOSE MORE THAN THE INITIAL INVESTMENT.

