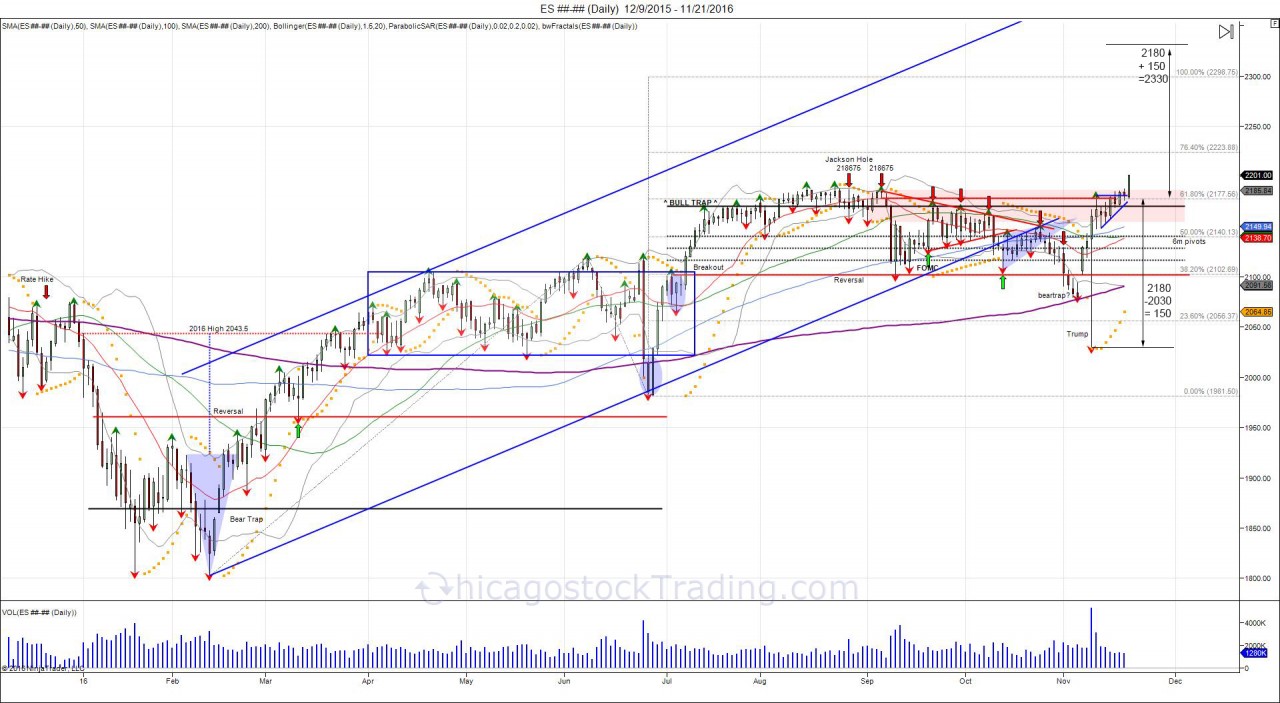
When Trump took hold of Florida on election night, the SP500 futures sold off to a low of 2028, hitting its limit of 100 points to the downside. The move, was reversed within the same day, seeing the market recover to push back to 2180 once the election was over and Trump was confirmed as the new President-elect. The election of Trump, caught many off guard, however the market reversal also caught many off guard as a majority was looking for a sell off should Trump have been elected. By taking the reversal of 2180-2030 of 150 points, this gave an upside objective of 2330.
The market began this year in a tight 2 week trading period going into the inauguration, trading in a range of 2240-2280, 100 handles higher from the election day. After the inauguration, the market pushed into 2300 which was the 6 month upper vol window, before seeing a minor pullback down to 2262 which retested the breakout. The retest of the breakout saw support with a follow through by pushing through the upper vol window of 2300, triggering a breakout and establishing a bullish bias for the first half of the year. This bullish bias, forced buyers to chase the market above 2300 in February, seeing the market run into a high of 2401 on March 1st. This exceeded our objective of 2330 by 71 handles. This high turned into a short term exhaustion right after POTUS first State of the Union. This low was retested the following month on April 17th, seeing a low of 232275 before bouncing back into 2360. The next leg or breakout higher, took place after the French election on April 24th, with the market gapping higher at 236575.
After seeing sideways chop in May, a correction down to fill the gap from the election was seen, which gave buyers an opportunity to step up and buy the dip.
$ES_F Globex fills French election gap @ 2348 overnight. Moment of truth for bulls. $SPY $SPX pic.twitter.com/aWs3oCmuHt
— 🌐 Chicagostock (@Chicagostock) May 18, 2017
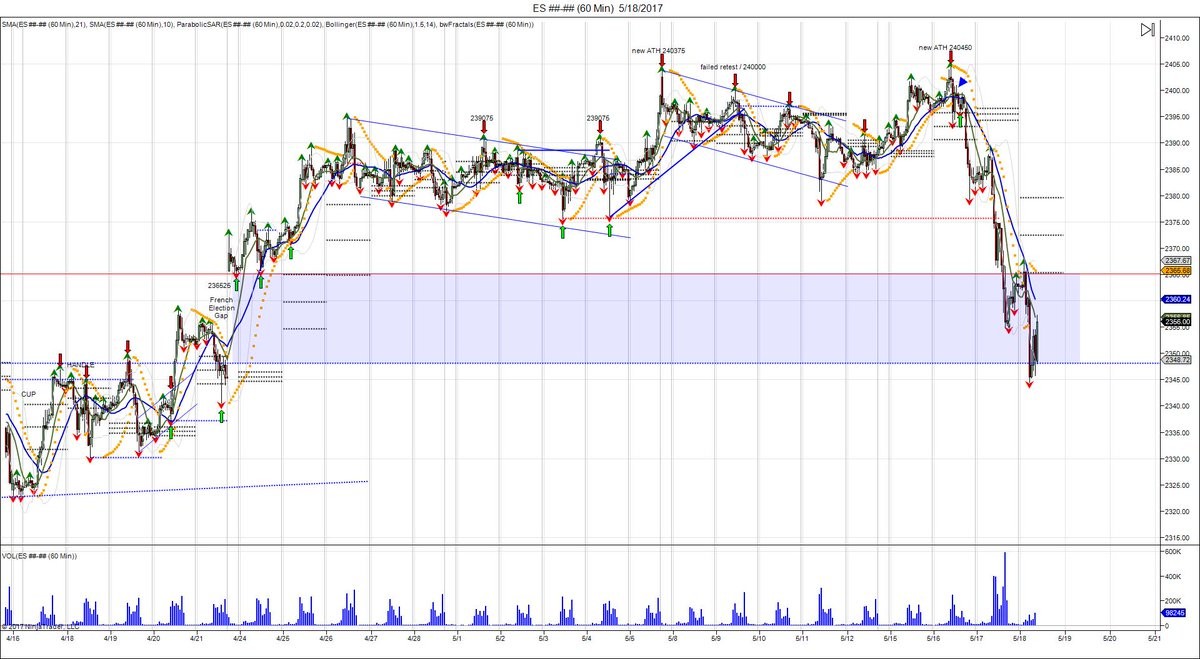
The gap was filled with a low of 234450 on May 18th, which was followed by a 5 consecutive higher opens, which turned into a V bottom as 2404 was recovered with shorts being squeezed through ATH's and longs being attracted back in. The V bottom, gave room to expand the 2404-2344 range up to 2464.
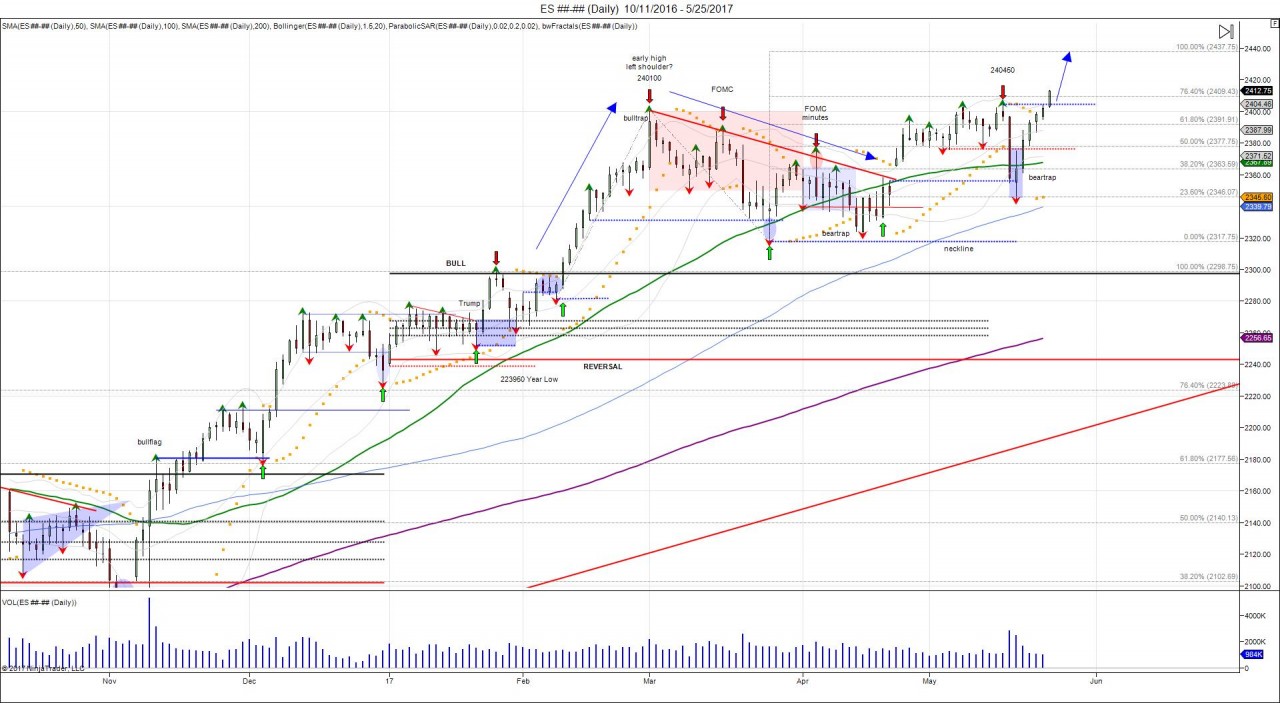
By taking the March high of 2401, down to the April low of 231775, this gave room up to the 100% fib extension of 243775.
$ES_F SP500 Next major level = 100% fib extension @ 2437 pic.twitter.com/9Vkc38eNZY
— 🌐 Chicagostock (@Chicagostock) May 25, 2017
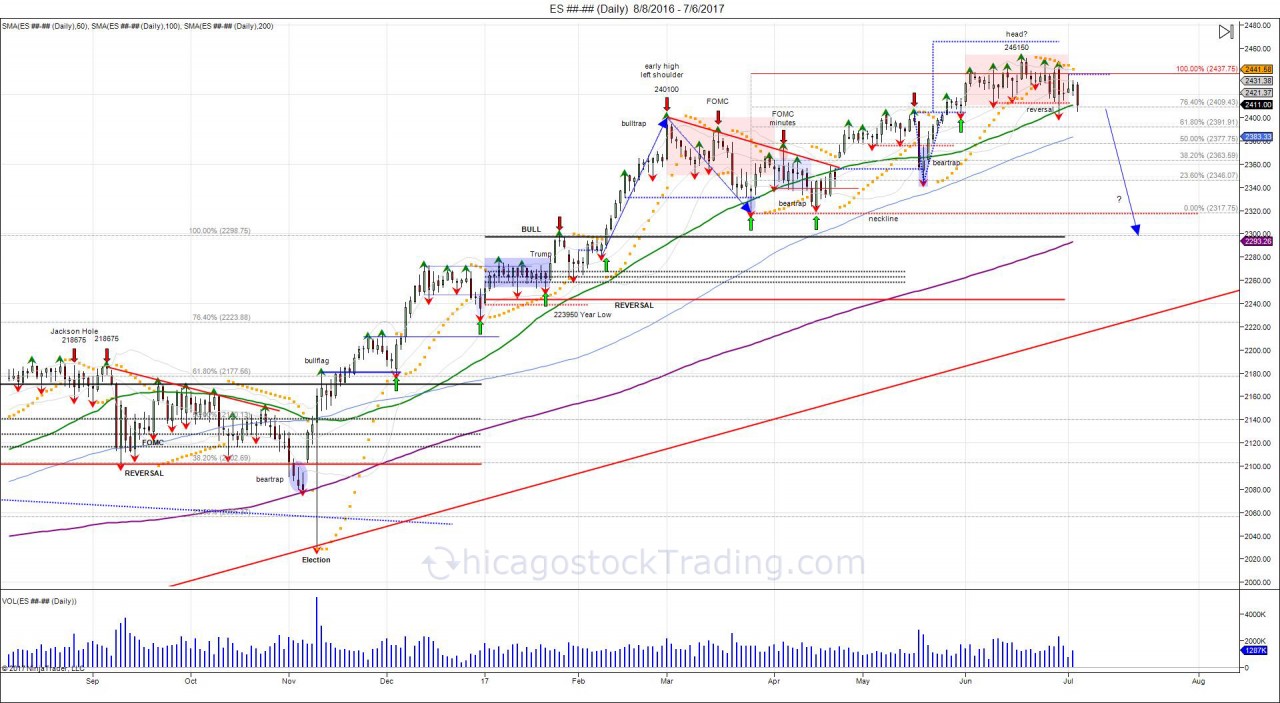
In June, the market began the month with a breakout into new highs, reaching it's 100% fib extension. For the remainder of the month, the market struggled to move past this fib extension level. On June 19th, the cash market gapped higher at 2440, using shorts to fuel a run to new ATH's of 245150, as well as luring in buyers above 2440. This turned into a failure as the market fell below 2440, leaving buyers that chased the market above caught on the hook.
$ES_F Bulls trouble recovering 2445 leaving buyers above from Monday on the hook.
— 🌐 Chicagostock (@Chicagostock) June 20, 2017

Since the new high of 245150 that failed, the cash market retested it on June 26th as a high of 244750 was made. This higher open gave bulls the opportunity to either drive higher and make new ATH's, or bail at break-even, creating more supply then demand, which is what took place. The higher open on the 26th of June was rejected, giving way to fall into a low of 2402 going into the end of June, before bouncing back to 2421. The close of the 1st half of the year, was strong, the market was up 185 points on the year or 8%, and 241 points from the election, or 11%. The problem going forward, is buyers that chased the market in the month of June are on the hook as seen with the start of July. July begins the 2nd half of the year and the first 2 weeks of the month is the opening range which can set the tone for the 2nd half as it creates new vol windows and pivots. As the month of July started, the market made a high of 243650, only to fall back below 2421 after the 4th of July holiday, seeing the market fall into 2405 to retest support from last month's low. Going forward, buyers are caught above 2420 and will need to overcome this new resistance and overcome the July high of 243650 to squeeze shorts and recover trapped buyers from June, giving another shot at ATH's. Failure to overcome 2420 and a breach of 2400, gives room to expand the market down to 2380 to retest the breakout from the May low. In order for these highs to turn into a top and or a "head" of a larger head/shoulder pattern to develop, a break below the April low of 2317, which is the neckline, needs to be seen. Doing so, confirms the breakout after the French elections into new ATH's as a headfake, giving opportunity to create a head/shoulder top as buyers get caught above. To those that have been buying the market over the last several months because of the POTUS, remember the actual objective of the "Trump trade" was 23330. Everything above that has been the gravy on top and late buyers chased the market above 2300 after February.
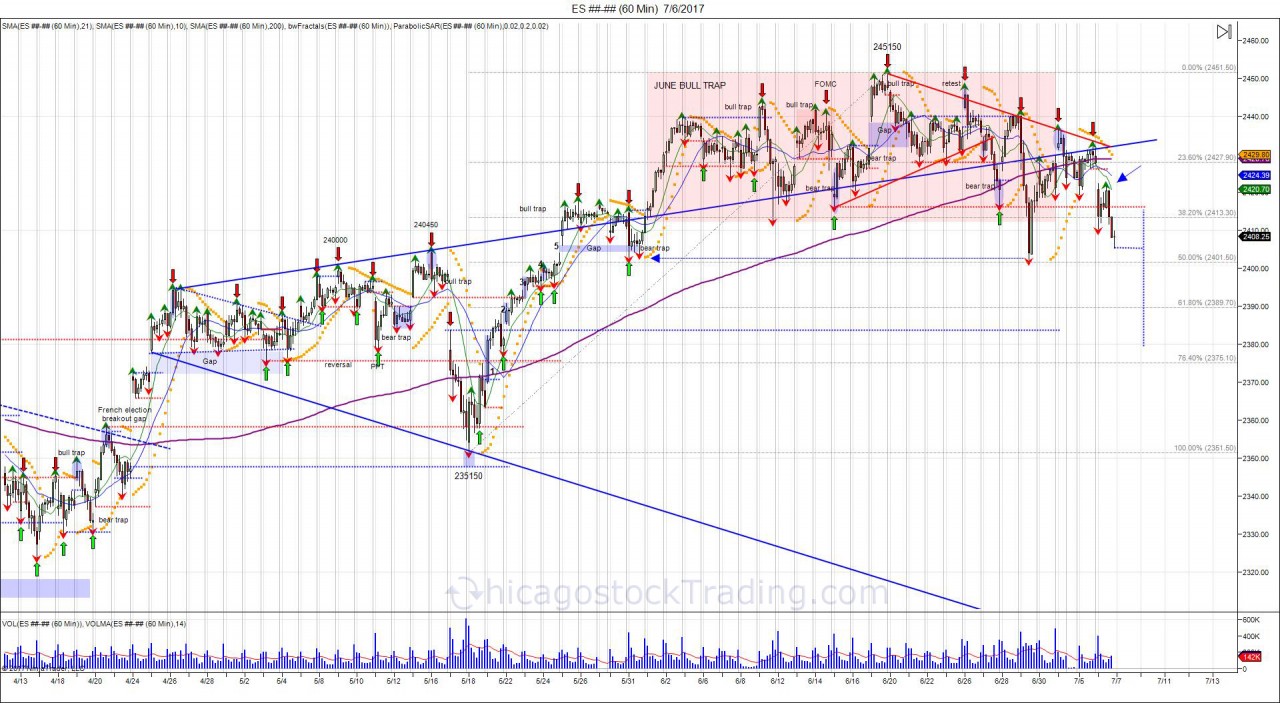
As seen in the cash market chart above, a massive pennant has been created from the April highs into the May low. May 31st saw a low of 240275, before squeezing through the top of the pennant to breakout and attract buyers as well as squeeze shorts. Notice the bull traps taking effect with the higher open on June 9th, June 14th, June 19th (the ATH), and June 26th (the retest of the ATH). Notice how after the June 26th retest, the cash market fell into taking out the May 31st low by 2 ticks at 240225, before catching a defensive bounce into the end of the month. To start July, the cash market opened higher again on July 3rd, printing a high of 243650, and failed as the cash market opened lower on Thursday July 6th, leaving buyers above trapped, and putting the market back inside of it's pennant. A seen, buyers for the month of June that chased the market are on the hook. Going forward, buyers will need an open above 2422 to trap sellers and attempt a recovery higher for a retest of the ATH. Cash open below 2405 on the other hand leaves buyers for the month of June trapped, giving way to retrace down to 2380.
With all that is said and done, our 100% fib objective of 243775 has seen the market turn the level into a lid. The Trump trade objective was completed in February at 2330, since then we have traded sideways before breaking out after the French election, once again forcing buyers to chase the market into new ATHs. Buyers piling in the month of June, buying these micro dips, are pushing the envelope and will need to see market overcome 2440 to attempt another push higher. For now that supply is trapped and question is if there are more buyers and enough demand to prevent a sell off. Since most are long to the teeth, the pain trade is seeing a move below the April low (neckline) to shakeout longs, and retrace the market back to 2300 which is where the market broke out in February. This is where it would allow an area for buyers to defend the pullback for a bounce back to retest the ATH.
Major bull trap set in Nasdaq > 5760 for recent "dip buyers" to overcome. Sell stops < May low 5550 $NQ_F $QQQ pic.twitter.com/hJ5xctlG5y
— 🌐 Chicagostock (@Chicagostock) June 14, 2017
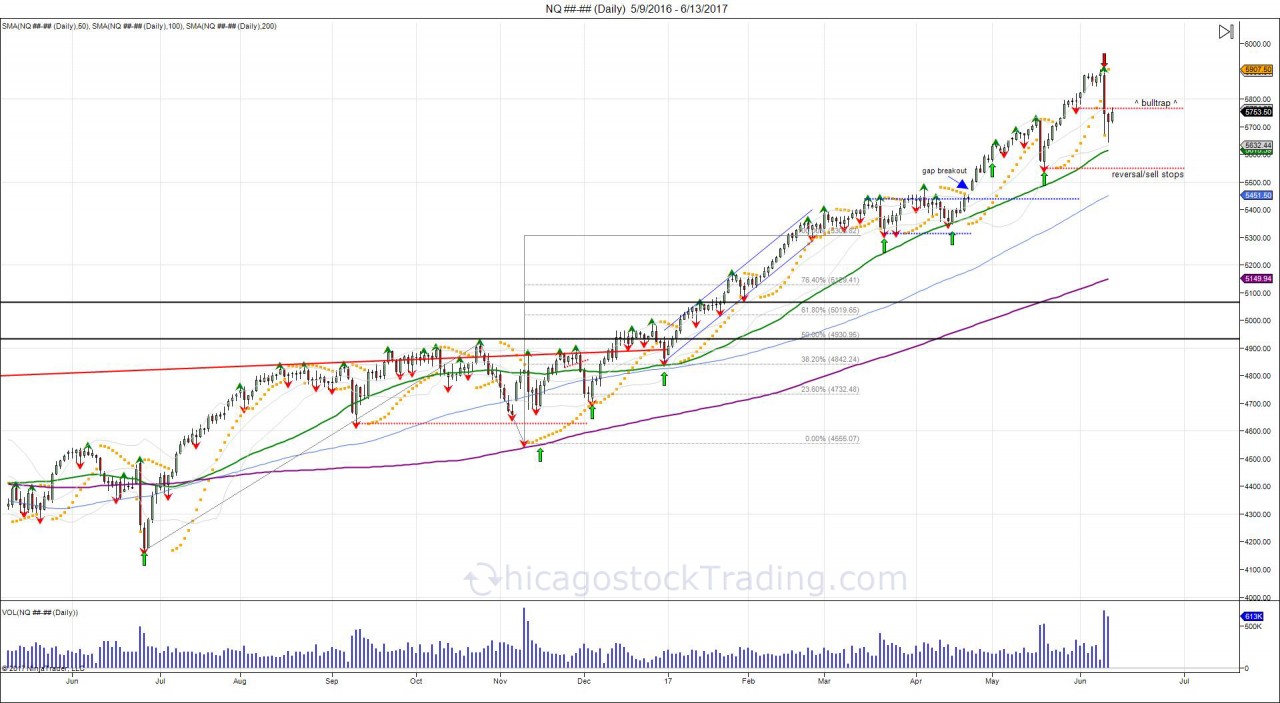
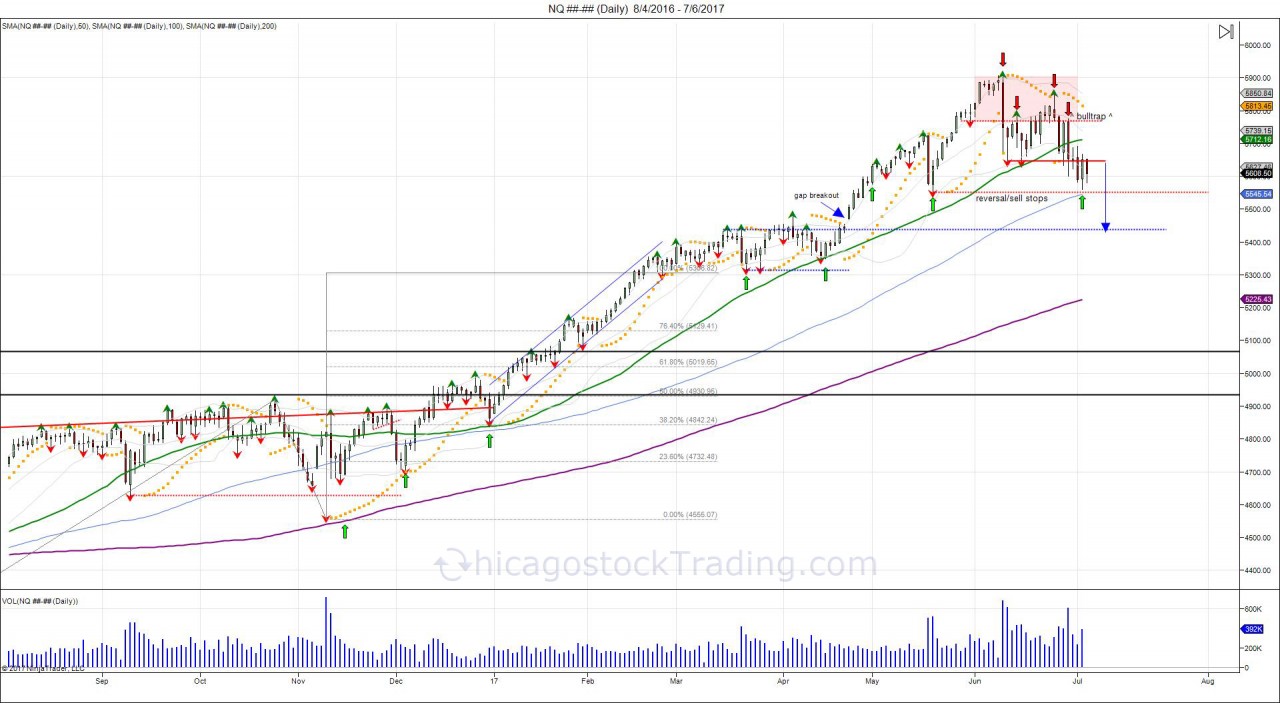
On June 14th, we warned of a major bull trap in the Nasdaq above 5760. Recall in May the Nasdaq fell to a low of 5550, before turning higher to squeeze shorts and lure in buyers on the breakout in June. By falling under 5760 in June, this left the new buyers trapped, creating new overhead supply and resistance. As seen in the daily chart below, Nasdaq buyers have had trouble overcoming 5760, and the algos are knocking on the door to the May low of 5550 where a breach of the level shakes out longs and confirms a failed breakout for the month of June. Doing so, gives room to retrace the market down to fill the gap from April 21st at 5442. To recover, buyers will need to overcome the July high of 5690 for another shot at 5760.
Subscribe to receive daily analysis and live short/long term trade recommendations.
February 2016 bottom: https://twitter.com/Chicagostock/status/701882994844311553

