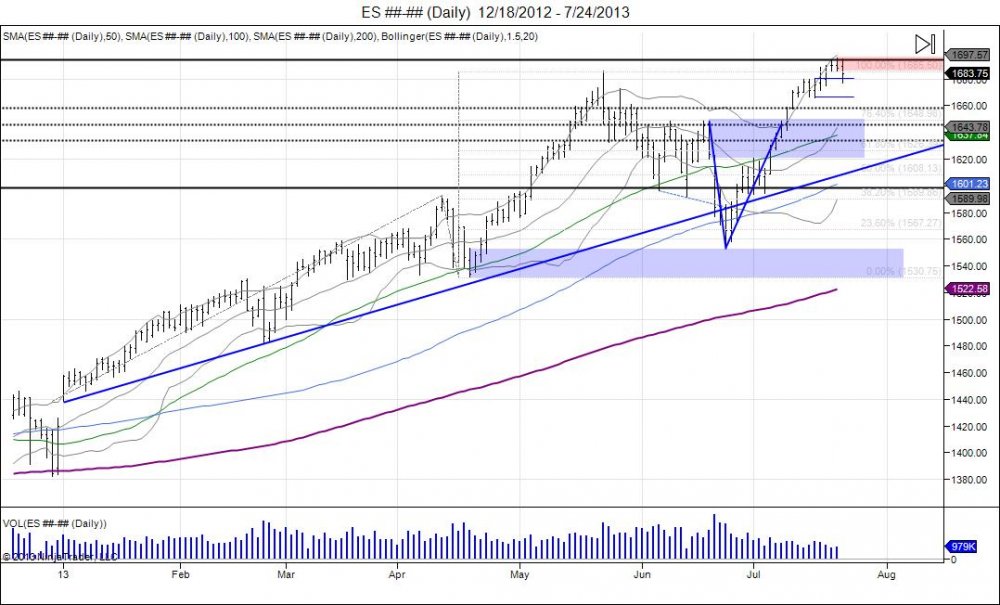
In the aftermath of what was Bernanke's last testimony to congress, equity markets squeezed new highs for the year just as the testimony wrapped up. Most congressmen were applauding the chairman for his service, somewhat having the feeling of a farewell party. The question is, if the chairman is leaving, does this mean the QE party is over and who will be last to turn off the lights? The uncertainty of the next chairman and actions is unknown. It's been quite a ride for the year, opening above 1440, last year's resistance, and seeing a gap and go breakout. Moving through all resistance and squeeze shorts in the process. This took 5 waves in the first half of the year, with 2 being minor corrective waves as tops failed.. Shorts squeezed and investors piling in, forced into equities on a QE high. This saw record highs of 168575 last May before longs began to sell into the squeezed bid to take profits. Bernanke scared investors out on June 19th with worries of tapering QE, seeing the market reverse lower from 1649. This started a shakedown and panic into testing major support based off 1530 which originally began the leg up through 1600. The bull strongly defended this test holding in the low 1550s to prevent the reversal in trend. The market was walked back up to the 1649 level just in time to give Bernanke a second chance on another FOMC release of July 10th, and creating a "V" bottom. Bernanke was able to calm the market enough to break through 1649, triggering a short squeeze to give way to take out the all time high from May. The latest and "last" testimony to Congress from the Fed chairmen had the market sitting on all time highs.
The SP500 followed the Transports lower Wednesday after failing to take out 3 day highs and setting up a small flat top. The bounce to test the highs was seen as Apple earnings led the stock to jump $20 higher, luring in buyers to the SP500 for a run through 1700, only to reverse lower and close below 3 day lows. The reversal has the market pressing against major support, within 1681-1665, based off last week's pivot higher. Failure to hold this range sees weakness in buyers and a reversal on the daily chart. This creates the potential for a double top with the market failing to attract new buyers after taking out the May highs. New money at these levels have new risk of uncertainty of the next Fed chairman. Next support seen at 1650, followed by 1615 with sell stops below 1550. Breach of 1550 targets 1530 Cyprus lows and the pivot that led into these all time highs. Minor upside resistance 1688-1696, break through needed for buy side to continue momentum.
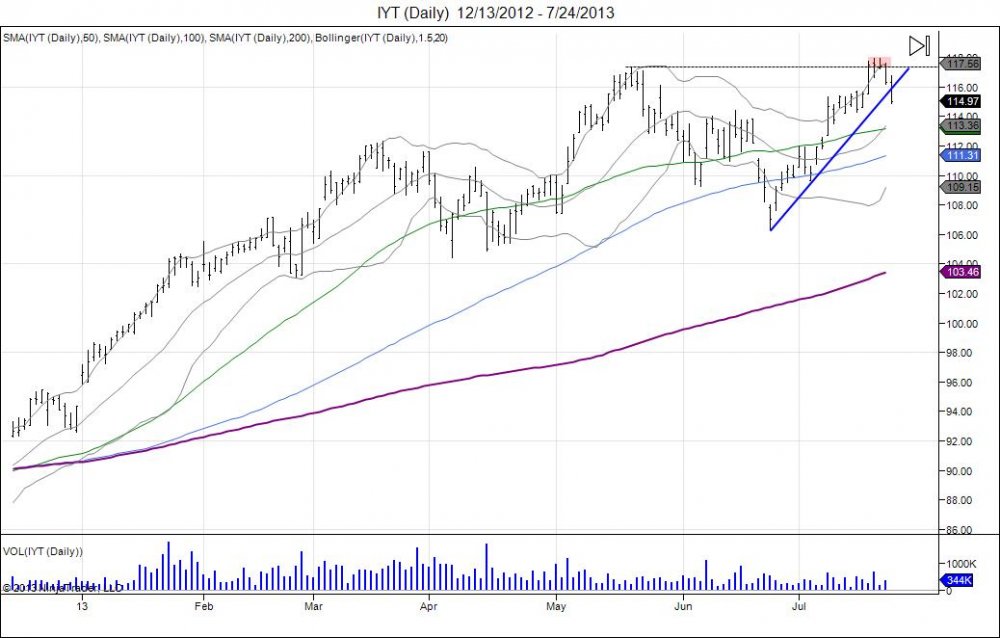
The transportation index led the equity markets lower on Wednesday as it broke its uptrend from the June lows. This comes after the market took out its May highs and put in a small flat top to fail to attract new buyers at the levels and see this small reversal. Sell stops seen below 114 with major support down to 111. Failure to hold 111 - 106 lows from June, sees confirmation of double top. Shorts have been taken out this market with the head fake in June and the move through the May high to squeeze them out, so now its up to real buyers to come in and defend prices or the market will drift lower. Resistance met against 116 based on recent reversal with recovery above 118 needed for bull to show strength.
RISK DISCLOSURE: PAST PERFORMANCE IS NOT INDICATIVE OF FUTURE RESULTS. THE RISK OF LOSS IN TRADING FUTURES AND OPTIONS IS SUBSTANTIAL AND SUCH INVESTING IS NOT SUITABLE FOR ALL INVESTORS. AN INVESTOR COULD LOSE MORE THAN THE INITIAL INVESTMENT.

