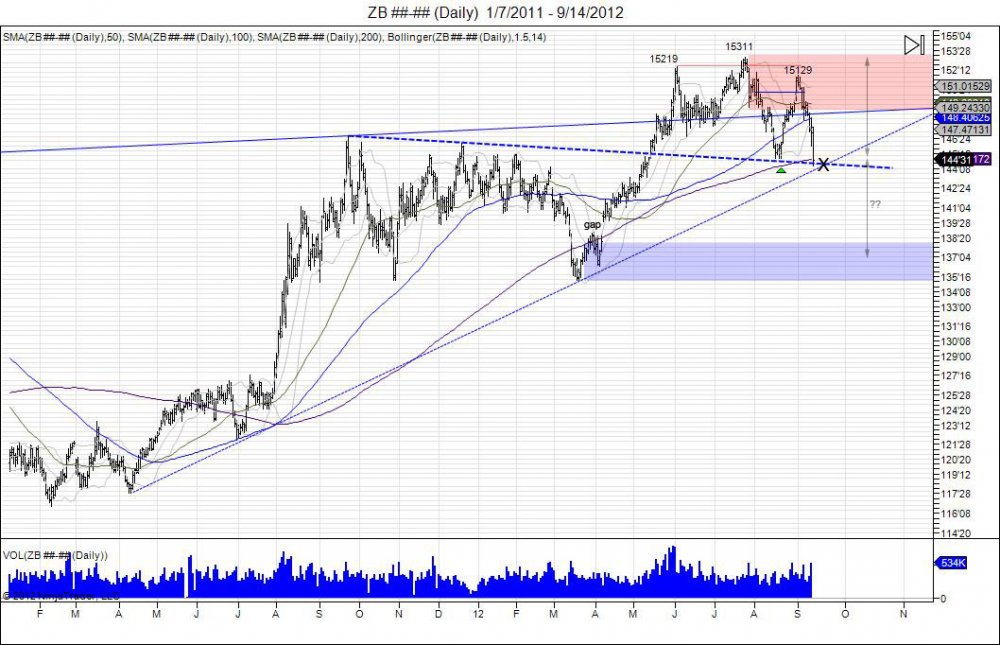
The 30 year bond market has fallen back down to take out its neckline made from the August lows of 14503. This comes as the market bounced off those levels to retest the June highs only to fall short at 15129 on the first trading day of September. Throughout the month of September, money has been coming out of this market going into the FOMC decision yesterday with lows of 14710. Following this FOMC decision to continue operation twist along with mortgage back securities, panic selling was seen in the bond market to be the catylst in breaking the August lows. This move has brought the market down into this major support level to test its neckline. Smart money that defended the highs in turn creating the right shoulder for this attempt to top have reached an area to cover part of any short positions. Should panic continue and buyers fail to step up to defend this neckline, the head/shoulder pattern completes at 13627 to fill the gap made in April within 13811-14015. Going forward, first level of upside resistance is met at 14605 being the lows from Thursday's FOMC. Thereafter, 14810-15129 is the next range of resistance being the right shoulder buyers must work through to target the highs of 15311 in squeezing out sellers and voiding out the h/s pattern. Last month's open was 15117 with a close of 15113. The market opened this month trading 15121, this is setting up to be a bearish engulfment for the month unless the market can manage to push back up to 15113 before the end of the month.
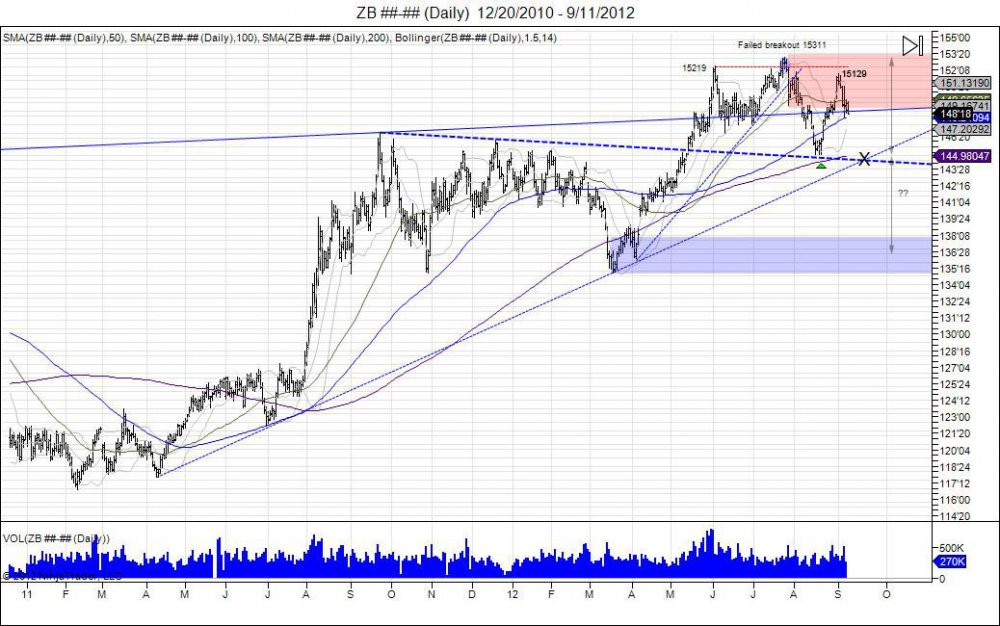
30 Year Bond Head/Shoulder Topping Pattern
For precise entry, stop, and target levels on day and swing trades along with updates, click here for more information.

