Last week, we took a close look at the intraday SP500 action and shared the view through vol windows. (Click to view). This week, we couldn't help but notice a very similar pattern. Take a look below at the chart comparison between last week vs this week, without Friday completed (tomorrow).
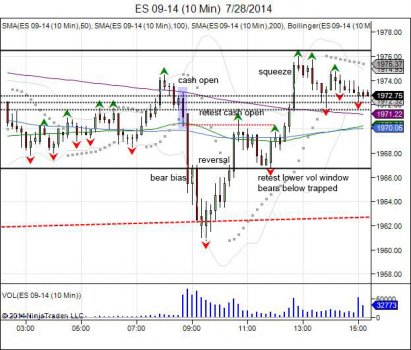
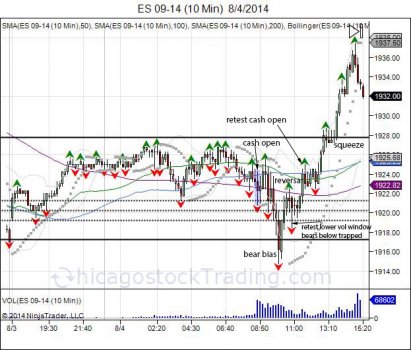
Monday's have become the bull trap:
MONDAY 07/28/14:
MONDAY 08/04/14
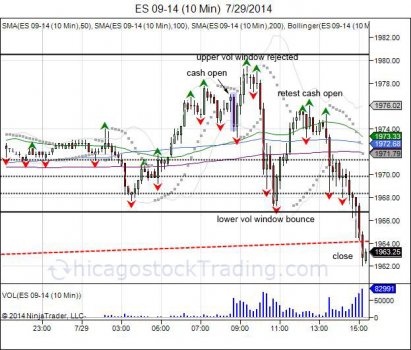
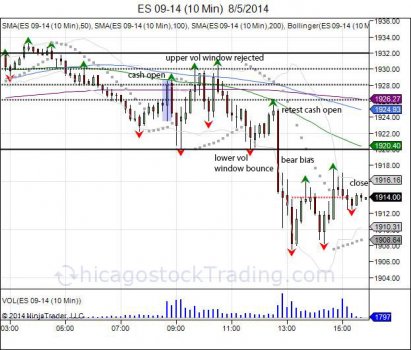
Tuesday a liquidation of these bulls:
TUESDAY 07/29/14:
TUESDAY 08/05/14:
Wednesday's gap open higher, or lower:
WEDNESDAY 07/30/14:
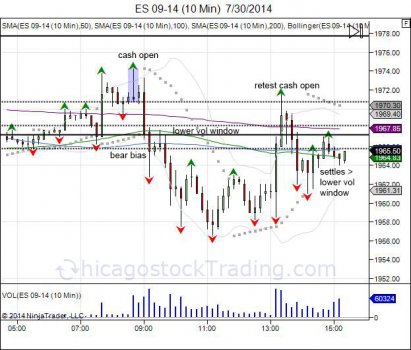
WEDNESDAY 08/06/14:
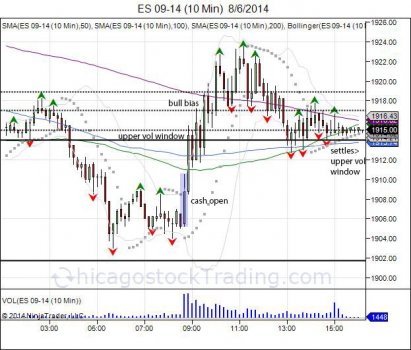
The contrast comes with this week Wednesday opening at new cash lows of 190525 and rallying higher to squeeze shorts selling into the "hole". Last Wednesday saw opposite effect with the market opening higher and trapping longs to liquidate into the close.
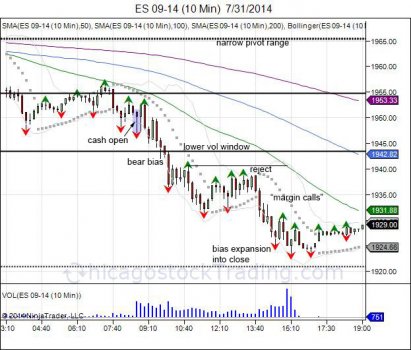
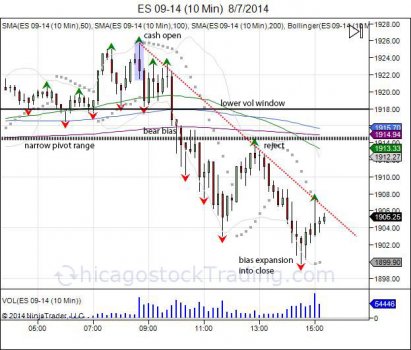
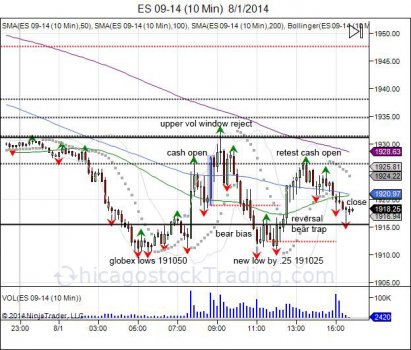
Thursday's seeing strongest selling pressure as bear bias expanded into close with both days having narrow pivot ranges:
THURSDAY 07/31/14:
THURSDAY 08/07/14:
Last Friday a major YOYO with the market opening higher from the Globex lows and falling down to retest them, only to trade in a sideways range as the highs of the day could not be breached:
FRIDAY:
Weekly:
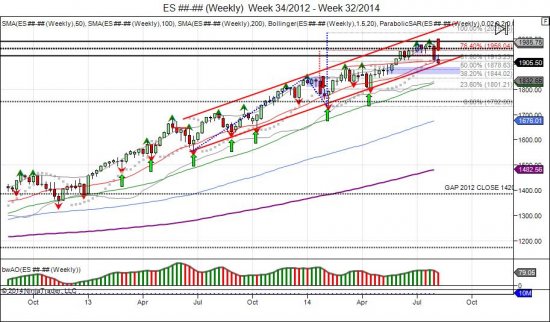
The SP500 has repeated its January 6 month open by selling down to establish bearish 6 month bias. In January, this turned into a bear trap as the market reversed through 1844 to squeeze shorts and held above to establish support. This range of 1844-1732 was eventually expanded up to 1955 in the month of June as shorts threw in the towel into the close of the 1st half of the year. With the second half of the year beginning in July, the market also traded sideways followed by a new high up to 198575 that created an intraday double top. This high was never taken out, with the market falling down to reverse and take out its July low of 194250, confirming the breakout higher as a failure and leaving longs above holding the bag. This has led the market to pressure the downside as sellers smell blood and are pushing the limits once again. A bearish bias has been established for the 2nd half of the year with the market holding below 1932. This has thus far led to a test of 1900 with major support down to 1890 to retest the breakout seen in May. Failure to hold the May lows of 1859 shakes out longs defending this support and confirms b/o failure on weekly basis. This would give way into testing next major support down to 1830 with sell stops below 1800. Failure to hold 1800 as the April 2014 lows, breaks the 1.5 year upward bullish channel, which gives room for the market to target higher lows prior to 1800 at 1732, 1640, and ultimately the 1553 low from May of 2013. Gap down to 1420 from 2012 close remains open, and eventually will be filled. Buyers must defend down to 1890 and setup another bear trap by recovering above 1932 to retest major resistance against 1960. To reverse the 6 month bear bias, the market must be able to hold above 1977 to develop support and trap sellers from below to use as squeeze through recent highs of 1985 and into next major resistance against 2025. This will take a lot of work, as right now it seems the market is more long then short, and that favors continued liquidation. The 6 month pivot range as seen in weekly chart is also tight, which within 196175-196208. Narrow pivot ranges tend to indicate a lack of decision during the previous session and room for volatility to expand. Thus far we have already seen a 71% increase in volatility from the July 3rd lows of 1028 to recent highs of 1757. Below shows charts of the bottom developing after the market took out its 2013 lows and rounded out a bottom.
Chart on $VIX from last night showing inverted head/shoulder pattern. Above last high 1323 confirms http://t.co/YSwBuTIFhH
— Chicagostock (@Chicagostock) July 17, 2014
The confirmation:
$VIX Confirms inv h/s pattern w move back through July highs. Tgts 16+ http://t.co/77JVUuiyiX
— Chicagostock (@Chicagostock) July 17, 2014
$VIX PRESSURE VS APRIL HIS FOR CAPITULATION/SQUEEZE ST / CONFIRM FAILED B/O <11. 1360BUY TGT35 http://t.co/AxtNZ3fP0u
— Chicagostock (@Chicagostock) August 5, 2014
Going forward, volatility is consolidating its squeeze back to retesting the April 2014 highs of 1785. Shorts will be forced to cover as pullbacks down to 1360 offer new support based recent lows. A move through the 2014 high of 2148 confirms the 2014 lows as a failed b/o of the 2013 lows and gives way to expand the 2013 range of 1087 (2192-1105), up to 3279 (2192+1087).
RISK DISCLOSURE: PAST PERFORMANCE IS NOT INDICATIVE OF FUTURE RESULTS. THE RISK OF LOSS IN TRADING FUTURES AND OPTIONS IS SUBSTANTIAL AND SUCH INVESTING IS NOT SUITABLE FOR ALL INVESTORS. AN INVESTOR COULD LOSE MORE THAN THE INITIAL INVESTMENT.